

Alistair Berg
For the past 6 years, Gilead Sciences (NASDAQ:GILD) has been trading in a tight range between $60 and $80. Each time the stock breaches either level, the price is not sustained by any measure and is able to be traded rather predictably.
As the stock current sits over $80, $83 as of Monday morning, I likely take a contrarian view in the current market and give Gilead a sell rating and a price target of $70. While I don’t see a recession impacting Gilead in a way that would cause a substantial decline, the stock is near its ceiling in the trading range.
With a PE ratio under 30 and attractive dividend of about 3.7%, Gilead is an attractive stock but will be a far greater buying opportunity under $70, but ideally a great buy under $64.
How should you play this stock?
Swing and short-term traders should look for shorting opportunities as the stock sits near and over $80. I would however be cautious on position sizing and watch for near term catalysts that could potentially push the stock to over $86.
Long-term investors should continue to look to add to Gilead positions under $70 and collect dividends as well as potential long term appreciation in share value. As the stock begins to trend back to the lower end of the range, my sentiment will change to look for upside and a retracement back to the high $70’s.
Risks Shorting Over $80
There is an inherent risk in shorting a stock. There is a chance that the stock can continue to rise in value and has an undefined cap, meaning that there is a theoretical infinite loss possibility with shorting. If you do put on a short, look to put a stop loss order on at $90. The stock has not reached $90 in 6 years and is unlikely to extend that far. However, it will likely have a large breakout run if it does breach $90 and you do not want to get caught in that.
Gilead has a short borrow fee of just 0.3% APR, which makes it an attractive short to hold for 6-12 months with a price target of $64. The cost to borrow shares of Gilead may rise, but with the number of outstanding shares and daily volume, it is unlikely that locating shares to borrow will be impacted and the borrow rate will rise significantly. With an average daily trading volume of 8 million shares, the company’s shares are not hard to locate when shorting and you will have no worry of liquidity with this stock.
Short interest on Gilead is currently around 19 million shares of the 1.2 billion shares outstanding, or approximately 1.5% which is insignificant and has little impact on the price action of the stock.
Historical Trading Range
Gilead Stock Chart from 09/2016 to Present (Trading View)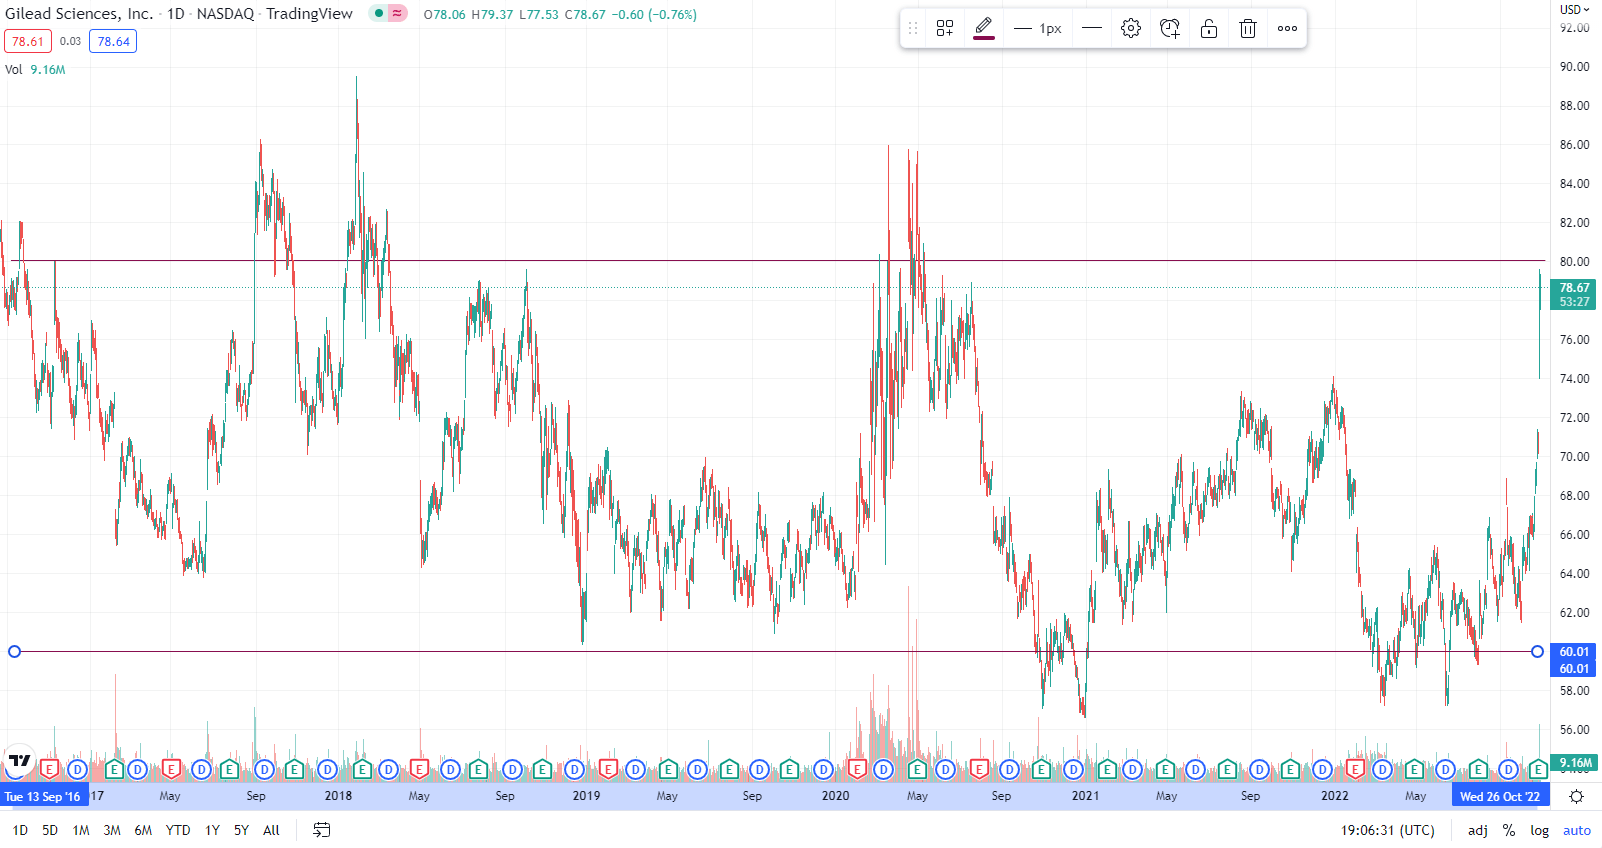
As you can see from the above stock chart, Gilead has been trading in a relatively tight range with few breakouts above $80 and below $60, that do not last for extended periods of time.
Since the latter half of 2016, there have only been 5 periods where the stock has gone above $80, and 5 periods where the stock has gone below $60.
The longest stretch that a breakout was sustained was at the start of 2018 where Gilead broke above $80 for 14 trading days. It then stayed around $80 price range for 28 trading days, where it began to a consistent decline to $64 over a two month period.
Entering a short at $83 and holding for 2-3 months would likely yield positive outcomes if this trend were to continue. I see a short term 3-month price target of $70 with the stock nearing $64 in roughly 8 months.
Breakouts Above $80
In the second half of 2016, Gilead traded above $80 a handful of times, with the final trading week reaching that price at the end of September. Share prices recovered momentarily in early November, briefly touching a high of $80 exactly before quickly receding by 5%.
It took a whole year for shares to climb back to $80, not happening until early September 2017 where it traded up to as high as $86 before slowly declining back to $80 over nearly two months. Driven by the exciting announcement that the company is acquiring Kite Pharma for nearly $12 billion. This was followed by a sharp decline to a low of nearly $70 in late October following third quarter 2017 financial results that showed a year over year decline in sales across the board of HIV, HBC, HCV and other products including Letairis, Ranexa, and AmBisome.
Gilead Stock Chart 2017 – 2018 (TradingView)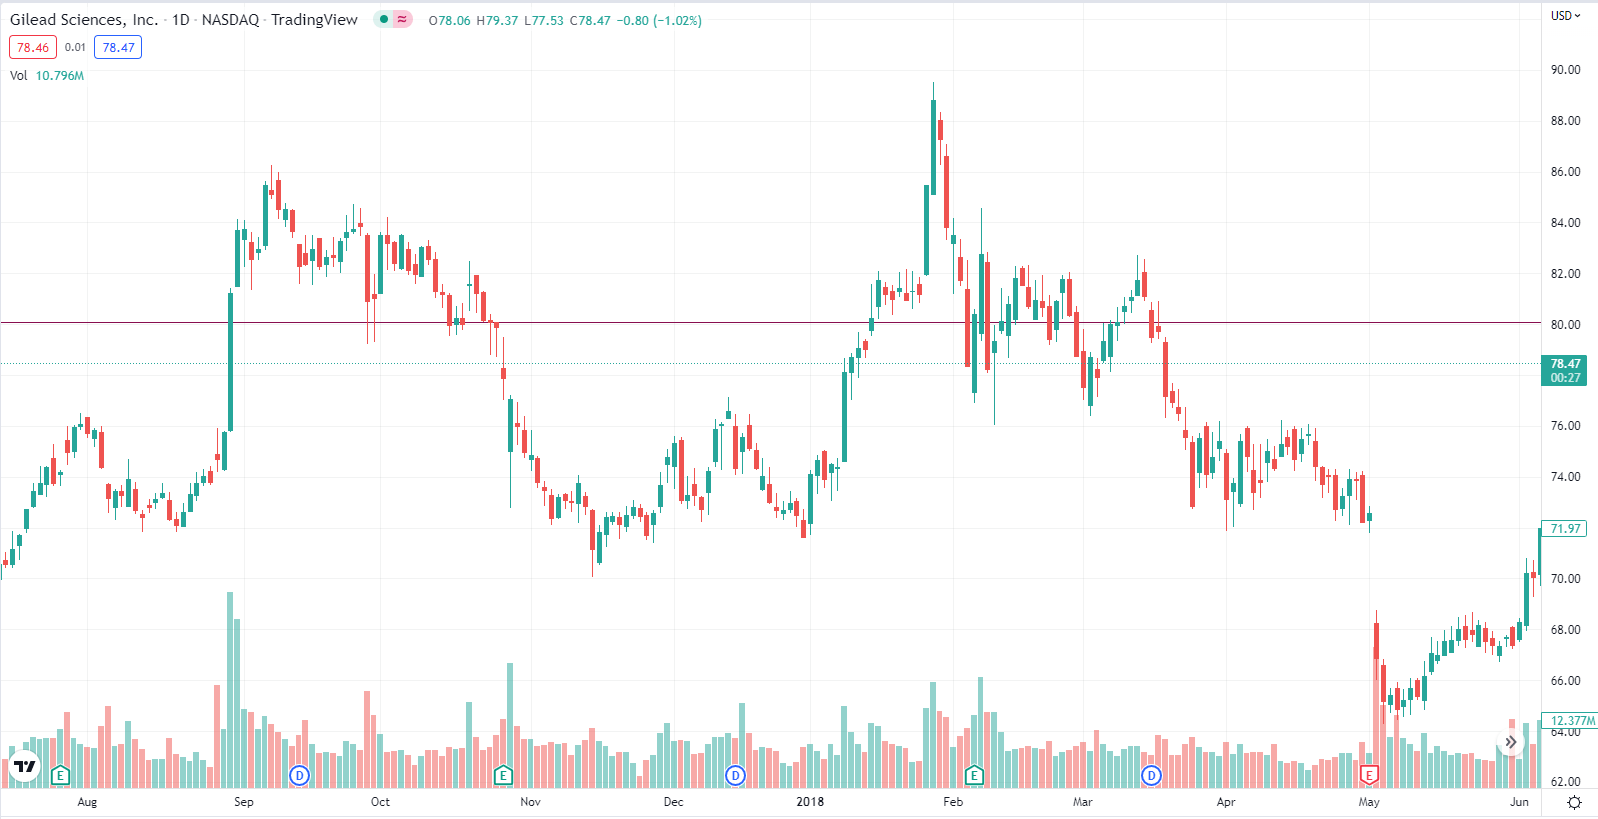
As you can see, this recovery spike at the start of 2018 was also not sustained. Breaching $80 for just over 15 trading days and temporarily spiking to nearly $90 off excitement of fourth quarter and full year 2017 financial results, Gilead was unable to sustain a prolonged price level that stayed above the top end of the range. The stock dropped under $80 once again in March.
Finally, the last move above $80 was seen at the beginning of the COVID-19 pandemic where the company experienced heightened volatility and speculation around its COVID-19 action plans. From March 2020
In February of 2020, Gilead went from $64 in February to a high of nearly $86 in March. With large daily swings driven by COVID-19 uncertainty and the pouring of institutional investments into healthcare, the stock bounced between mid $60’s to low $80’s on a weekly basis, until it began a consistent decline in July.
The stock had not been able to breach the top of the threshold since the middle of 2020 during the height of the pandemic, until the end of October. On the back of third quarter 2022 financial results, and supported by the FDA approval of Vemlidy for the treatment of hepatitis B in pediatric patients, The stock has breached $80 for the past few days.
I believe that in line with Gilead’s historical movements after a sharp increase in share value, the stock will begin trading back under $80 before Thanksgiving and trend down through the remainder of the year to $70.
Breakouts Below $60
Breakouts below $60 should be a buy under almost any circumstance, aside from massive drug and platform failures that doom the company. It is hard to see a reason for a suppressed stock value below $60 that would leave Gilead at a sub $75 billion company, especially given their numerous upcoming catalysts, increasing rate of M&A activity, and the potential in their HIV platform.
Since 2013, Gilead has only crossed below $60 on 6 occasions. All 6 times have happened in the past two years since October of 2020.
Gilead Stock Chart 09/2021 to Present (TradingView)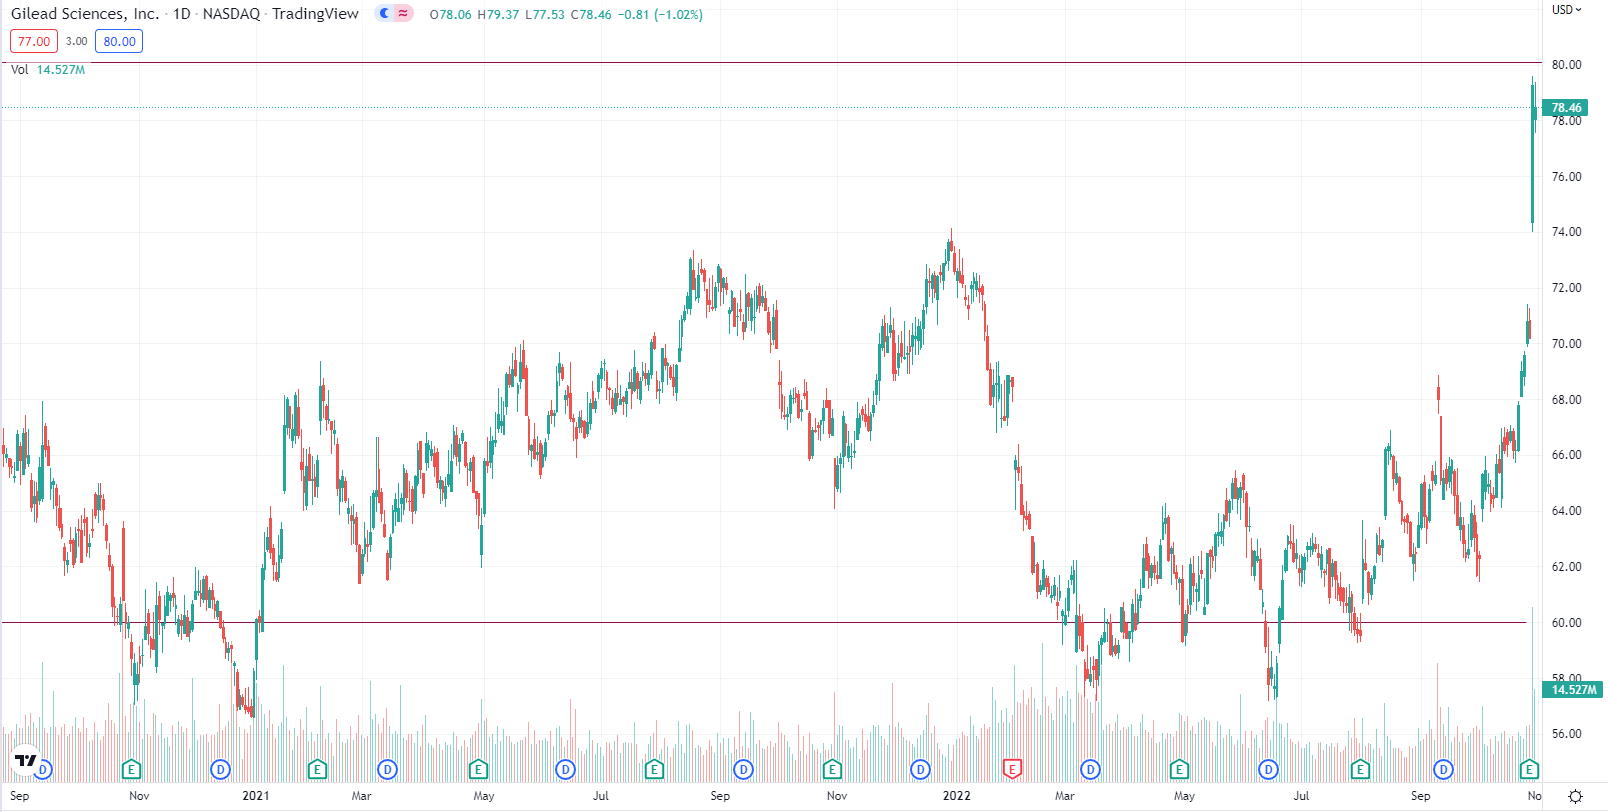
In October 2020, the stock saw its initial large drop off of the news that the Hart-Scott-Rodino waiting period for the offer to acquire Immunomedics had expired. Starting the downward pressure with nearly a 10% decline in share price, there was high volatility over the next two months where the stock fell to a new low of $56.60.
After recovering and experiencing an up trend through all of 2021, downward pressure began earlier this year in January. The stock fell from $72 in January to under $58 in March as the overall market began to reel from all time highs. There was only one negative catalyst announced in January, a partial clinical hold on studies of Magrolimab in combination with Azacitidine, but I don’t believe it truly warranted a20% or more fall in share price. In fact, the company announced numerous positive catalysts in the first 2 months of the year including an FDA approval of new label for CAR T-Cell Therapy, FDA approval of remdesivir for treatment of patients with at high risk for COVID-19, and new Phase 2/3 clinical data supporting sustained efficacy of Gilead’s HIV-1 capsid inhibitor.
Following this new low, the stock recovered back into the mid-$60’s before declining over 10% and recovering over 10% all within 3 weeks, likely driven by shorts covering and correction from such a rapid and overdone sell off.
Recent Price Action
Since June of this year, the stock has traded in the high $60’s until the end of October. Last week, Gilead announced third quarter 2022 financial results that show impressive revenue increases, moving the stock in the low $80’s. With Veklury (remdesivir) sales increasing 11% year-over-year, Biktarvy increasing 22% year-over-year, and oncology sales increasing 79% year-over-year, it is no shock to see the sudden move upwards. The share price has also been supported by the FDA approval of Vemlidy on November 2nd.
No surprise though, the stock’s recent high of almost $84 has been a bit of a cap for the stock as the price receded to almost back under $80 on Friday November 11th. Monday morning of the 14th, the stock is trending back higher, almost getting back to $84. I believe that this will continue to be a ceiling for the stock, especially as the U.S. economy begins to enter into a recession.
Catalysts May Push Stock Higher
I give Gilead a sell, but the company has several large catalysts that may push up and keep the share price sustained over $80. It would be good for investors to look at how they feel positive data and catalysts may impact the share price. Despite previous great news during the bull markets in 2020 and 2021, the stock never inflated substantially above $80.
- Arcus Biosciences (RCUS) and Gilead will have some topline data by year end for the Phase 2 ARC-7 (with full data 2023) with ORR but progression free survival may not be mature enough to be read out. This is being interpreted with mixed feelings by investors. Analysts expect ORR to be positive above 60% given they moved into two Phase 3s (ARC-10 and STAR-121).
- Gilead will have 9 studies by year end in NSCLC. Highlighted by Phase 3 data in 2L+ vs docetaxel in 2023. 1L is a massive market opportunity and there are 2 ongoing Trodelvy studies in 1L:
- Phase 2 EVOKE-02 (Trodelvy+ pembro +/- Pt chemo)
- Phase 3 EVOKE-03 (Trodelvy + pembro in PD1+ pts)
- Gilead is making progress in HIV, with Phase 1/2 antibody data expected in 2023. The long-acting HIV market recently announced real-world evidence of Biktarvy’s use in patients with co-morbidities, which shows real promise for the program.
- Sales of Remdesivir may improve and see spikes as COVID may continue affecting the world. Oral alternative and treatment is a large market opportunity that is unmet medical need.
Summary
I believe in the long-term value of Gilead. I think any price under $66 is a must buy and under $60 is a steal. I do however believe that there has now been a long established range that the stock is trading in that warrants concern for investors who want to buy when the stock is near $80.
Despite positive earnings and forecasted growth, FDA approvals and positive data readouts, there seems to be no catalyst or news that allows Gilead to sustain a share price over $80 for more than a few weeks at most. Conversely, when shares drop below $60, there seems to be great interest in the stock and no negative news can suppress the company for long as it quickly retraces back to over $60.
I reiterate my sell rating. I believe a short sale on the stock at $83 may be tested as some more upside could be seen through several upcoming catalysts, but stand behind the position with a 3 month price target of $70 and 6-12 month price target of $64 as investors put on short positions at these high valuations and long investors take profits following a more than 25% increase in share price since May 2022.
Be the first to comment