

Justin Sullivan
Thesis
I wrote a few bull articles on Gilead Sciences (NASDAQ:GILD) in the past. My first article was published more than 1 year ago in July 2021. The article was so bullish that it suggested the use of a long call option, as given away in its title “Gilead Sciences – Perfect Setup For Long Call Option”. At that time, the stock prices were ~$68, and the P/E ratio was only 12.5x. Fast forward to now, the stock price has risen to ~$86.5 as of this writing, and the total return is about 36% as you can see from the following chart. In contrast, the S&P 500 lost about 10.3%.
Source: Seeking Alpha data
As a result of such large price appreciation and lowered EPS projections, the stock’s FW P/E now stands at 23.6x, almost double the 12.5x when I first wrote my bull thesis. There are certainly positive catalysts, and I see its business as fundamentally healthy. In particular, I am optimistic about its HIV medicines and also the potential of its new breast cancer drug (Trodelvy). In recent quarters, sales from HIV drugs have enjoyed robust growth with an annual rate exceeding 8%. And now HIV drug sales account for about 68% of its total sales. Its most prominent HIV fighter, Biktarvy, enjoys an even better growth rate (around 28%) YoY. Such growth is largely due to HIV patients being able to return to clinics for treatment as the pandemic disruptions keep fading. And its new breast cancer drug (Trodelvy) showed great progress and promise too. Back in August 2022, the company announced that Trodelvy showed ”statistically significant and clinically meaningful results” in Phase III clinical trial.
However, the current 20+ PE leaves a margin of safety that is too thin in my view. And I am downgrading the stock from “buy” to “hold”. And the remainder of this article explains more details about the downgrade, and also recommends some alternative ideas in the biotech space.
GILD: a broader context
Let’s take a broader view first by comparing GILD to the biotech sector approximated by the iShares Biotechnology ETF (IBB). The chart below compares the price returns (excluding dividends) and total returns (including dividends) between GILD and IBB. And By the way, GILD is the largest holding in IBB, representing about 9.85% of IBB’s total assets as of this writing (followed by Amgen Inc, 8.59%). As seen, IBB’s price has actually suffered a loss of 9.7% over the past year. And in terms of total return, IBB lost about 7.7%. GILD, on the other hand, has delivered a total price appreciation of 22.7% in the past year, leading IBB by more than 32%. And because of its much higher dividend, its lead in terms of total return is even better: almost 39%%.
Source: Seeking Alpha data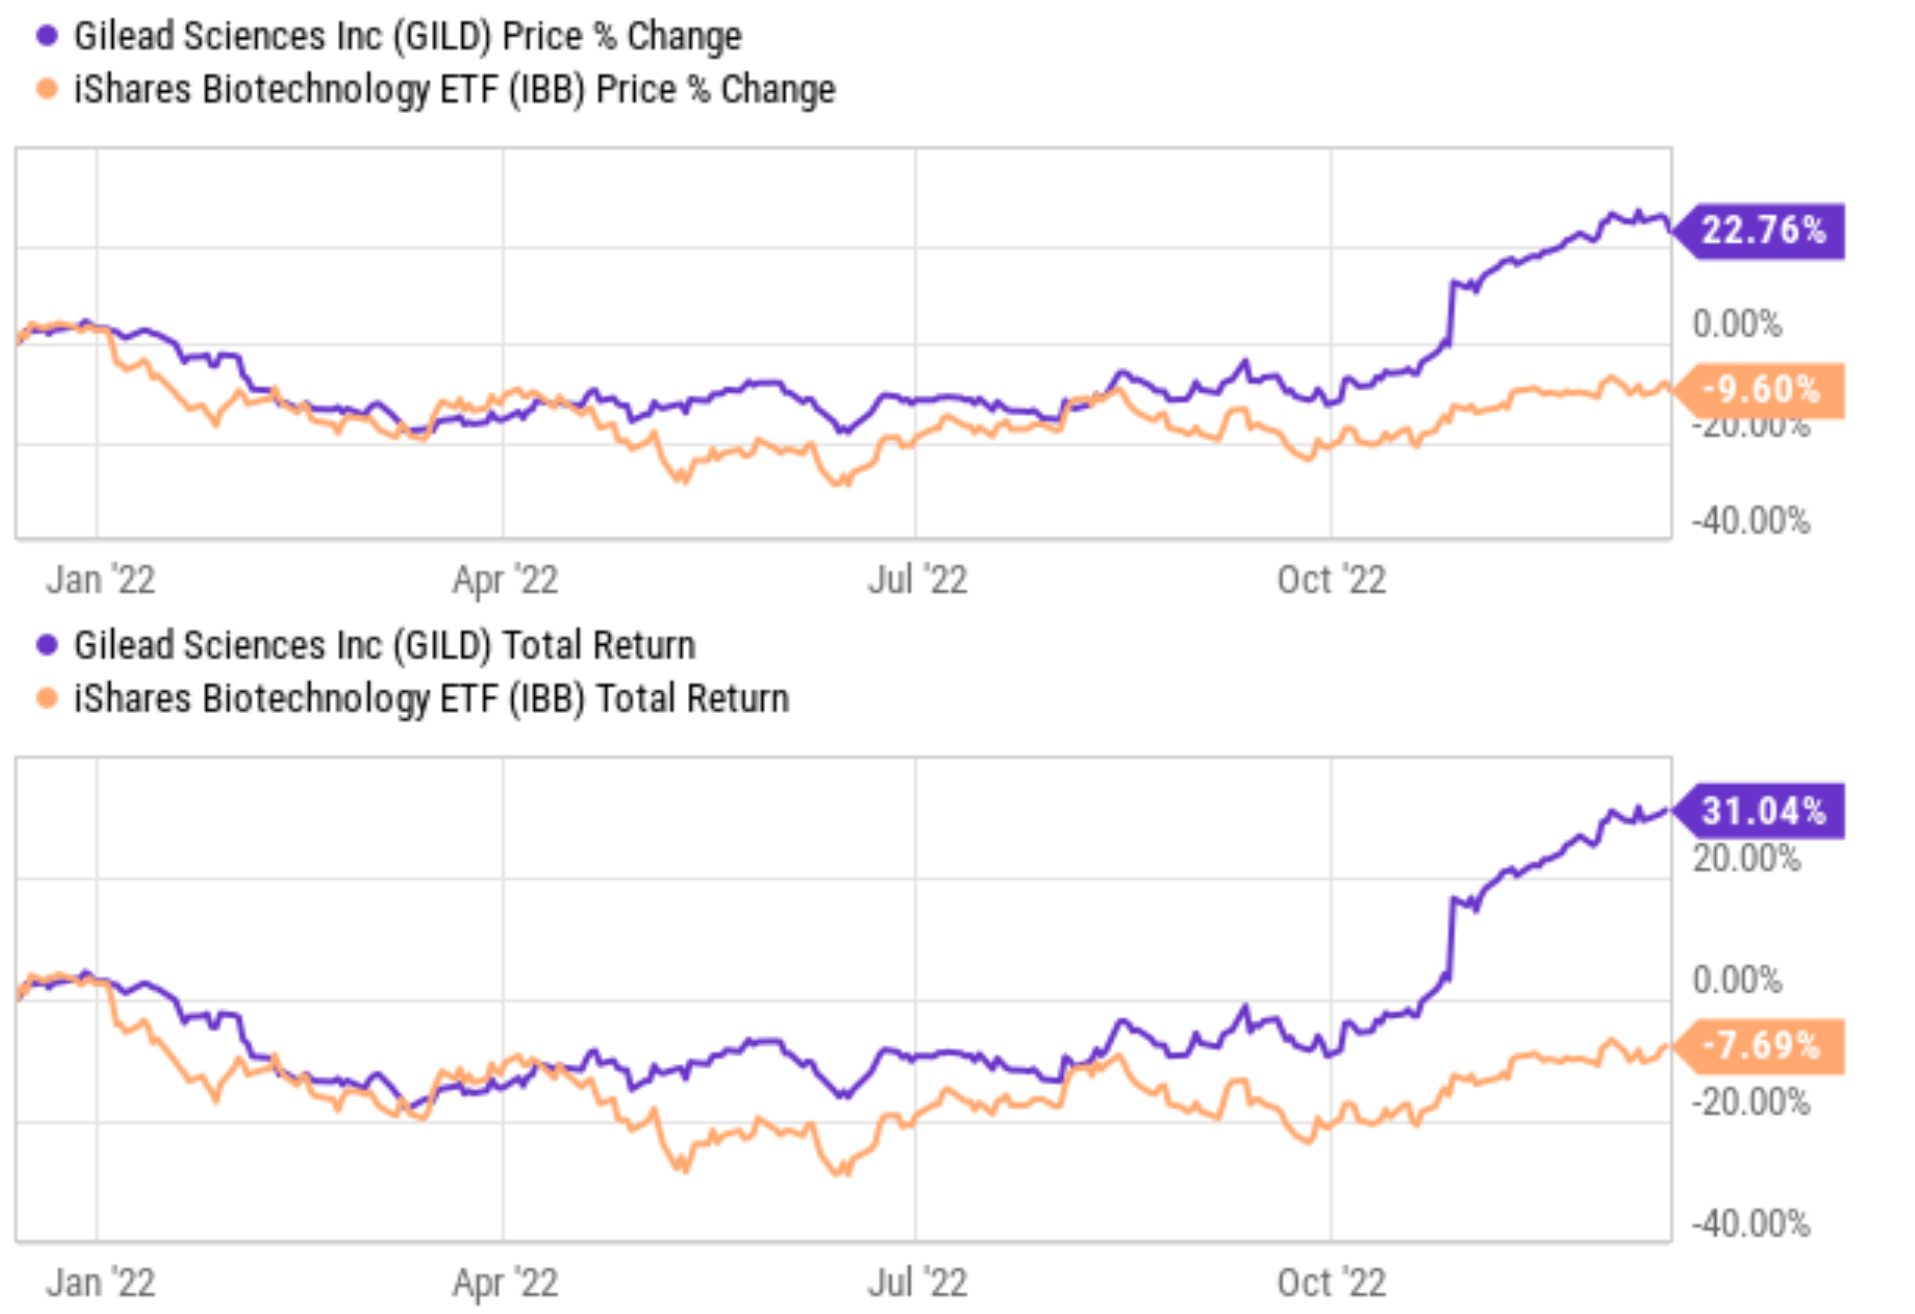
Due to such divergence in the price movement, GILD is currently at a valuation that is near its historical peak. Judged by its dividend yield, as you can see from the next chart below, its current yield of 3.3% is near the bottom level in the past five years. While in contrast, IBB’s valuation, again judging from its dividend yield (0.3%), is currently near a peak level in its five-year history as you can see from the second chart below.
Note that we’re not suggesting you purchase IBB or purchase IBB for the sake of its dividend yield. Here we’re just using the dividend yield as a valuation metric. And these results show that, for investors interested in the biotech space, there are many other more interesting candidates in the IBB funds than GID. For example, IBB’s second largest hold, Amgen Inc. (AMGN) is a more interesting candidate as argued in our recent article. AbbVie Inc. (ABBV) is another stock that I like better (and also hold) in this space.
Source: Seeking Alpha data Source: Seeking Alpha data

GILD’s capital allocation and business prospects
Besides the expensive valuation, there are a few other things that motivated our downgrade, as reflected by the total shareholder yield. As detailed in my earlier writings:
For investors who do not need current income yet (like myself), I prefer to look at the total shareholder yield instead of the dividend yields. Total shareholder yield consists of cash dividend yield and also buyback yield. For readers new to the concept, the buyback yield is the amount spent on repurchases divided by the market cap of a company (just like dividend yield is the total amount of dividends paid divided by the market cap).
As seen from the chart below (top panel), GILD has been aggressively buying back its shares between 2014 and 2018. Such an aggressive payback translates into a net common buyback yield in the range of 4% to 12% in those years, both adding a substantial boost to total shareholder returns and also serving as a strong demonstration of the company’s cash generation ability.
However, starting in 2019, the share repurchases have slowed dramatically. And as you can see, currently the net common buyback yield is 0.46% only, contributing almost negligibly to the total shareholder return. And more importantly, it serves as a sign that the company’s capital allocation options are more limited at this point. Indeed, its recent acquisition of Immunomedics cost an enormous sum of $21 billion. And the main drug for this acquisition, Trodelvy as aforementioned, has been generating negligible sales (on the order of ~$305 million).
Source: Seeking Alpha data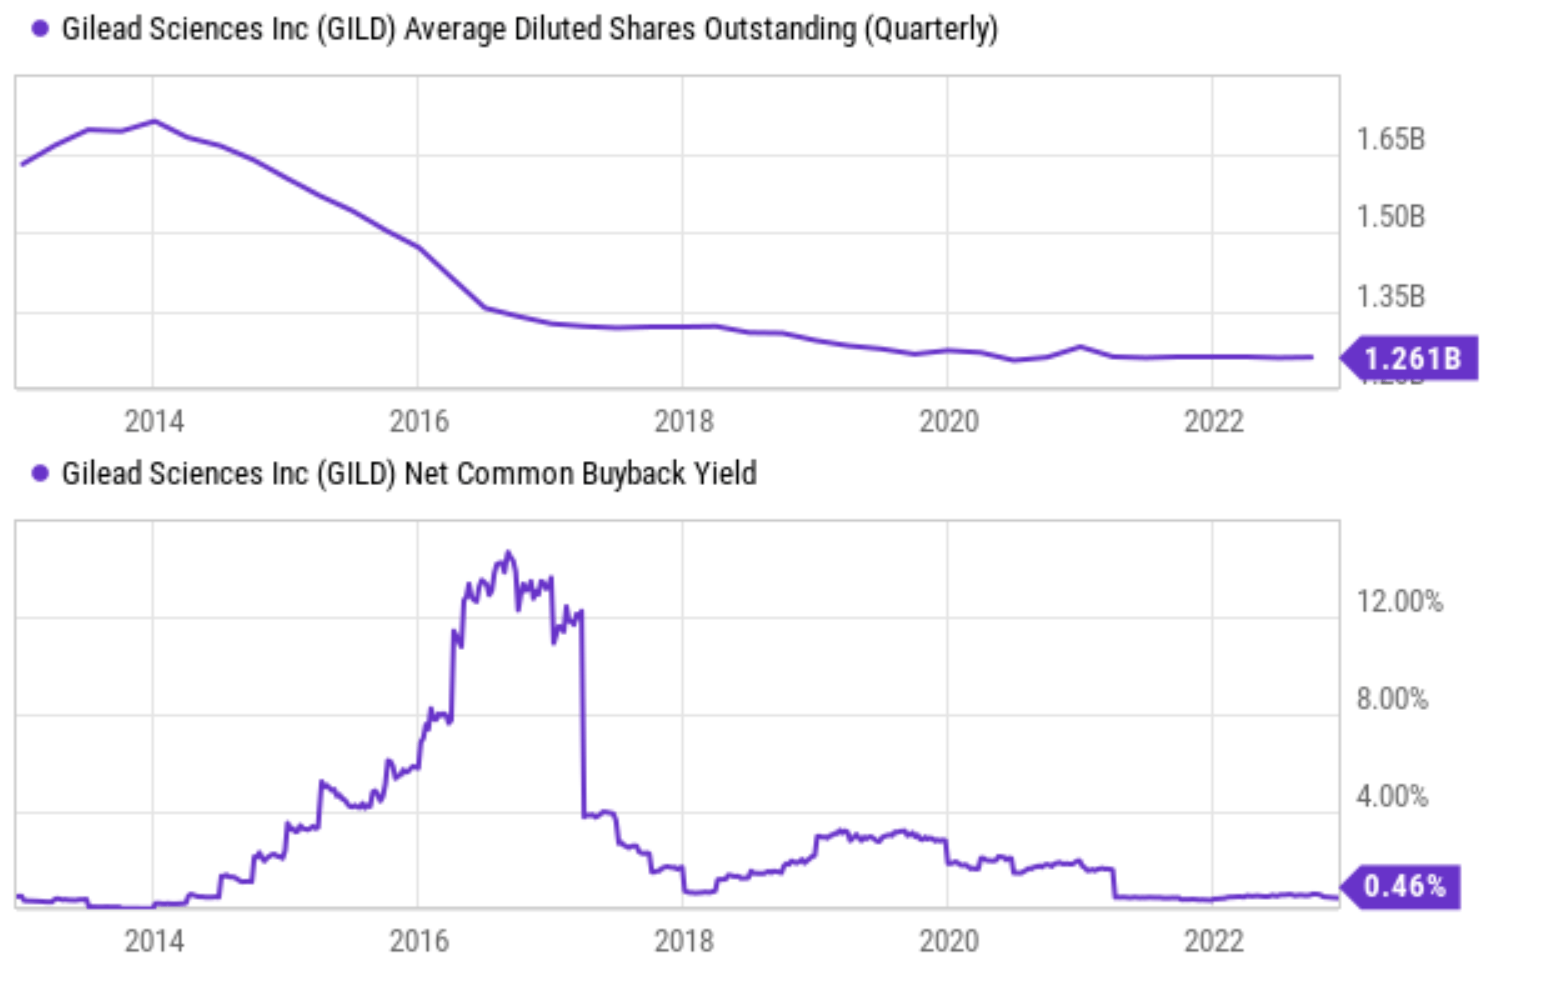
On the positive side, the business is maintaining a healthy level of profitability and reinvestment rates, and thus sustainable long-term growth can be expected. In terms of ROCE (return on capital employed) as shown in the chart below, GILD’s average ROCE has been on average 52% in recent years, very comparable to the overall biotech sector. After the profit it spends on paying dividends and on share repurchases, I estimate that GILD has been maintaining a reinvestment rate (“RR”) of ~10% at a sustainable level going forward. As such, a long-term growth rate of 5%+ can be expected (52% ROCE * 10% RR = 5.2% long-term growth rate).
Source: Author based on Seeking Alpha data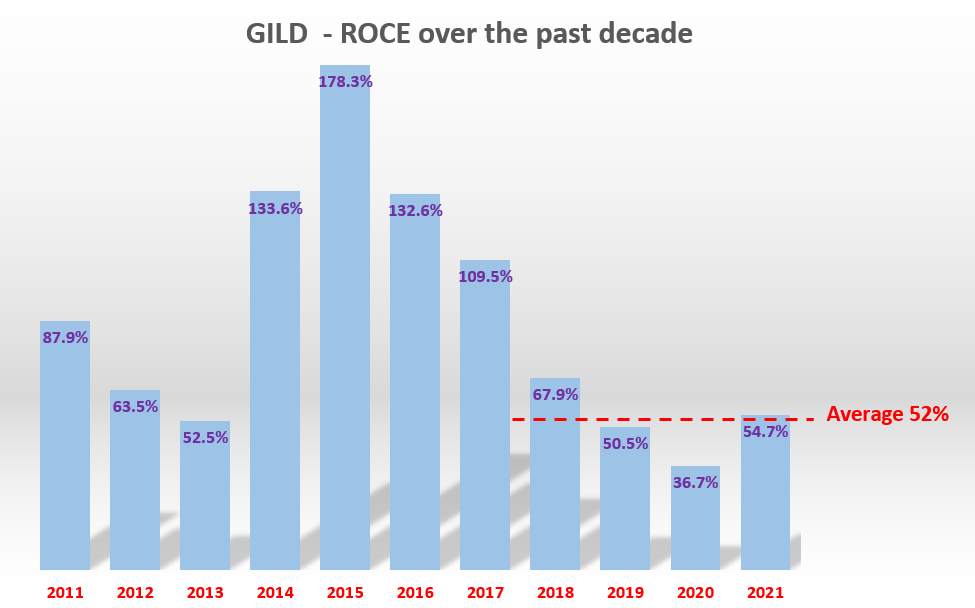
Risks and final thoughts
However, I expect the organic growth potential analyzed above to be largely canceled off by its current valuation premium as shown in the following table. As aforementioned, its present P/E ratio is about 23.6x, above its historical average of 16x by 47%. Using its dividend yield as a valuation metric, the valuation premium is a bit lower but still a substantial 15% above its historical average. As a result, assuming a 5.5% growth rate as mentioned above, for the next 3~5 years, the total return is projected to be in a range of -11% (the low-end projection) to about 31% (the high-end projection), translating into an annual return of -2.9%to 7.1%.
Besides an uninspiring return profile, note that there are uncertainties to its earnings consistencies (ranked at B) going forward. As aforementioned, Trodelvy currently is still in trial and there are similar breast cancer drugs on the market, and still others in clinical development. Sales of Veklury, its COVID-19 treatment, are also declining as the worst of the pandemic fades away.
Given such valuation risks and fundamental uncertainties, I see the return profile as much weaker than when I first wrote about it last July. And thus, I am downgrading it from “buy” to “hold”.
Source: Author based on Seeking Alpha data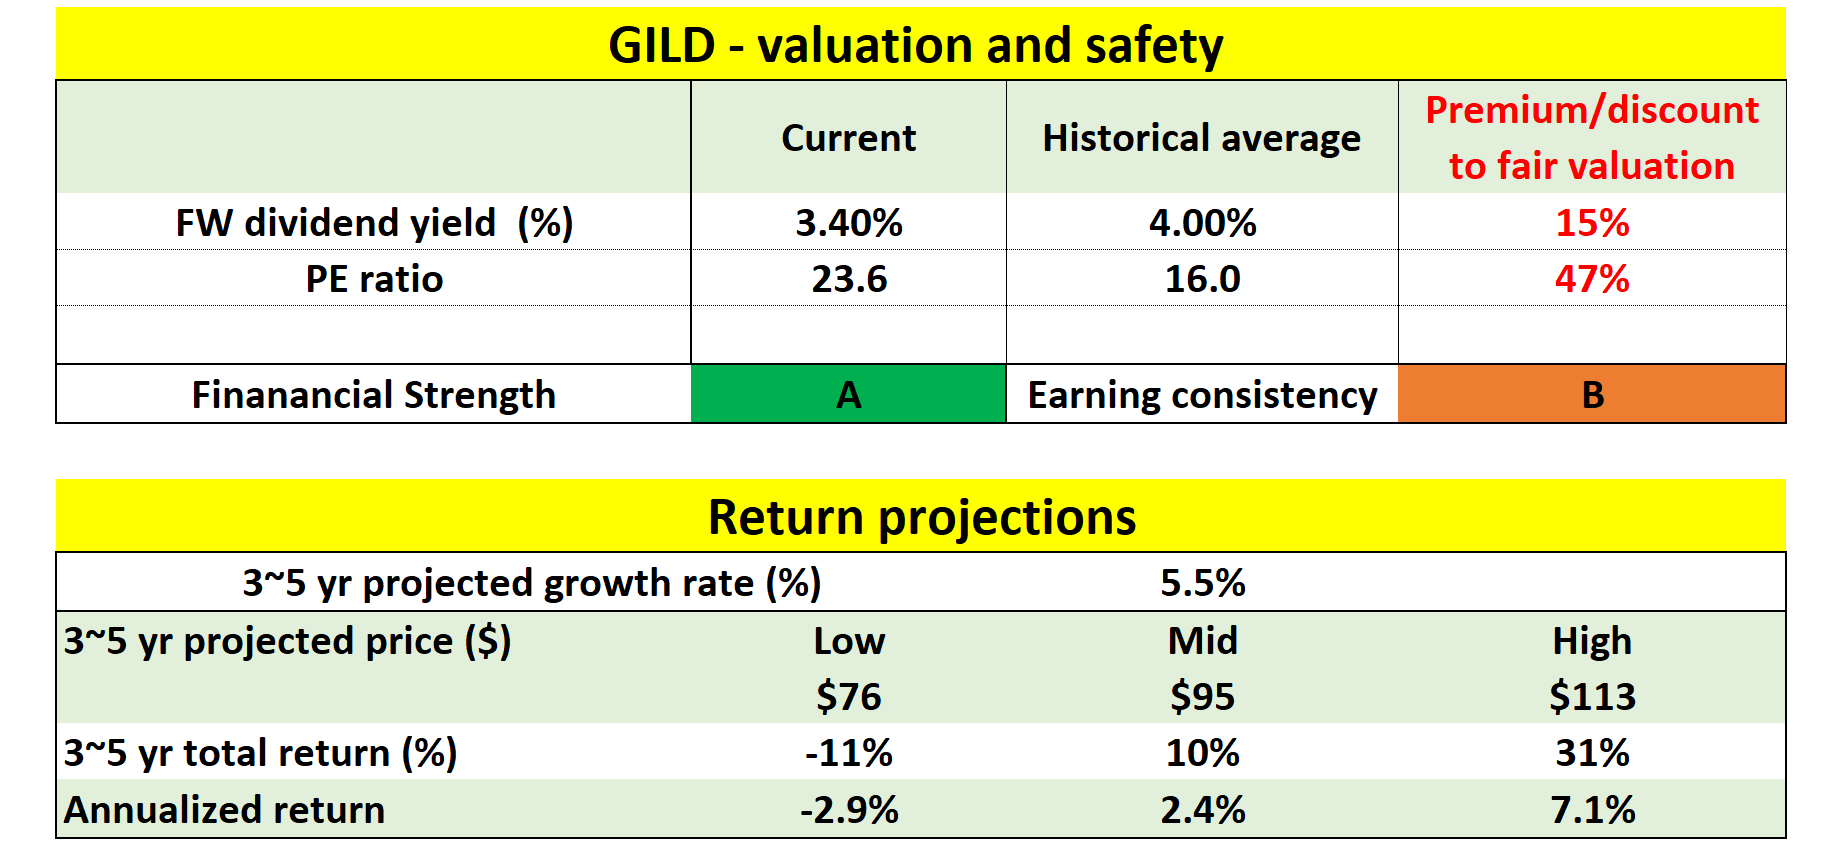
Be the first to comment