

Velishchuk
Over the last few months, things have been pretty sleepy in the Bitcoin (BTC-USD) part of the crypto universe. Instead, all the hype has been around Ethereum (ETH-USD) and GPU mining as the former moved from proof-of-work to proof-of-stake. But Bitcoin hasn’t significantly shifted any of its core systems during this time. It has almost been lulled to sleep by its trading pattern in recent weeks. But what appears to be a paint-drying moment for traders is looking to turn into a major move in the coming weeks.
Those who have followed my writing might recall my last technical analysis a year ago when I pointed toward higher highs as Bitcoin was trading at $54,000. Of course, my subscribers got the info while it was at $42,000 as the setup unfolded. Bitcoin touched $22 shy of $69,000 precisely one month later. This has been my tool for anticipating where Bitcoin is going in the near future and the medium term, and it has worked many times.
For whatever reason, Bitcoin likes to revisit similar trading patterns and structures. And while the current setup doesn’t encompass the same falling bullish flag nor a fully formed cup and handle as last year, it’s repeating another one of its popular patterns right now.
A Look At The Pattern
The problem with this pattern is while it’s traditionally a bearish pattern used to predict a continuation of a downward trend, it can also be a reversal pattern. Therein lies the problem of understanding this breakout’s direction: is Bitcoin going higher or lower? Unfortunately, a descending triangle is not easy to decipher, but we have some signals and indicators to help us.
Looking at the below chart, if the floor below $18,000-$17,500 breaks, we’re headed to much lower lows, likely around very low five figures – think $12,000-$13,000. However, if the descending triangle is broken out to the top side, we could see the beginning of a rally.
stockcharts.com
Confirmation is relatively simple for a continuation. A breakdown below the triple bottom will confirm more downside is ahead. Validation would come on a throwback where it tests the former triple bottom support as resistance. From there, expect much steeper declines. A breakout to the upside would be confirmed as it moves past and closes above the falling trendline. Validation would come once it breaks past the last high within the triangle. In this case, it appears to be the $22,500 level.
As for targets, the first high and first low of the triangle is subtracted and then added to the breakout or breakdown. This gives us the expected level the crypto will wind up at in the near term. This one is a little tricky because if I extend the upper resistance trendline, it can extend to the June highs.
stockcharts.com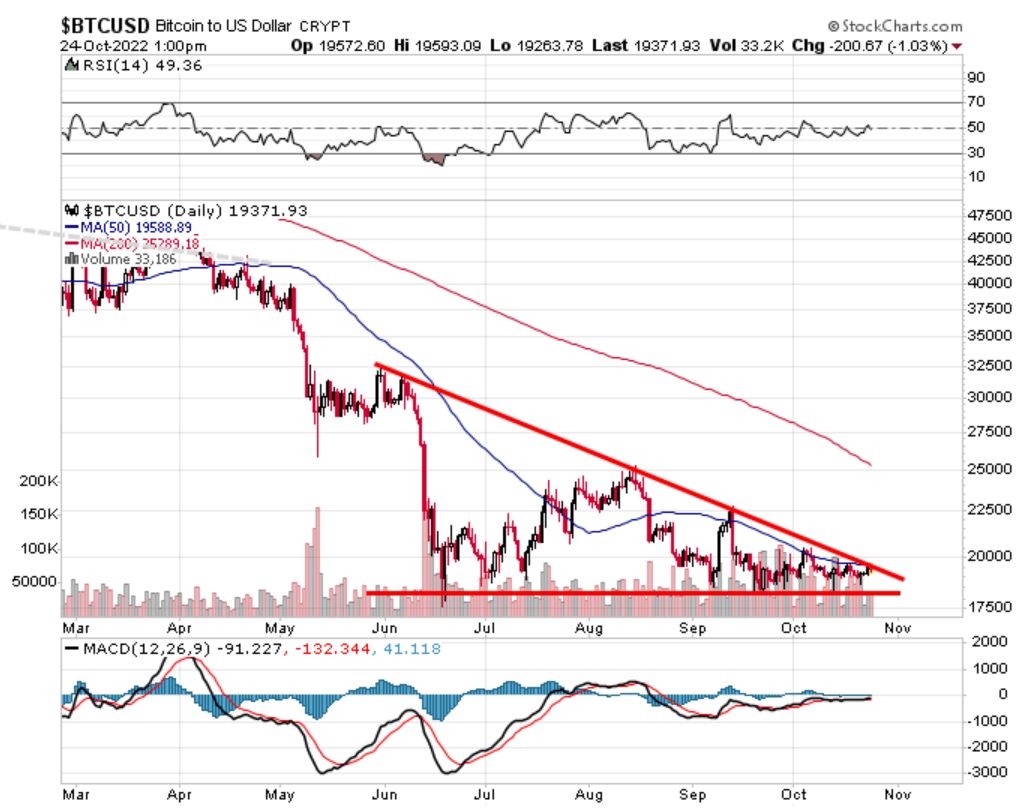
This means the difference in highs and lows is $14,767. It results in either a breakdown to $3,000 or a breakout to $34,267. However, a triangle is typically measured after the downward trend stops. This would put the first high in August. The difference in price between the highs and lows in this scenario is $7,600. This creates targets of $10,000 or $27,100. This is a more reasonable scenario as the targets are not wildly out of band.
Which Direction To Expect
So what are the odds this moves in one direction over the other? It’s difficult to say before we get a day with a lot of volatility or a large move. But, basing it purely on pattern odds, it’s a bearish outcome; it fits well within the parameters of a continuation pattern.
However, this level has a lot of support as it extends as far back as December 2020. This would require heavy, sustained selling to break below the support level. Not impossible or improbable, but as I told my subscribers, with the S&P 500 (SP500) looking to head higher, Bitcoin will likely follow (or even lead) suit.
stockcharts.com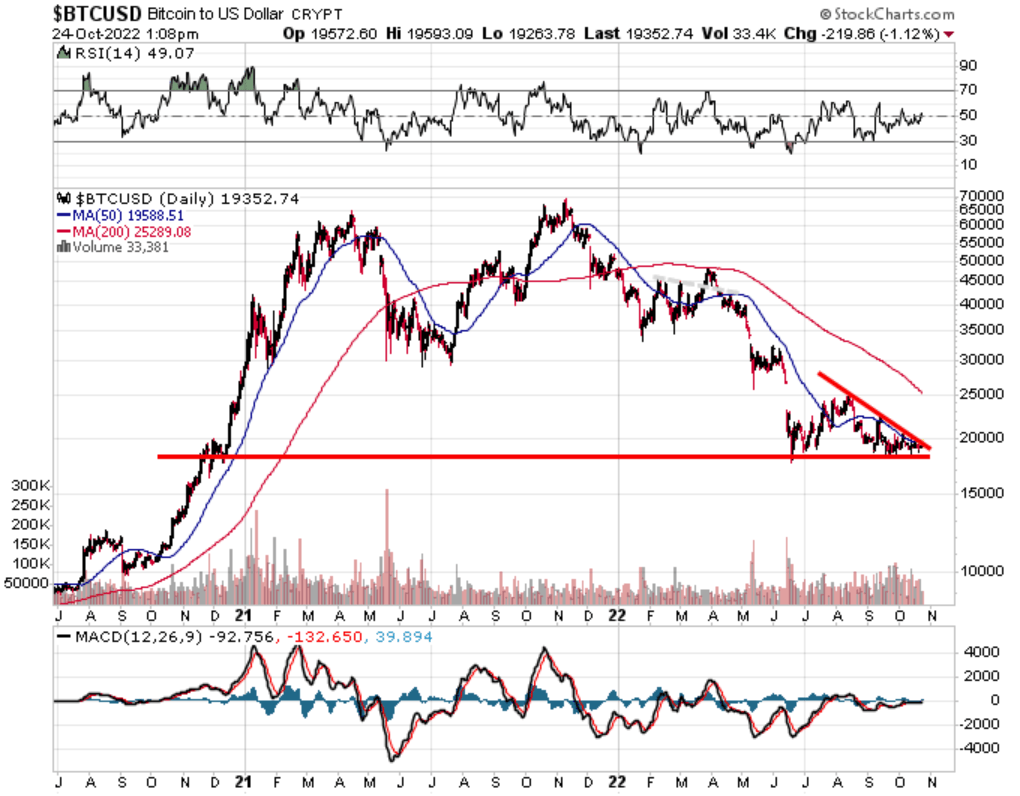
But to add to the bullish odds, the MACD has been trending much higher throughout this pattern. Since the lows in June, the MACD has made a disproportionate move higher into the August highs; the return to the bottom of the pattern didn’t come with a return to the MACD’s lows. Instead, a much higher low was put in.
stockcharts.com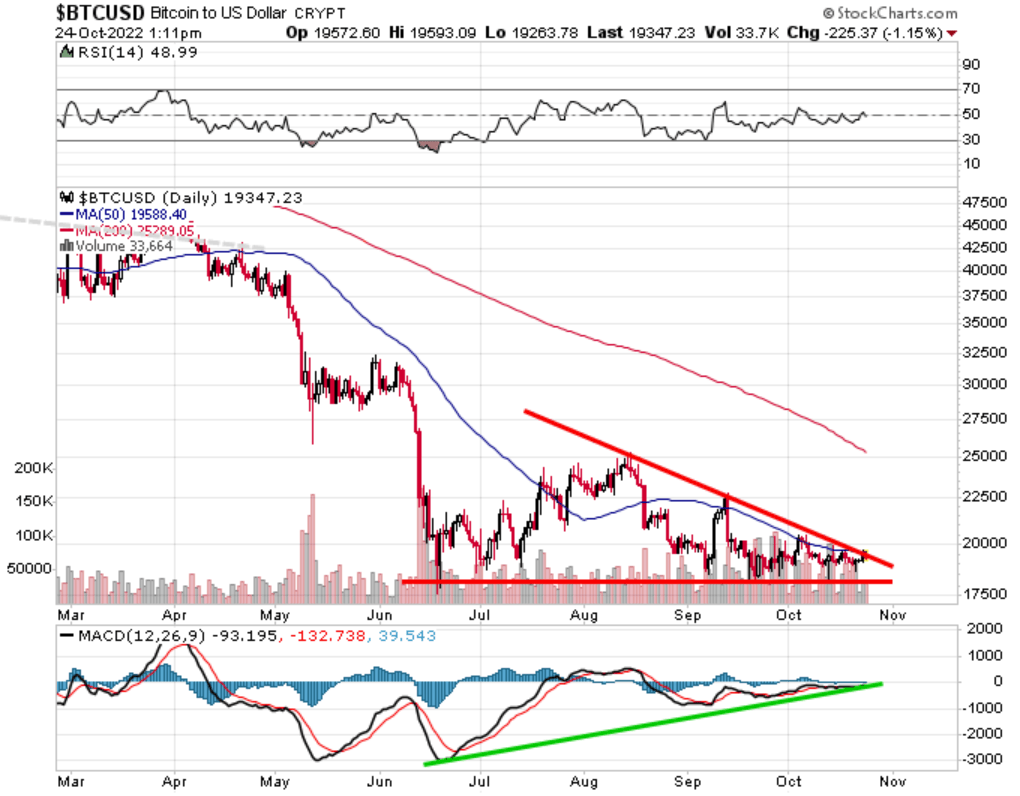
Using the indicators creates a more probable bullish outcome. However, the crypto will have to break past the 50-day moving average and the red trendline to break out to the upside. If it weren’t for the bearish tendency of this pattern and the dual resistance to the upside, I’d put the odds of a breakout at 60% and a breakdown at 40%. However, given all the inputs, I’d put the breakout at 40% and the breakdown at 60%. And if you think this doesn’t sound convincing to the upside, if there weren’t any bullish indicators, the odds would be closer to 20% for a breakout.
Prepare For A Move
I’m expecting the crypto to make a move in the next couple of weeks. Technically speaking, by the second week of November, the triangle will reach the apex and expire. A move should come before then. If no move happens, the pattern will be invalid, and the analysis will need another look to see where the crypto is headed. I don’t expect this, but if it does, I will move toward a serious bottom forming if it continues sideways and doesn’t break below the ~$18,000 support level.
I’d also use the input of the broader markets and indexes to give us an idea of where Bitcoin will head since there is a correlation between Bitcoin and the equity market (but with a larger beta). But no matter the direction of this pattern, a large move is expected soon.
Be the first to comment