


olaser/E+ via Getty Images
Investment Summary
Following our coverage into the nonalcoholic steatohepatitis (“NASH”) diagnostic and treatment domain with Akero Therapeutics (AKRO) [read it here] today I am presenting our market findings on Genfit (NASDAQ:GNFT). Our readers understand we make a practical assessment of all the contributing factors when examining late-stage biotech names and with this analysis I’ll run through the market generated data to guide positioning on the stock. Net-net, recently investors have rewarded GNFT after multiple inflection points – specifically, its last earnings call and its pipeline day on October 19th, in Paris last year.
GNFT is a relatively low-beta play offering investors tactical upside with a potential pilot position, obtaining niche exposure to the chronic liver disease treatment domain. Shares have rallied off lows in late FY22′ [Exhibit 1] and its low covariance to the benchmark illustrates investors are rewarding idiosyncratic features of the company. Net-net, rate buy.
Exhibit 1. GNFT price rally off FY22′ lows [daily price scale]
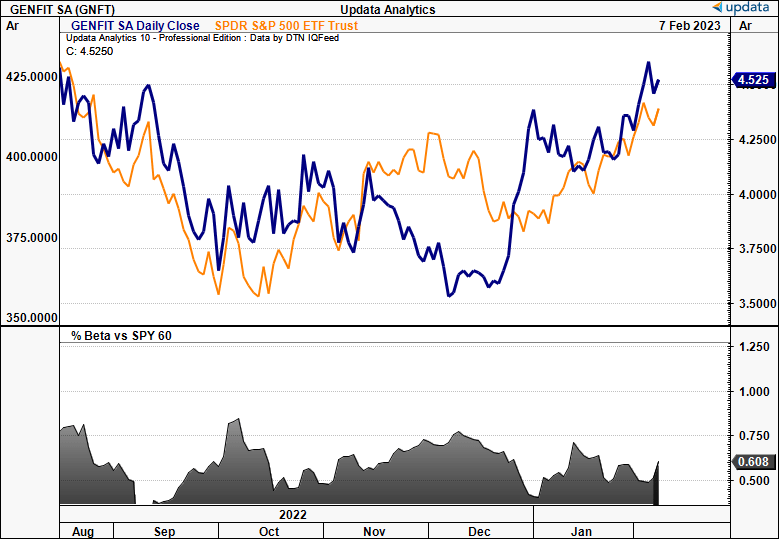
Data: Updata
Key factors underpinning the rally
Turning to the objective data, our technical buy thesis is supported by numerous factors:
1). The stock is rated highly on Seeking Alpha’s quant factor grades. These are tremendously wise data points to use by filtering out subjective assessment of the company’s fundamentals, based on what the market rewards. In particular, the stock is priced favourably on valuation, growth and momentum, illustrating the rate of change exhibited by buyers over the past few months.
Exhibit 2. GNFT Quant factor grading illustrating high rating
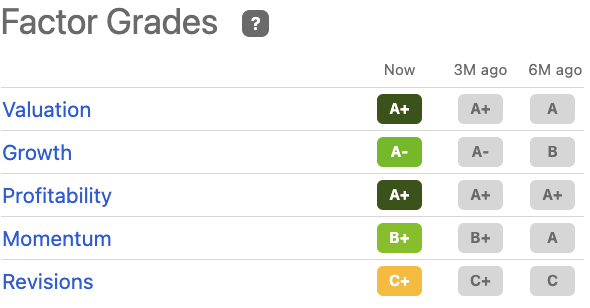
Data: Seeking Alpha. GNFT
2). The quant system supports GNFT as a buy and this trend has been in situ since midway last year. Utilizing the objective data, we’ve noted this has carried through into the price action, adding confluence to the quant system’s rating. These ratings aren’t to be discounted either.
Exhibit 3. Quant rating advocating buy, supporting thesis
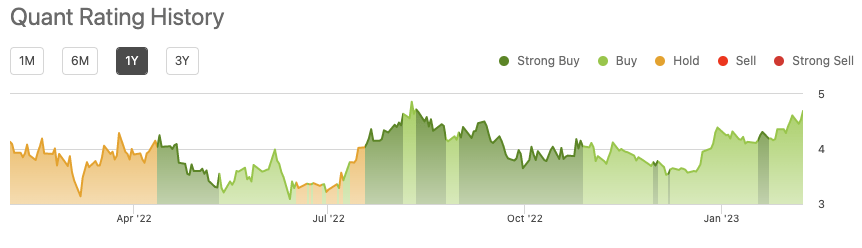
Data: Seeking Alpha. GNFT
3). Speaking of the trend, shares are still bullish above the cloud after crossing in December. Both the price line and lagging line are positioned above the cloud, with support forming to the $4.30 region by the end of February. The cloud itself crossed to the upside in February, adding further momentum to the upside thesis. The daily chart looks to the coming weeks, hence, we look for the bullish trend to remain in situ over this timeframe.
Exhibit 4. Bullish above the cloud on daily frame, looking out to coming weeks
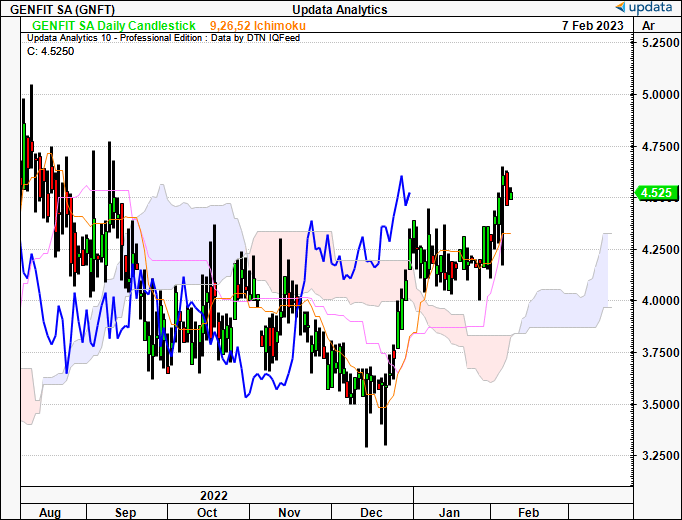
Data: Updata
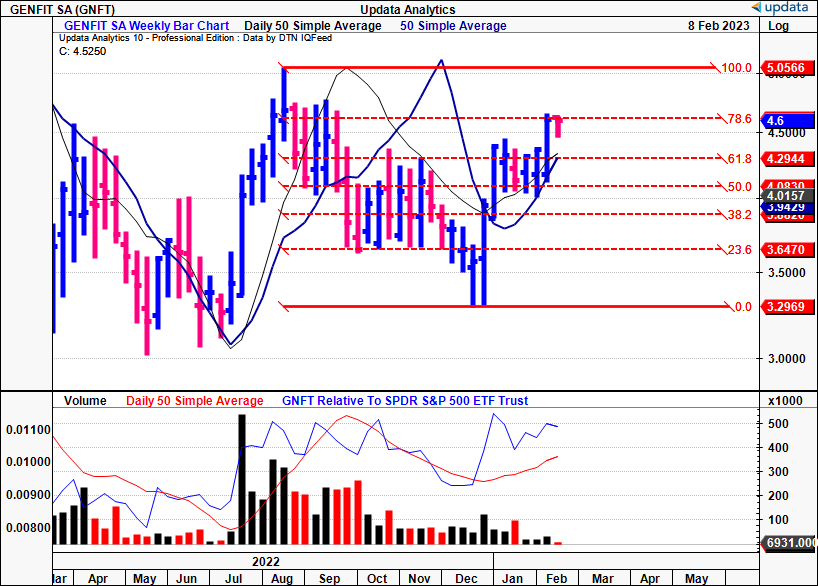
4). Looking at the weekly bars, the tracing the fibs’ down from the August high to the December lows, GNFT is now testing a 78% recovery of the retracement. Should it lift from here, next target is $5.05, then $6.50. If it breaks lower, we are looking to $4.30, then ~$3.80.
Exhibit 5. Next upside targets to $5 then $6.50 if GNFT stays on trend
Data: Updata
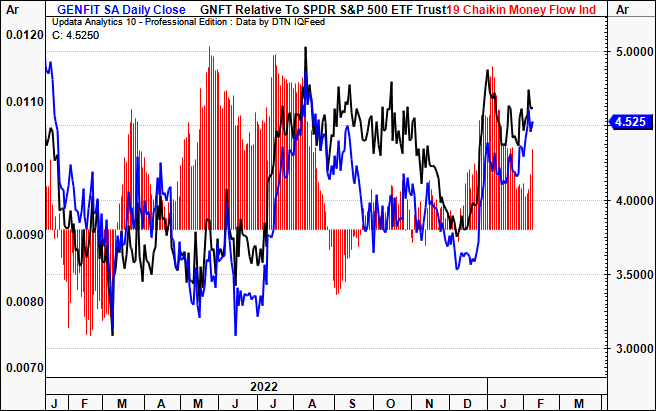
5). Daily money flows into GNFT equity have also rolled up from November and correlate with the subsequent price action. Investors are buyers at all ranges off the December thrust, and GNFT’s relative strength versus the benchmark has diverged higher from the price line. The rate of change in inflows is indicative of appetite for longs in the stock, by estimation.
Exhibit 6. Daily money flows shifting to inflows from November, holding trend since
Data: Updata
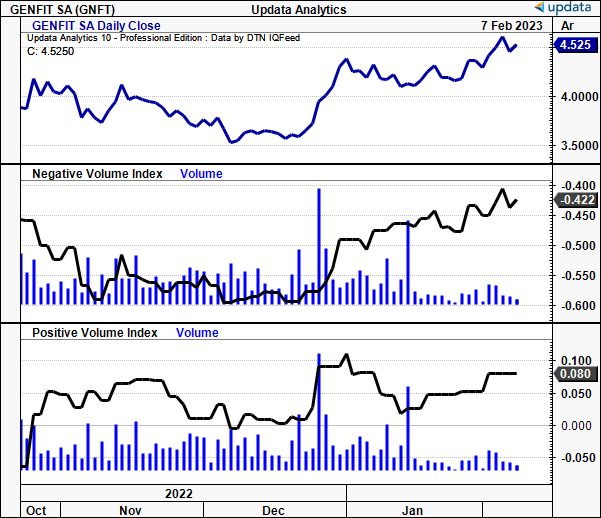
On this, we noted the presence of institutional/sophisticated buyers via the negative volume index (“NVI”) ticking higher in tandem with the price upswing. As a reminder, institutional/funds are mandated to allocate to longs over an extended period, with sizing proportionate to the daily volume [in dollar terms]. Hence, the NVI shifts higher on low volume days, when these buyers make entry. The correlation in NVI to price action indicates accumulation from these accounts, by estimation.
Exhibit 7. Accumulation from funds/institutions as NVI ticks higher in tandem with price action
Data: Updata
Market generated data defining GNFT price structure
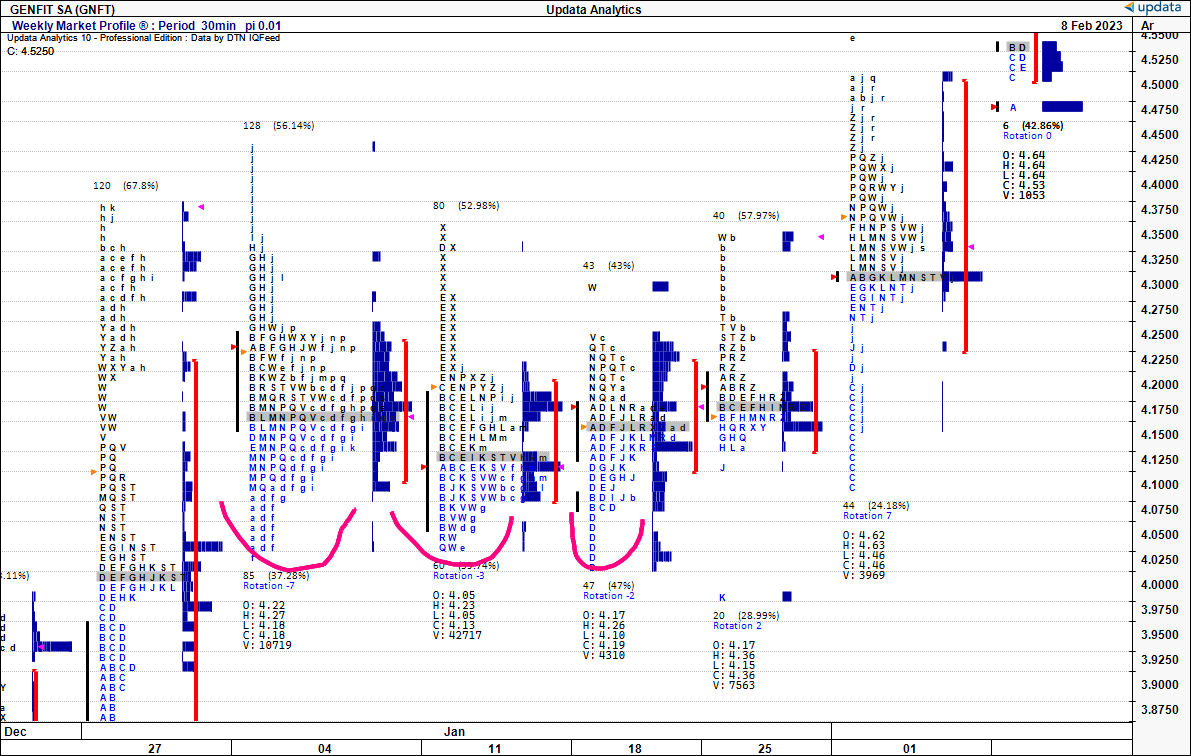
Switching to the weekly market profile since December, we can make several inferences from GNFT’s price structure. First, is that buyers have been tremendously active at all zones below the point of control (“POC”), the time at where the price spent the most time each week [grey bars]. The blue zones indicate where strategic buyers [funds, institutions] have made likely made entry. The distribution of volume supports this as it has been spread across the entire value zone each week. The depth of the buyer zones below the POC illustrate buyers have been active with each pullback in price, adding validity to the stock’s bullish outlook.
Exhibit 8. Weekly market profile, depth of buyers below POC indicate buyers at weak points within trend
Data: Updata
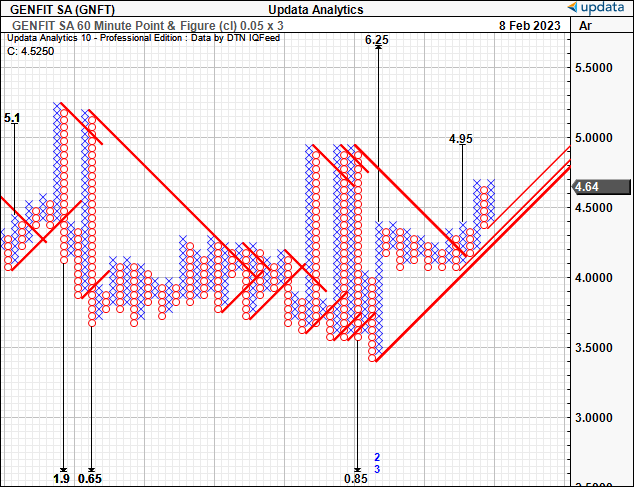
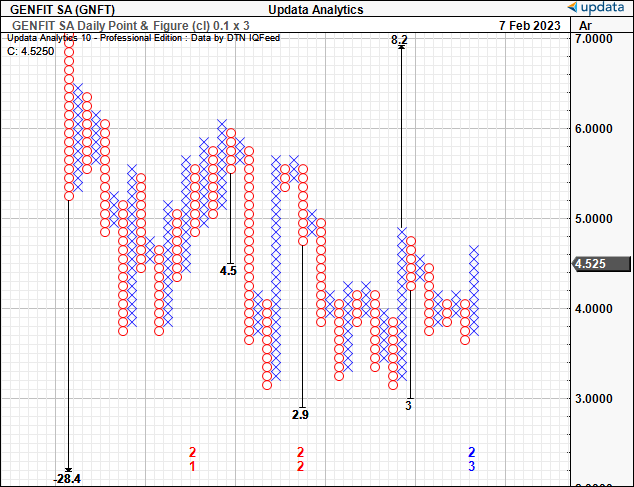
We consequently have upsides to $6.25 and then $8.20 on the 60-minute and daily timeframes, respectively. We are looking to these targets should the stock reach the $4.95 target posted in Exhibit 9. Given the price structure shown on the market profile above, we opine there’s sufficient demand to drive it to this level.
Exhibit 9. Upsides to $4.95, then $6.25 on 60-minute point and figure chart
Data: Updata
Exhibit 10. Upside to $8.20 on daily chart
Data: Updata
Risks and conclusion
There are multiple risks that could go against this bullish thesis. The stock has a market cap of $225mm and is therefore incredibly susceptible to volatility and large orders on the long and the short side. Key downside risks also arise from the company’s pipeline and should any negative data arise from this it could send prices driving lower. Moreover, there are inherent risks with investing in late-stage biotech companies anyway, as capital can divert to more selective opportunities without much warning. There is also a chance our analysis has missed additional market factors that present downside risks to the price action. Investors should recognize these risks in full.
Net-net, we’ve obtained multiple data points that suggest GNFT could be a buy. We are opening a pilot position and will look to size in with further confirmation of the trend data. Rate buy.
Be the first to comment