

trendobjects
Introduction
The onset of the Russia-Ukraine war early in 2022 sent energy prices surging, but as my previous article warned, Genesis Energy (NYSE:NYSE:GEL) was failing to capitalize on these booming operating conditions, which did not bode well for their distributions that currently provide a high 6.33% yield. To the slight relief of unitholders, the second quarter saw emerging green shoots, although disappointingly with the economic outlook beginning to falter, I see dark clouds forming on the horizon, as discussed within this follow-up analysis.
Executive Summary & Ratings
Since many readers are likely short on time, the table below provides a very brief executive summary and ratings for the primary criteria that were assessed. This Google Document provides a list of all my equivalent ratings, as well as more information regarding my rating system. The following section provides a detailed analysis for those readers who are wishing to dig deeper into their situation.
Author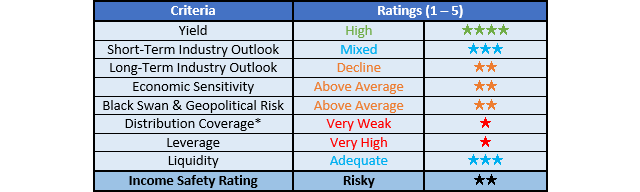
*Instead of simply assessing distribution coverage through distributable cash flow, I prefer to utilize free cash flow since it provides the toughest criteria and also best captures the true impact upon their financial position.
Detailed Analysis
Author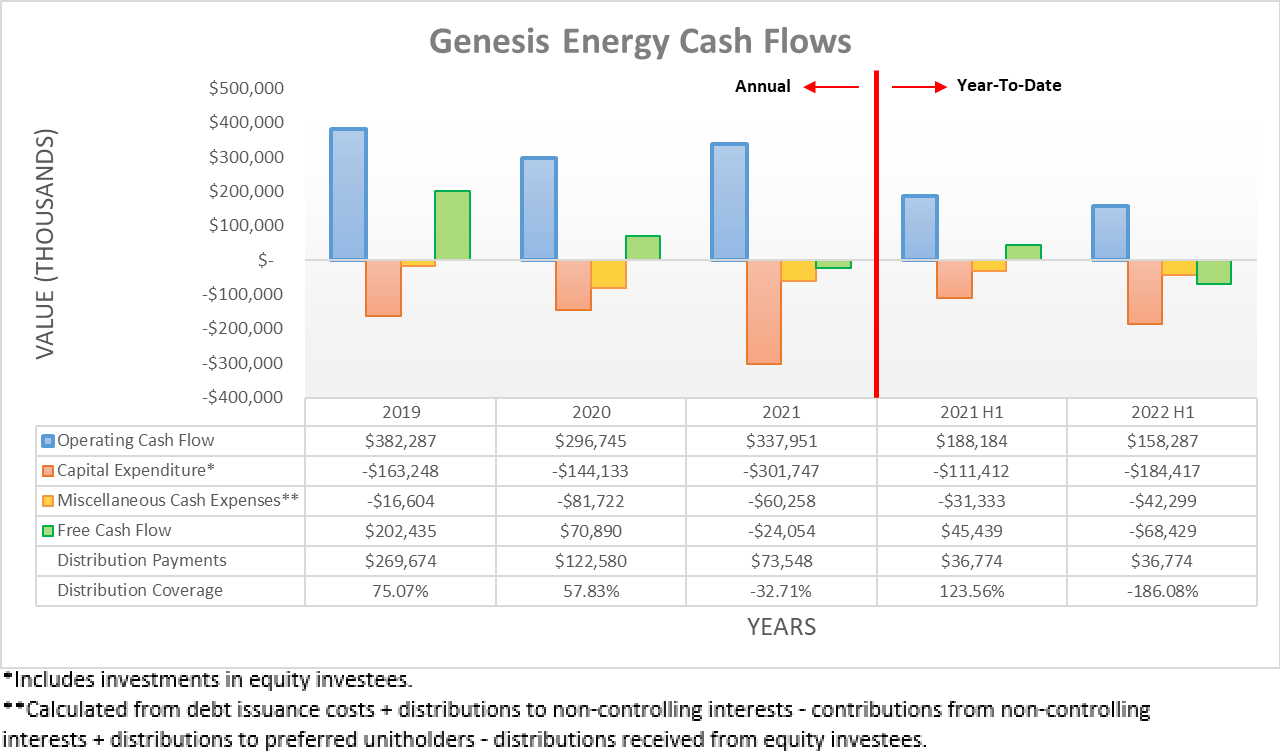
On the surface, their cash flow performance following the second quarter of 2022 does not appear much better than its disappointing performance during the first quarter with their operating cash flow of $158.3m for the first half still down 15.89% year-on-year versus their previous result of $188.2m during the first half of 2021. After including their capital expenditure and routine large miscellaneous cash expenses detailed beneath the graph included above, their free cash flow was down even more following the second quarter of 2022 with a result of negative $68.4m during the first half, versus negative $51.2m during the first quarter. This once again produced a cash burn even before funding their distribution payments, which has consistently been the case for years, as their peak full-year distribution coverage going back to 2019 was only a weak 75.07%.
Whilst less than stellar on the surface, if removing their temporary working capital movements their underlying operating cash flow climbs to $184.5m during the first half of 2022 and thus an impressive 17.59% higher year-on-year versus their previous equivalent result of only $156.9m during the first half of 2021. These emerging green shoots mark a sizeable improvement versus the first quarter of 2022 when their underlying operating cash flow was essentially flat year-on-year at $83.4m versus $82.2m respectively across these same two points of time. It appears this is driven by their volumes finally normalizing after a slow recovery from the severe downturn of 2020, as per the commentary from management included below.
“These results were largely driven by a return to normal operations and increasing volumes in our offshore segment relative to the first quarter as well as sequential quarterly growth in each of our other segments, which is reflective of the constructive backdrop for each of our specific businesses.”
-Genesis Energy Q2 2022 Conference Call.
Even though this unexpected improvement is a positive surprise, realistically, it would be prudent not to read too much into merely one quarter, especially given their disappointing performance as recently as the first quarter of 2022. Further enhancing this point, the global economy appears to be hurtling towards a recession or if not, at least a material slowdown, as central banks rapidly tighten monetary policy to combat high inflation. This could potentially weaken operating conditions, thereby stomping out these green shoots, metaphorically speaking and thus in my view, it remains a firm wait and see to assess if the sizeable improvement to their underlying cash flow performance continues or falters. This is important given their consistent sub-100% distribution coverage and subsequently discussed problematic very high leverage, which together leaves their distributions risky.
Author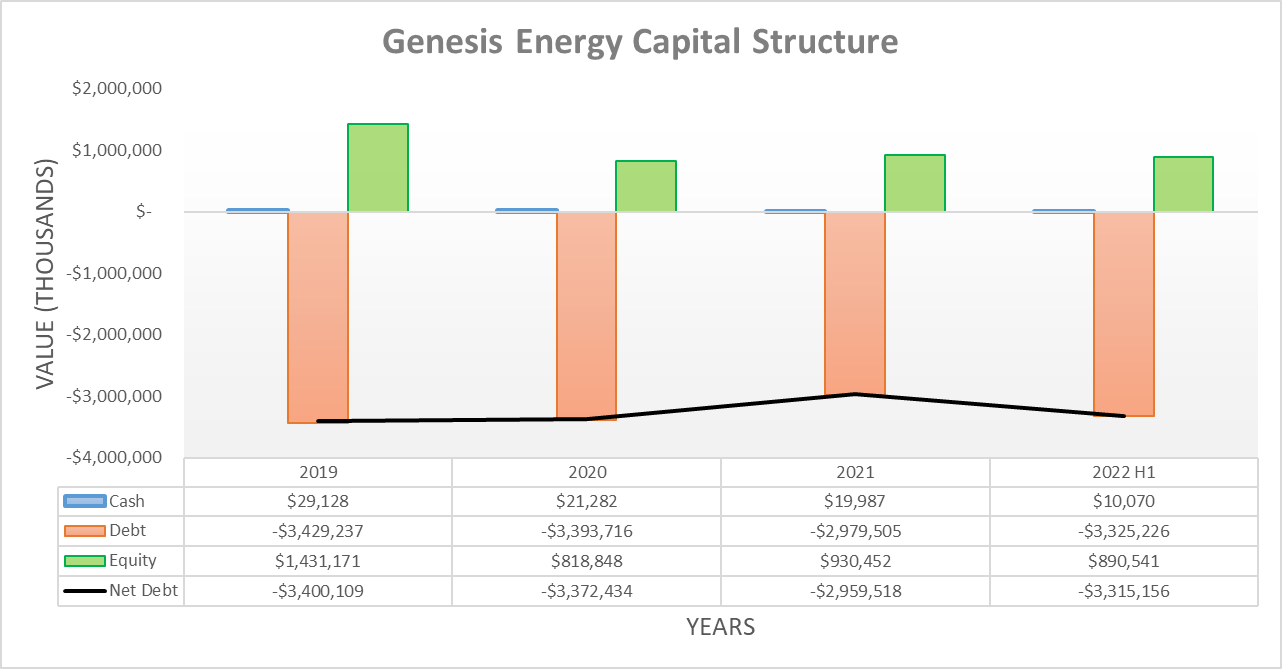
Unsurprisingly, their cash burn saw their net debt climb higher during the second quarter of 2022 with its level of $3.315b representing an increase of 9.87% versus its level of $3.017b when conducting the previous analysis following the first quarter. Whilst an increase was expected, its particularly large size stems from the redemption of their Alkali asset-level preferred units, which cost $288.6m and thus were refinanced as debt, thereby contributing to the majority of the increase observed. Whilst helpful in cleaning up their capital structure, their balance sheet still carries a further $790.1m of Class A convertible preferred units, which continue weighing down their cash flow performance given their $37.4m of distribution payments during the first half of 2022. If these were also refinanced through this same means, it would see their net debt exceed $4b for the first time, thereby highlighting the full magnitude of the work to completely clean up their capital structure.
Author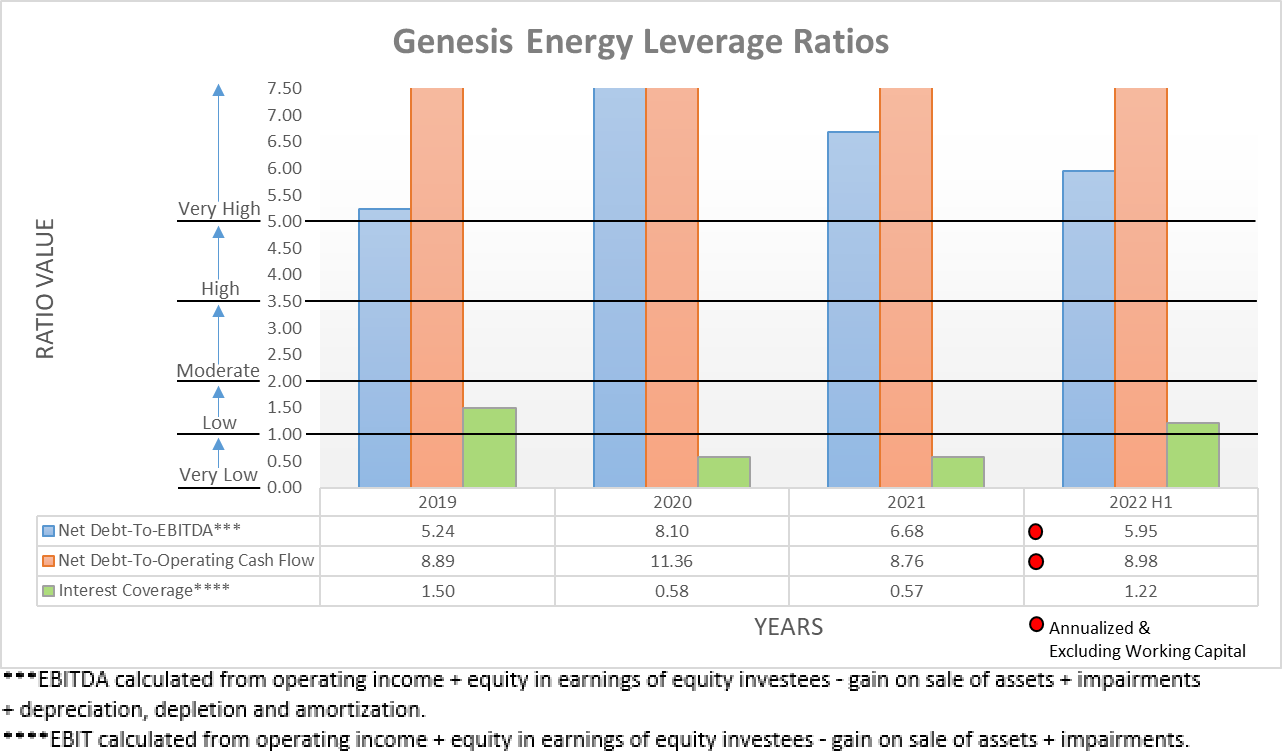
Following the net debt increasing materially during the second quarter of 2022, their stronger financial performance was broadly counteracted and thus sees their leverage effectively unchanged. As a result, their respective net debt-to-EBITDA and net debt-to-operating cash flow of 5.95 and 8.98 are similar to their respective results of 5.65 and 9.04 when conducting the previous analysis following the first quarter. Since these obviously remain well above the threshold for the very high territory of 5.01, once again their problematic very high leverage remains unchanged.
When looking elsewhere, their leverage ratio as utilized by their management and lenders to assess their credit facility covenant dropped to 4.49, as per page one of their second quarter of 2022 results announcement. Unlike their broader leverage ratios, this marks a large decrease versus their result of 5.10 when conducting the previous analysis following the first quarter, which they seemingly feel is the only leverage metric that matters, as per the commentary from management included below.
“Importantly, we fully expect to exit 2022 with a leverage ratio as calculated by our senior secured lenders at or below 4.5x, which by the way, is the only relevant leverage covenant anywhere in our capital structure and the only calculation that I think is worth analyzing and talking about.”
-Genesis Energy Q2 2022 Conference Call (previously linked).
Whilst I respect their stance, it remains my view that broader leverage still matters, especially when entering an era of rapidly tightening monetary policy that is seeing liquidity removed from the system at the fastest rate in many years. I especially feel comparing net debt to their operating cash flow is particularly useful because unlike their accrual-based metrics, across time it provides a less massaged view of their leverage, especially given the following two reasons skewing the leverage ratio utilized by management.
The first reason relates to their adjusted EBITDA, which is utilized in their leverage ratio and contains a $32m benefit from their Independence Hub Platform divestiture, as per page eleven of their previously linked second quarter of 2022 results announcement. This is allowable by their lenders but practically speaking, it both skews comparisons to their peers, whilst also relying upon a one-off event that cannot be repeated, at least not without shrinking their partnership.
Meanwhile, the second reason stems from their leverage ratio not considering the entirety of their debt but rather their “adjusted debt” that is only $2.899b and thus well below their net debt of $3.315b sitting on their balance sheet, as per page twelve of their previously linked second quarter of 2022 results announcement. Needless to explain in detail, obviously excluding a material portion of their debt does not make for suitable comparisons versus their peers nor does it capture the long-term implications for unitholders, as regardless of whether included within a particular leverage ratio or not, all of their debt still exists and thereby influences their future.
Author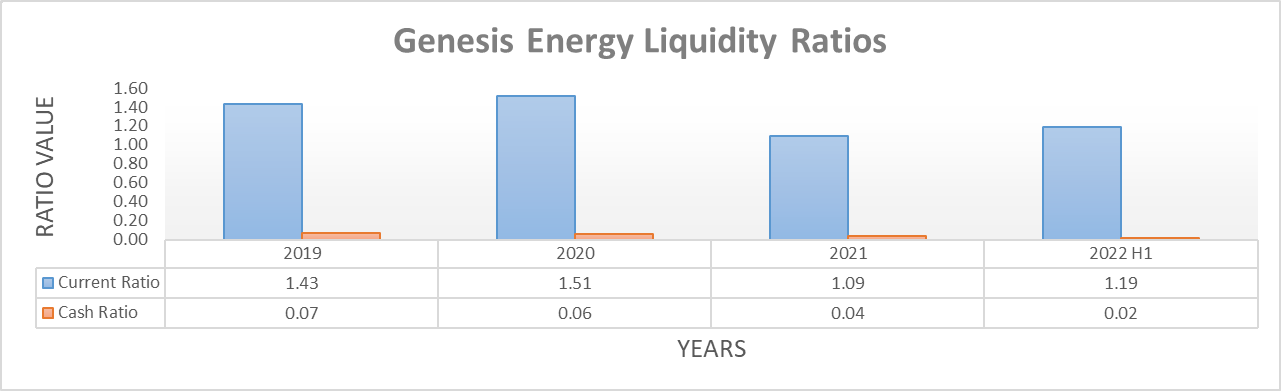
When moving onwards to their liquidity, it sees their respective current and cash ratios at 1.19 and 0.02 following the second quarter of 2022, which are adequate and similar to their respective results of 1.12 and 0.02 when conducting the previous analysis. Whilst they retain a further $610.9m available under their credit facility if required, this may decrease in the future if their leverage ratio increases and thus restricts their ability to incur more debt, which is quite possible given its large decrease was heavily driven by a one-off divestiture. Regardless of their leverage, at least they have breathing room since they do not face any debt maturities until June 2024, as the graph included below displays.
Genesis Energy September 2022 Wells Fargo Conference Presentation.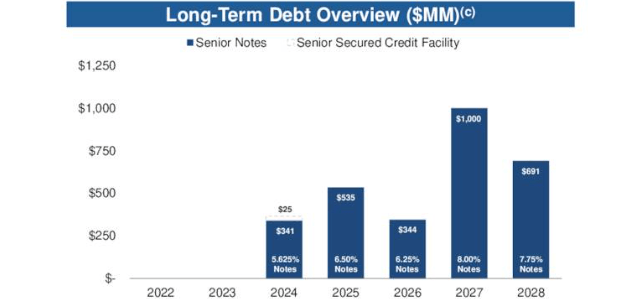
Conclusion
Notwithstanding my skepticism about their leverage ratio and economic concerns, I give credit where credit is due and to this point, their second quarter of 2022 saw a sizeable improvement within their underlying cash flow performance. Since their unit price is down around 20% following the sell rating issued within my previous analysis, I believe that upgrading slightly to a hold rating is now appropriate.
Notes: Unless specified otherwise, all figures in this article were taken from Genesis Energy’s SEC Filings, all calculated figures were performed by the author.
Be the first to comment