

Wolterk
Intro
We wrote about General Mills, Inc. (NYSE:GIS) back on September 22nd of this year post the company’s first-quarter convincing earnings beat. Shares rallied to new highs on the news and we recommended investors remain long the stock despite the company’s valuation being up at the higher end of its range. Since we penned that piece, shares have tacked on a further $6+ per share or 8%+ and now come in just below the $87 level.
Growth was the major theme of the first quarter (both in organic net sales and operating profit) which led to an increase in adjusted gross margin and operating profit margin. This momentum led management to increase its full-year guidance for top-line revenues and earnings per share. Suffice it to say, by doubling down on what has been working (sustained innovation, brand building at scale, etc), and divesting assets that do not line up with its “Accelerate” initiative, management believes there is plenty more upside in the share price. Internal trends regarding book value & free-cash-flow growth also point to more gains on the cards here for this stock.
If we pull up the technical chart of General Mills, we see that shares continue to make higher highs despite the fact that General Mills’ valuation is at the higher end of its range (forward GAAP earnings multiple of 20.69). The strongest trending moves however always take place from market highs and not market lows so do not be surprised if GIS continues to make higher highs. In fact, there are no significant divergences in the technical chart at present as we can see from the MACD histogram as well as the RSI momentum indicator. On the contrary, the bull run in GIS has accelerated in calendar 2022.
General Mills Technical Chart (Stockcharts.com)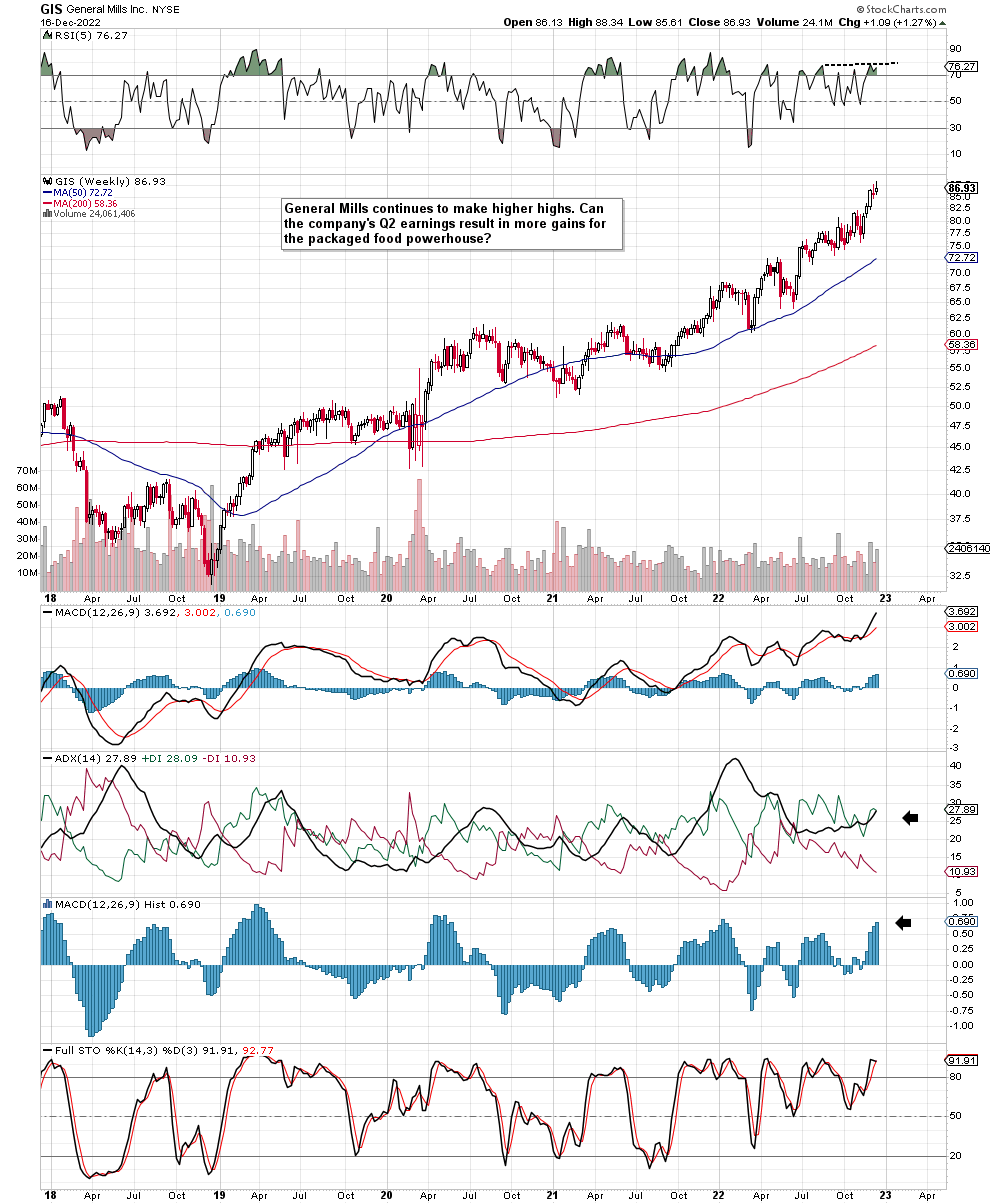
General Mills Q2 Earnings Preview
General Mills is expected to announce its fiscal second quarter numbers on the 20th of this month where $1.06 per share is the GAAP bottom-line estimate for the quarter on sales of $5.19 billion. Although binary events such as earnings announcements many times provide the motive for a sustained trend-change, we would be very wary of holding short deltas in GIS going into the announcement of the company’s second-quarter numbers. Over the past 12 quarters, GIS has reported 10 earnings beats and only two quarters that did not meet consensus expectations. Furthermore, one of those quarters was in Q2 last year when management reported earnings of $0.99 per share which ended up missing the mark by $0.06 per share. Therefore, from a market sentiment standpoint, the positive trend here straight away is the growth curve (7.5% expected growth) as we have a $0.07 buffer to the upside between the reported bottom-line number in Q2 last year ($0.99 per share) and the expected readout this year ($1.06 expected in Q2 this fiscal year).
Furthermore, as we can see from the quarterly consensus earnings revisions below, analysts who follow this stock have continued to mark estimates up in recent months. In fact, there have been 13 upward revisions over the past three months as opposed to only 3 downward revisions. Therefore, bullish trends regarding margins and earnings which we witnessed in General Mills’ first quarter appear to be continuing to be gaining traction. The recession-resistant nature of this industry once more seems to be playing itself out here where GIS remains laser-focused on giving consumers what they want whether that is value in-store or convenience on the “in-at-home” front.
GIS Consensus EPS Revisions (Seeking Alpha)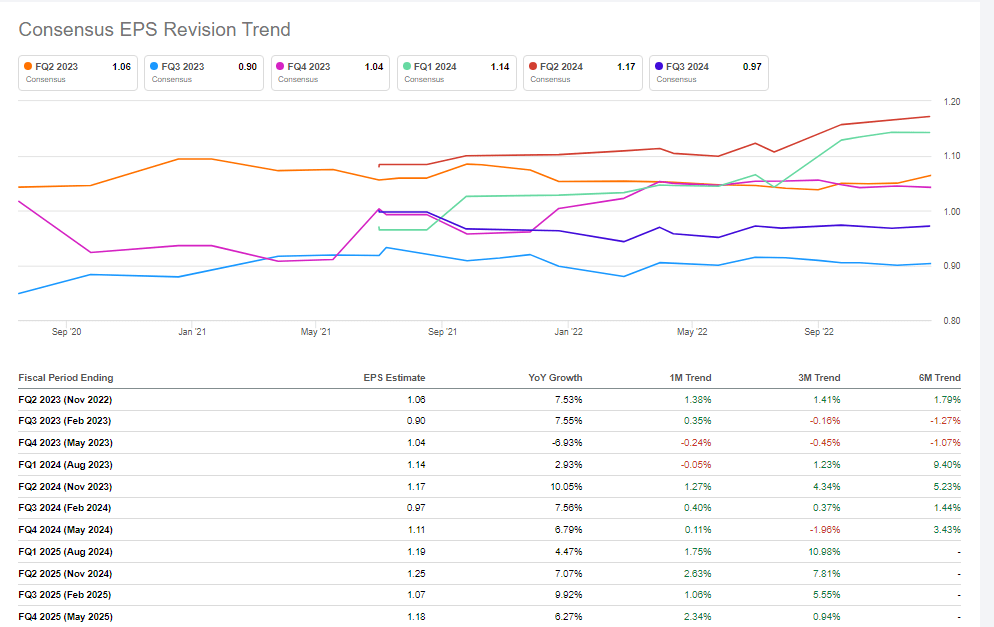
Strategy
From a strategy standpoint, we can see from General Mills’ implied volatility chart that the market is expecting a smaller post-earnings share price compared to previous quarters. What this essentially means is that investors may not experience the same level of gains from future quarterly earnings beats compared to yesteryear. This stands to reason from a valuation standpoint as the company’s earnings as mentioned above continue to be priced well above average multiples (5-year GAAP earnings multiple of 16.58 compared to an expected 20.69 multiple this year).
Therefore, a sound strategy going forward (especially if shares continue to spike going into calendar year-end) to decrease risk would be to use the depressed implied volatility (which also is evident in further out expiration cycles) to convert existing stock positions to long-dated call options or LEAP contracts. The January-2024 $62.50 call option for example presently is trading for approximately $27 per call and has a 0.90 delta. This strategy enables the investor to participate in more upside from GIS, reduce downside risk due to far less capital in play, plus also can use that extra capital to invest in other names with lower valuations and higher dividend yields.
General Mills Implied Volatility (Interactive Brokers)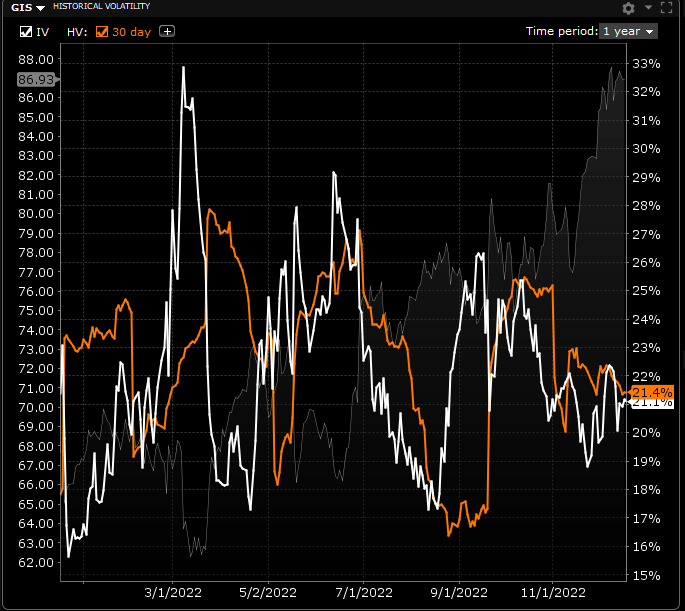
Conclusion
Therefore, to sum up, General Mills announces its second-quarter numbers on the 20th of this month where $1.06 is the bottom-line GAAP number expected. The odds are well above 50/50 that we will witness another beat in the quarter but present IV levels demonstrate that the resulting move in the share price may not be as good as expected. The LEAP strategy outlined above enables investors to take money off the table in GIS if indeed the stock’s valuation continues to get extended. We look forward to continued coverage.
Be the first to comment