

da-kuk
This dividend ETF (exchange-traded fund) article series aims at evaluating products regarding the relative past performance of their strategies and quality metrics of their current portfolios. Holdings and their weights change over time: reviews are updated when necessary.
GCOW strategy and portfolio
The Pacer Global Cash Cows Dividend ETF (BATS:GCOW) has been tracking the Pacer Global Cash Cows Dividend Index since 2/22/2016. It has 101 holdings, a 12-month distribution yield of 4.12%, and a total expense ratio of 0.60%. Distributions are paid quarterly.
As described by PACER ETFs, constituents must be in the FTSE All-World Developed Large Cap Index, excluding REITs (real estate investment trusts), financials, and companies with negative projected free cash flows or earnings for the next 2 years.
The 300 remaining companies with the highest free cash flow yield are ranked by dividend yield. Then, the 100 companies with the highest dividend yield are included in the index. Constituents are weighted based on total dividends distributed in the trailing 12 months, with a maximum weight of 2% for any individual company. The index is reconstituted twice a year in June and December.
The fund invests mostly in large companies (96% of asset value). The two heaviest countries are the U.S. (17.6%) and the U.K (15.6%). Then, come Germany and Japan, close to 12% each. Other countries are below 8%. China and Hong Kong weigh 4.8% together, which represents an acceptable risk to geopolitical and regulatory risks related to China. The next chart lists the top ten countries, with an aggregate weight of 86%.
GCOW countries (chart: author; data: PACER ETFs)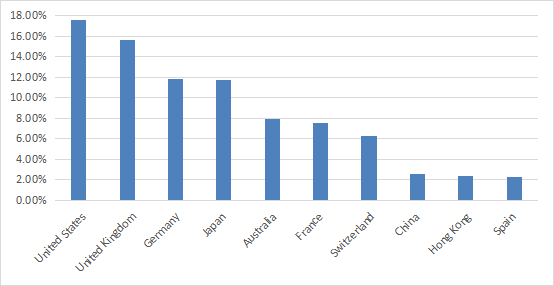
The top 3 sectors are materials (19%), industrials and communication (each between 15% and 16%). The portfolio is well-balanced across sectors compared to many other funds, but technology and utilities are underweight.
GCOW sector breakdown in % (chart: author; data: PACER ETFs)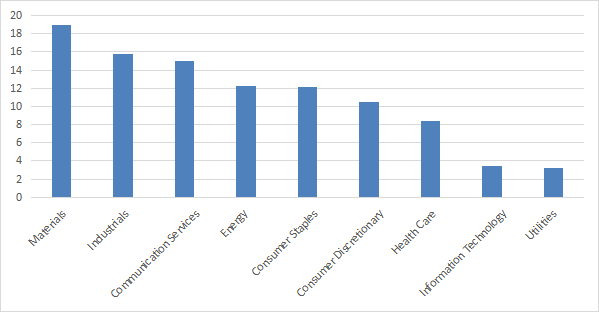
The top 10 holdings, listed below, represent 20.9% of asset value. The top name is below 2.5%, so risks related to individual stocks are low. The 3 major German car makers are in the top 10, and they weigh 6.15% together.
|
US Ticker* |
Name |
Weight |
EPS growth %TTM |
P/E TTM |
P/E fwd |
Yield% |
|
Fortescue Metals Group Ltd. |
2.25% |
-38.26 |
7.84 |
N/A |
8.98 |
|
|
BHP Group Ltd. |
2.13% |
N/A |
7.67 |
11.55 |
9.38 |
|
|
Rio Tinto Plc |
2.13% |
-4.77 |
7.06 |
8.86 |
9.62 |
|
|
Bayerische Motoren Werke AG |
2.10% |
39.52 |
3.32 |
3.56 |
6.07 |
|
|
Sanofi |
2.09% |
7.92 |
16.49 |
11.34 |
3.55 |
|
|
Verizon Communications, Inc. |
2.08% |
-13.54 |
9.10 |
8.08 |
6.24 |
|
|
Woodside Energy Group Ltd. |
2.05% |
767.65 |
8.00 |
7.28 |
8.29 |
|
|
Mercedes-Benz Group AG |
2.04% |
54.65 |
3.05 |
5.54 |
0 |
|
|
TotalEnergies SE |
2.04% |
113.84 |
7.19 |
4.57 |
4.38 |
|
|
Volkswagen AG |
2.01% |
-16.23 |
4.89 |
3.94 |
4.50 |
* the fund may hold stocks in the primary exchange.
Aggregate valuation ratios are cheap relative to international median values, as reported in the next table.
|
GCOW |
International equity median |
|
|
P/E ttm |
6.02 |
11.76 |
|
P/book |
1.26 |
1.59 |
|
P/sales |
0.8 |
1.21 |
|
P/cash flow |
4.18 |
8.45 |
Source: Fidelity
Past performance
Since inception, GCOW has outperformed the Vanguard FTSE Developed Markets ETF (VEA), an international developed market benchmark.
|
Total Return |
Annual.Return |
Drawdown |
Sharpe |
Volatility |
|
|
GCOW |
77.58% |
8.70% |
-37.64% |
0.47 |
16.59% |
|
VEA |
64.81% |
7.53% |
-35.73% |
0.4 |
16.21% |
Data calculated with Portfolio123
However, foreign equities have lagged the U.S. market: in the same period, the S&P 500 shows a total return of 133% (13% annualized).
The next chart compares GCOW since inception with 3 international dividend ETFs: the Vanguard International Dividend Appreciation ETF (VIGI), the WisdomTree Global ex-U.S. Quality Dividend Growth Fund (DNL) and the Vanguard International High Dividend Yield ETF (VYMI). These funds exclude the U.S., which is a handicap relative to GCOW.
GCOW vs global dividend ETFs since inception (Portfolio123)
GCOW beats VYMI and is almost tied to VIGI. It lags DNL, but looks less risky regarding drawdowns and volatility. GCOW was the best performer of the list in 2022, showing a positive return in the last 12 months.
GCOW vs global dividend ETFs, last 12 months (Portfolio123)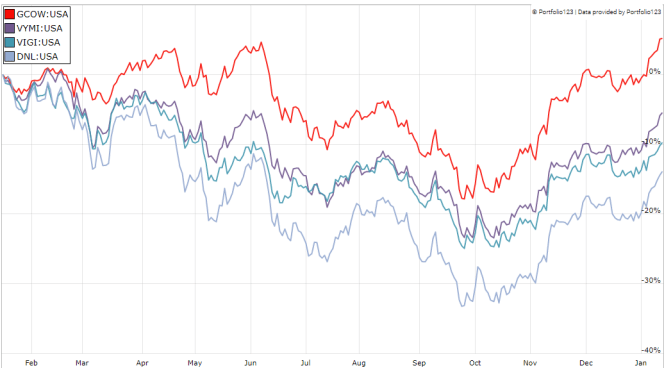
The GCOW share price has gained 29% since inception. The capital gain is sub-par compared to most U.S. dividend funds with similar yields on the same time interval, but superior to many international dividend funds. As the cumulative inflation in this period was about 24%, the fund has preserved the capital of shareholders, excluding distributions.
GCOW share price (TradingView on SeekingAlpha)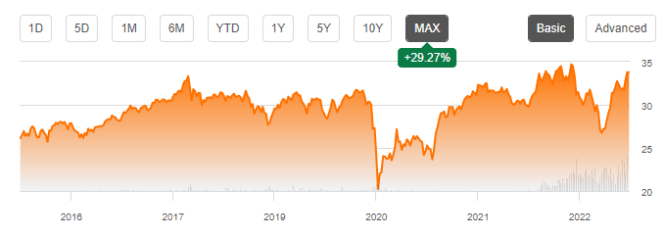
The sum of annual distributions has increased from $0.88 to $1.39 between 2017 and 2022. The 5-year annualized dividend growth rate is 9.6%, which is good. It is similar to the ProShares S&P 500 Dividend Aristocrats ETF (NOBL), with a value of 9.4% for the same period.
Takeaway
Pacer Global Cash Cows Dividend ETF is an international dividend fund with a portfolio of 100 large caps in developed markets. It implements a systematic strategy based on cash flow and dividends. The geographical exposure and sector breakdown are quite balanced: no sector and no country weighs more than 19%. Exposure to geopolitical risks related to China is about 5%.
Total return since inception beats an international benchmark and is similar to VIGI. Valuation ratios and the annualized dividend-growth rate are attractive. For transparency, a dividend-oriented part of my equity investments is split between a passive ETF allocation and my actively managed Stability portfolio (14 stocks), disclosed and updated in Quantitative Risk & Value.
Editor’s Note: This article discusses one or more securities that do not trade on a major U.S. exchange. Please be aware of the risks associated with these stocks.
Be the first to comment