

GBP/USD started a fresh decline below the 1.3850 support. USD/CAD rallied and it was able to clear the 1.2750 resistance zone.
Important Takeaways for GBP/USD and USD/CAD
· The British Pound started a major decline below the 1.3850 and 1.3800 support levels.
· There is a key bearish trend line forming with resistance near 1.3770 on the hourly chart of GBP/USD.
· USD/CAD started a major increase after it cleared the 1.2700 and 1.2720 levels.
· There was a break above a contracting triangle with resistance near 1.2680 on the hourly chart.
GBP/USD Technical Analysis
After struggling to clear the 1.3900 resistance, the British Pound started a major decline against the US Dollar. The GBP/USD pair broke the 1.3850 support level to move into a bearish zone.
The bears gained strength and were able to push the pair below the 1.3800 support. The pair even broke the 1.3750 support zone and the 50 hourly simple moving average. Finally, it spiked below 1.3720 and traded as low as 1.3701 on FXOpen.
It is now consolidating losses near the 1.3700 zone. An immediate resistance is near the 1.3725 level. It is near the 23.6% Fib retracement level of the recent drop from the 1.3812 high to 1.3701 low.
The first major resistance is near the 1.3755 level. It is close to the 50% Fib retracement level of the recent drop from the 1.3812 high to 1.3701 low. There is also a key bearish trend line forming with resistance near 1.3770 on the hourly chart of GBP/USD.
If there is an upside break above the trend line, the pair could recover above 1.3780. The next key resistance could be 1.3800 and the 50 hourly simple moving average, above which the pair could gain strength.
On the downside, the first key support is near the 1.3700 area. If there is a break below 1.3700, the pair could decline extend its decline. The next key support is near the 1.3640 level. Any more losses might call for a test of the 1.3600 support.
USD/CAD Technical Analysis
The US Dollar formed a base above the 1.2600 zone against the Canadian Dollar. As a result, the USD/CAD pair started a steady increase above the 1.2680 and 1.2700 resistance levels.
The upward move gained pace above the 1.2700 zone and the 50 hourly simple moving average. Besides, there was a break above a major contracting triangle with resistance near 1.2680 on the hourly chart.
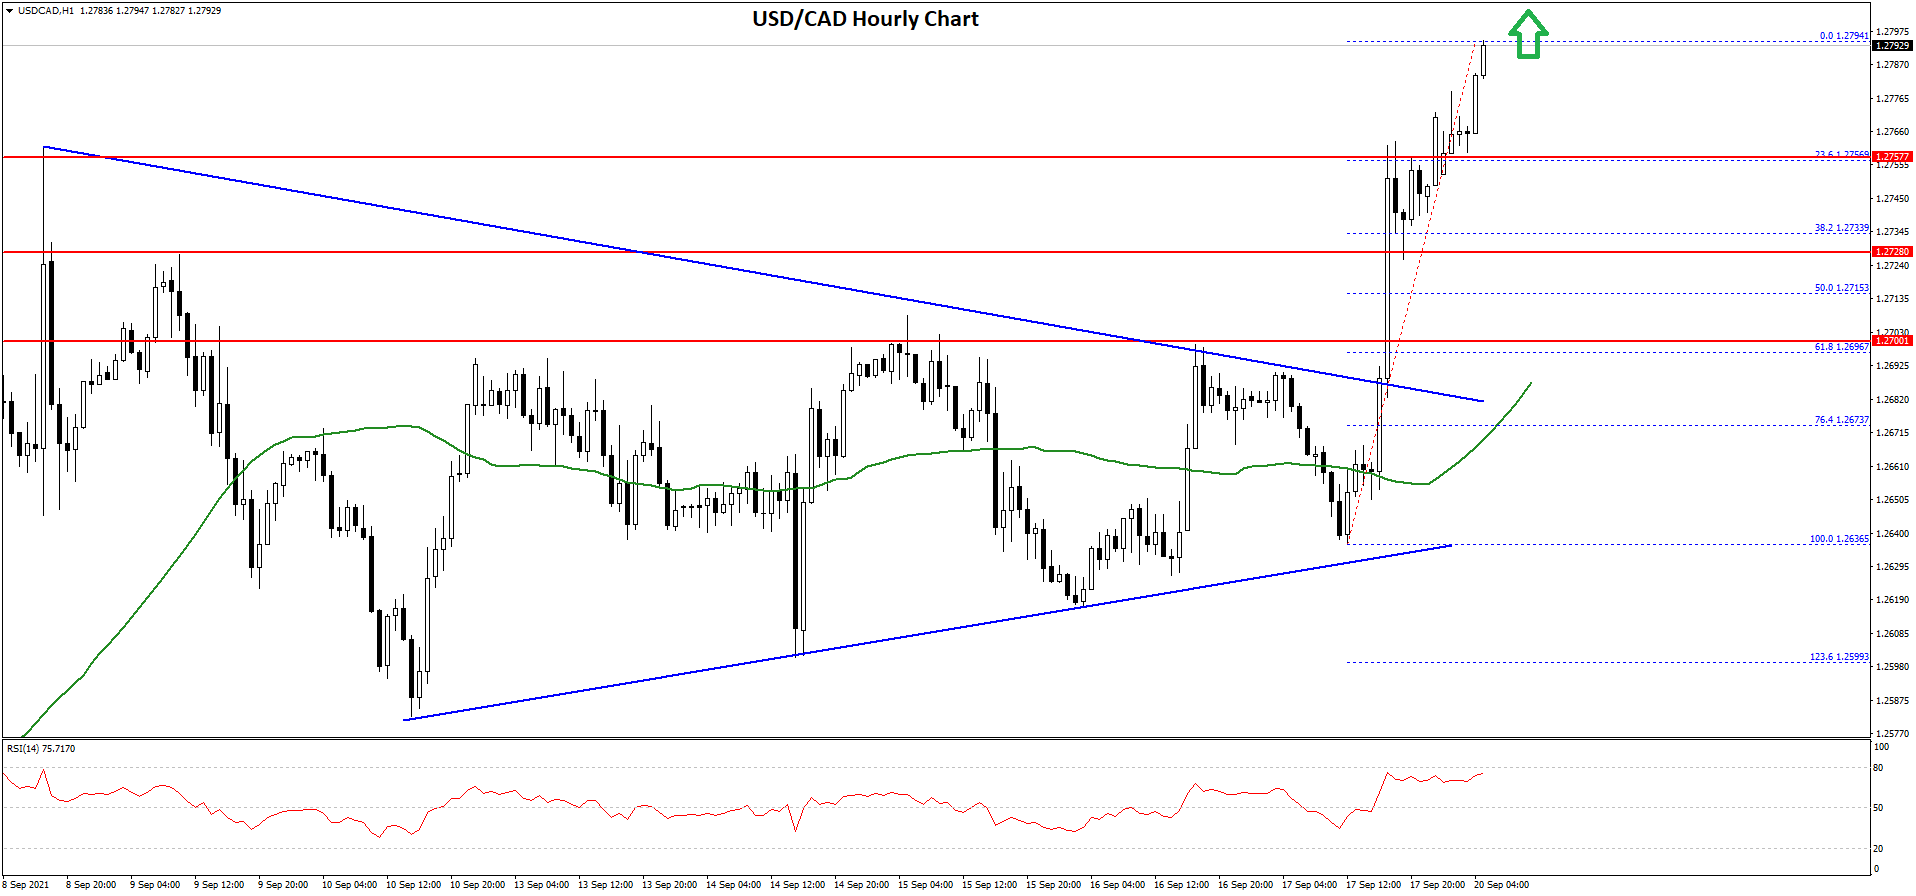
The pair even broke the 1.2750 level and traded as high as 1.2794. It is now showing positive signs above the 1.2780 level. An initial support on the downside is near the 1.2755 level. It is near the 23.6% Fib retracement level of the upward move from the 1.2636 swing low to 1.2794 high.
The first major support is near the 1.2715 level. It is close to the 50% Fib retracement level of the upward move from the 1.2636 swing low to 1.2794 high.
The next major support is near the 1.2700 level. Any more losses may possibly open the doors for a drop towards the 1.2640 support.
On the upside, an immediate resistance is near the 1.2800 level. The first major resistance is near the 1.2820 level, above which the pair might retest 1.2900.
This forecast represents FXOpen Markets Limited opinion only, it should not be construed as an offer, invitation or recommendation in respect to FXOpen Markets Limited products and services or as financial advice.

Be the first to comment