

GBP/USD started a major decline below the 1.2300 support. USD/CAD is showing positive signs and gaining pace above the 1.2950 level.
Important Takeaways for GBP/USD and USD/CAD
· The British Pound started a fresh decline from the 1.2400 resistance zone.
· There was a break above a short-term bearish trend line with resistance near 1.2220 on the hourly chart of GBP/USD.
· USD/CAD started a fresh increase from well below the 1.2650 zone.
· There was a break above a key bearish trend line with resistance near 1.2965 on the hourly chart.
GBP/USD Technical Analysis
After struggling to clear the 1.2400 resistance zone, the British Pound found started a fresh decline against the US Dollar. GBP/USD traded below the 1.2300 support level to move into a bearish zone.
The bears gained strength for a move below the 1.2200 level and the 50 hourly simple moving average. The pair even spiked below the 1.2180 level and traded as low as 1.2155 on FXOpen. Recently, there was an upside correction above the 1.2200 level.
There was a break above a short-term bearish trend line with resistance near 1.2220 on the hourly chart of GBP/USD. The pair even spiked above the 50% Fib retracement level of the downward move from the 1.2399 swing high to 1.2155 low.
An immediate resistance is near the 1.2295 level. The next key resistance is near the 1.2305 level. It is near the 61.8% Fib retracement level of the downward move from the 1.2399 swing high to 1.2155 low.
If there is an upside break above the 1.2305 zone, the pair could rise towards 1.2400. The next key resistance could be 1.2450, above which the pair could gain strength.
On the downside, an initial support is near the 1.2220 area. The first major support is near the 1.2200 level. If there is a break below 1.2200, the pair could extend its decline. The next key support is near the 1.2150 level. Any more losses might call for a test of the 1.2040 support.
USD/CAD Technical Analysis
The US Dollar started a fresh increase from the 1.2720 zone against the Canadian Dollar. USD/CAD gained pace for a move above the 1.2750 resistance zone.
The pair settled above the 1.2920 level and the 50 hourly simple moving average. Recently, there was a downside correction from the 1.3075 zone, but the bulls were active near the 1.2900 zone. A low is formed near 1.2894 and the pair is now rising.
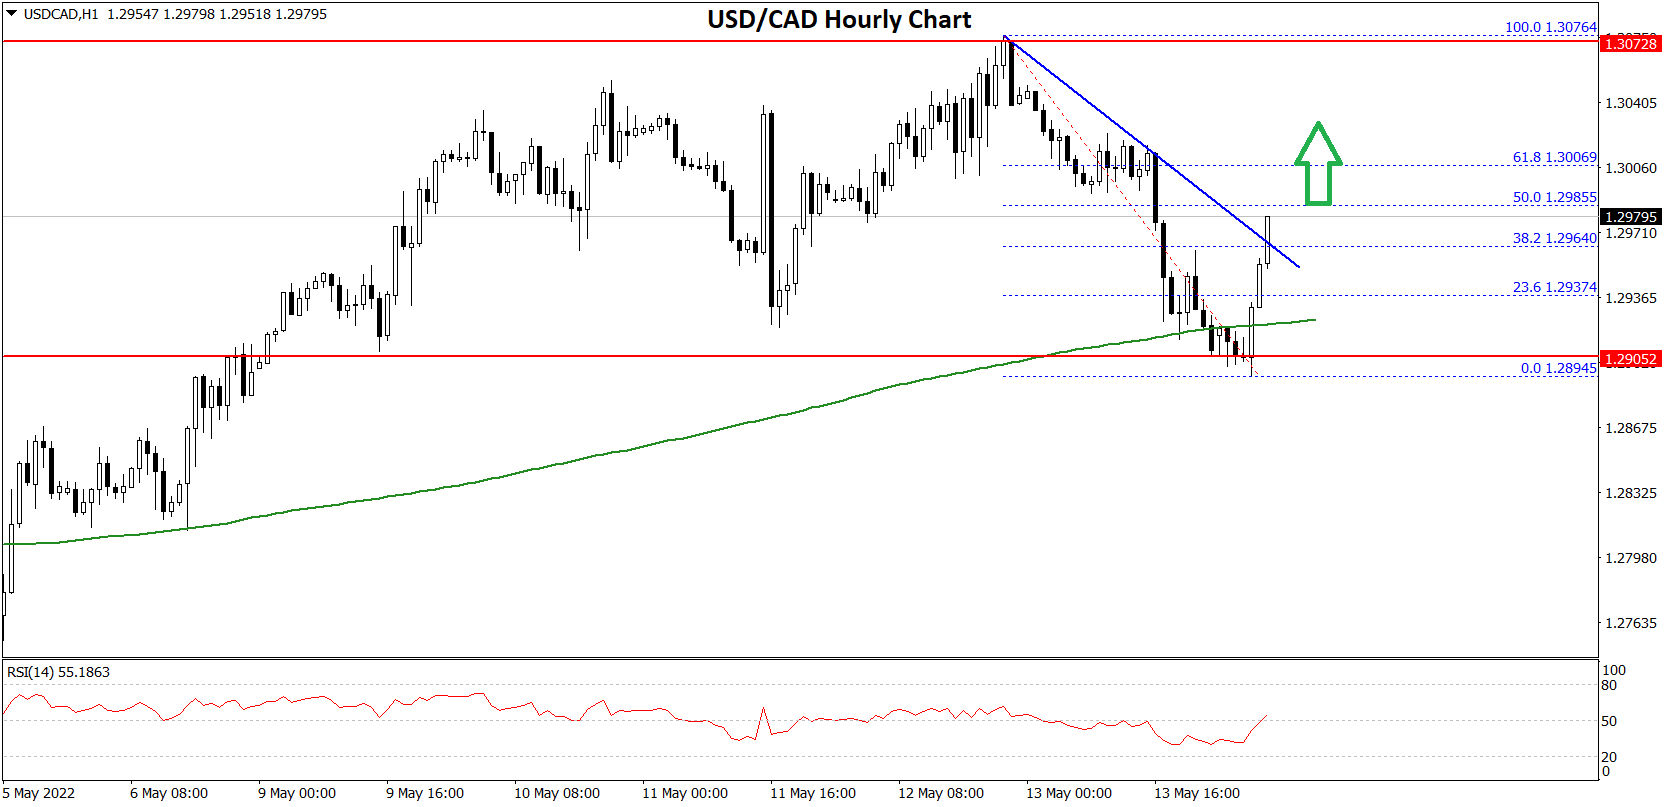
There was a break above a key bearish trend line with resistance near 1.2965 on the hourly chart. The pair climbed above the 38.2% Fib retracement level of the downward move from the 1.3076 swing high to 1.2894 low.
On the upside, the pair is facing resistance near 1.3000 or the 50% Fib retracement level of the downward move from the 1.3076 swing high to 1.2894 low.
The next major resistance is near the 1.3020 level. A clear break above the 1.3020 level could open the doors for more gains. The next major resistance is near the 1.3075 level.
An immediate support is near the 1.2950 level. The first major support is near the 1.2920 level. Any more losses may possibly open the doors for a drop towards the 1.2880 support.
This forecast represents FXOpen Markets Limited opinion only, it should not be construed as an offer, invitation or recommendation in respect to FXOpen Markets Limited products and services or as financial advice.

Be the first to comment