

Kobus Louw/E+ via Getty Images
Gartner, Inc (NYSE:IT) is an IT Services & Consulting company that I believe to be overvalued due to the market not having a clear understanding of the company’s potential for new clients joining the platform. Gartner delivers actionable insights to executives and their teams. Their expert guidance enables faster, smarter decisions and stronger performance on an organization’s mission.
According to its 10-K report, Gartner’s products are divided into three distinct segments: Research, Conferences, and Consulting. The research segment (87% of revenues) consists of a subscription service and consulting fees for executives to access the Gartner platform and gain an objective perspective on the companies offering a product for the executive’s mission. The most common product includes the Magic Quadrant, which rates companies against each other in an industry with personalized ratings based on what the executives believe to be apt. The Consulting segment (9% of revenues) delivers consulting services to vendors in order to rank them higher on the Gartner platform. It follows a fee-driven business model. The Conference segment (5% of revenues) consists of both physical and digital conferences since 2020. This segment generates revenues by fees from attendees and contracts from vendors to install their booths.
Gartner has experienced double-digit revenue growth since 2009, except for 2015 and 2017. While key performance indicators have improved, Gartner has continuously performed tuck-in acquisitions since 2014.
Research Revenue Breakdown
Research revenue can be divided into three segments: client consulting fees, existing clients, and new clients. With Research revenues growing at a double-digit growth rate, a stable consulting fees margin of ~9%, and an increasing client retention rate of ~87%— revenue from new clients’ growth rate has been decreasing consecutively since 2016, excluding 2020 and 2021. With the release of 2022Q1 earnings, revenue from new clients is still below 2018 levels—$258.45 million to $301.80 million, respectively.
Research Revenue Value Proposition
Because of Gartner’s M&A activity, the company’s high-growth story has been continuously proven as it expands to a ~200 billion TAM. Given the company’s acquisition flop of CEB, management has stated that tuck-in acquisitions are no longer a priority but could happen again. While revenues from new clients were decreasing, Covid-19 gave the company a much-needed boost— raising the client retention rate and payments from new clients to never before seen levels (87% and 6.6%, respectively). When developing a P x Q revenue build based on these KPIs, it is impossible to gain a complete view of the company’s performance due to Gartner’s lack of disclosure on its number of clients. Because of this, Sell-Side has decided to utilize the company’s contract value metrics to value the company. Because most of Gartner’s contracts are multi-year and lack disclosure on the average amount of years they last, it is not easy to utilize these metrics to understand Gartner’s future. There have been zero cases where Gartner’s research revenue growth matches its contract value growth. Because of these factors, a model based on existing client revenue and new client revenue can be considered more precise even if it is still imperfect. Due to limited M&A activity and the end of the Covid-19 pandemic, research revenues are apt to reflect new client revenue.
This would reflect a downturn in the FCF growth rate, an essential indicator for shareholders when deciding how to value Gartner as demonstrated below:
CapitalIQ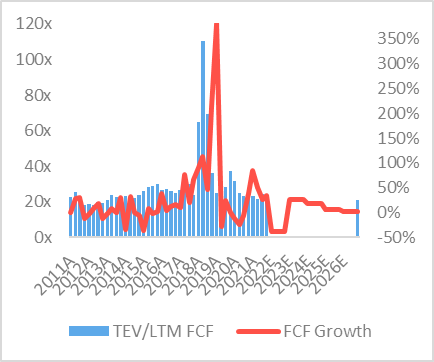
This decreasing growth rate could result in a lower TEV/LTM FCF multiple— lowering the company’s multiple to be more in line with its competitors.
This thesis is reliant on earnings reports demonstrating decreasing revenues in order for Sell-Side to realize Gartner is becoming a mature company. It is not reliant on Sell-Side understanding that new client revenues are decreasing, instead just that revenues overall will be decreasing in the long-term. If a disruptive change such as Covid-19 were to occur again, this thesis could be delayed but not become obsolete. New client revenues could also take longer to decrease if Gartner switches its stance on company acquisitions. Notwithstanding, I believe that betting on management changing its stance is unlikely and not worth betting on.
Industry Overview
Gartner operates in the IT Services & Consulting industry. A vast differentiation of products dominates this industry. For example, Forrester Research, Inc (FORR) offers market-specific data, while IDC offers business-specific data across its branches. Until 2017, Gartner operated specifically in the IT market— which led it to have a ROIC of ~30%. Aside from Gartner’s acquisitions, this industry holds an influx of institutional investors— with Blackstone (BX) purchasing IDC in late 2021 for $1.3 billion. The companies’ specialization has allowed them to gain excess ROIC returns above their cost of capital due to buyers preferring return on investment over overall cost when purchasing a product. The potential for new entrants into the industry is also low, with an SG&A margin above ~40% and increasing government regulation from the General Data Protection Regulation, the California Consumer Privacy Act of 2018, and the General Data Protection Law. With an expected growth rate of 3.2% until 2025 as shown above, the industry still faces expansion opportunities without increasing levels of competition. It is also vital to understand that brand plays a key influence on consumers— leading to low churn levels below ~22%.
Intrinsic Indicators
Because of the CEB acquisition by Gartner, its TAM has increased from ~55 billion to ~200 billion. This increase comes at the cost of expansion into the business services segment, resulting in rising competition levels in the industry— specifically against IDC. Even during 2021— whereby Gartner has experienced never before observed positive ratios of revenue per employee (0.29x $mm), client retention rate (86%), and EBIT margin (19.3%)— the company’s ROIC only reached ~15.70%. This is nearly half its ROIC pre-CEB acquisition of ~30%:
Author utilizing information from the 10-K Report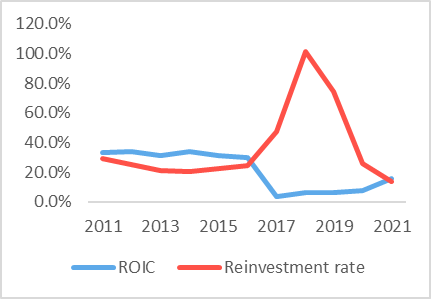
With its reinvestment rate dropping to ~13.9% in 2021, Gartner’s management has stated their modest CapEx needs signifying they plan on reinvesting less than they have pre-pandemic.
Translating Characteristics To Valuation
Projected Period Revenues (2022-2026)
Due to the 2022Q1 client retention rate increasing to 87%, this value is utilized until 2025, whereby an average 84% is used afterward.
Author utilizing information from the 10-K Report and Earnings Call Transcripts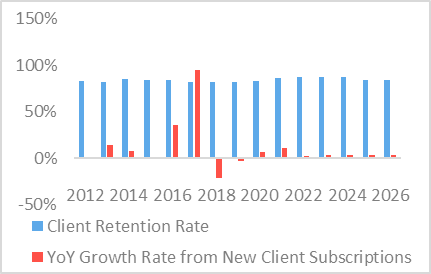
This assumption is based on total conferences by Gartner returning to normal levels between 2024-2025, signifying the company has returned to normalized levels. Based on management’s expectations of the research segment, revenue from new clients will only increase by 2.6% (its slowest growth ever). I utilized an average growth rate of 3.8% based on an average growth rate since 2013.
Due to physical conferences being more profitable than digital conferences, I apply a growth rate on physical conferences above 30% while increasing digital conferences by 3% every year following 2022.
Author utilizing information from the 10-K Report and Earnings Call Transcripts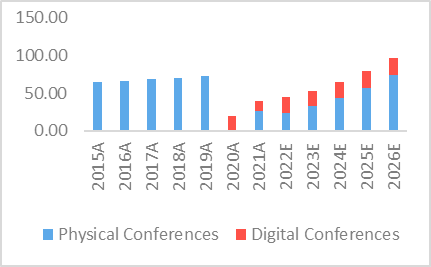
This assumption implies that physical events do not substitute digital conferences which I believe to be optimistic. In the model, revenue per physical conference is projected to return to 2019 levels by 2023 and to continue increasing at a rate of 13% per year.
Due to management’s ambitious goal of increasing employee count, this model utilized the two highest growth years (2018 and 2019) as its average growth rate.
Author utilizing information from the 10-K Report and Earnings Call Transcripts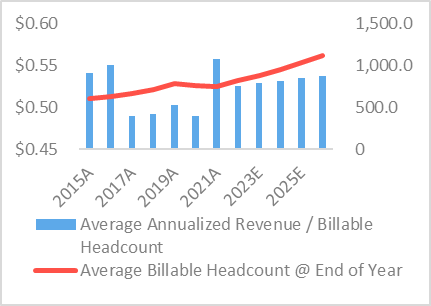
Average annualized revenue per billable headcount is grown at a rate of 3%, which is conservative given its nature of remaining constant after the substantial decline from the 2017 CEB acquisition.
Projected Period Expenses (2022-2026)
COGS Margin for 2022 is calculated as an average of 2020 and 2021, given that those years have the lowest value. This 31.7% value is similar to 2022Q1 earnings and Sell-Side projections. Afterward, the COGS margin increases based on the average of the margins of 2022 and 2019 to add a more normalized value. This is in line with Sell-Side expectations. SG&A margin increases from 45.5% to 49.5% in 2022 due to the 2022Q1 result of 49% due to hiring. This is in line with the 2019 SG&A margin. Depreciation is based on a standard PP&E schedule. Depreciation is calculated as an average of the percent of Gross PPE from 2019-2021, resulting in a ~15% margin. Capital expenditures are calculated from an average of 2019-2021 since those years have the lowest margin as of percent of revenues. If taking into consideration 2018 for example (a normalized year), the margin increases from 2.7% to 3.3% (resulting in a ~15% downside instead). Management’s amortization expectations are utilized in the model. Given the nature of management reducing M&A transactions, integration charges are lowered to 0 except for 2022— whereby the 2022Q1’s value is added. The result leads to a company with almost double 2019’s EBIT margin— reaching ~15%.
Terminal Value
Due to the current LTM TEV/FCF ~21.7x, an exit multiple of 20.7x is utilized. This would imply a terminal growth rate of 3.03%. Due to the company’s valued expectation of mid-single-digit growth, decreasing FCF margin, and the market’s importance to these metrics— this exit multiple may be lower, which would imply a more significant downside. This 20.7x reflects the market’s view of the company changing from high growth to maturing growth.
Author utilizing information from the 10-K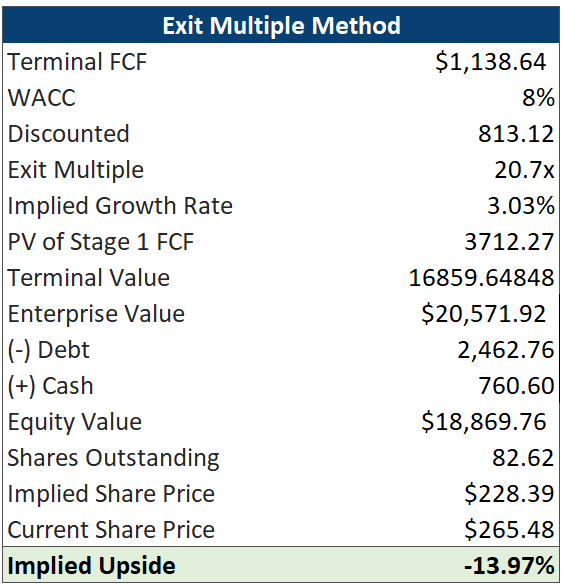
This terminal growth rate of 3.03% is also well above the average United States GDP growth in the long term, ignoring the current negative expectations for the country’s growth. With all these metrics taken under consideration with share dilution and a WACC of 8%, the calculated implied share price is $228.39— 13.97% below the current share price.
When taking into consideration a sensitivity analysis, we can observe that even if Gartner traded at a higher multiple than it currently does such as 24.7x, it would still face almost no upside:
Author utilizing information from the 10-K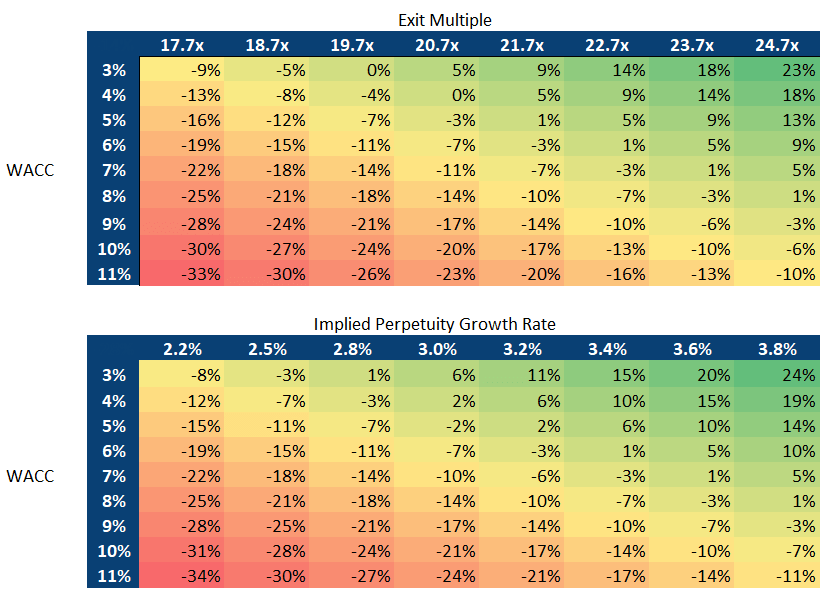
This allows for a margin of safety if the thesis were to not reach fruition and Gartner is a better business than the market currently believes. I also believe that a bull-case is unlikely with my current already very bullish projections for free cash flow, expecting the company to match pre-Covid levels of free cash flow by 2023:
Author utilizing information from the 10-K Report and Earnings Call Transcripts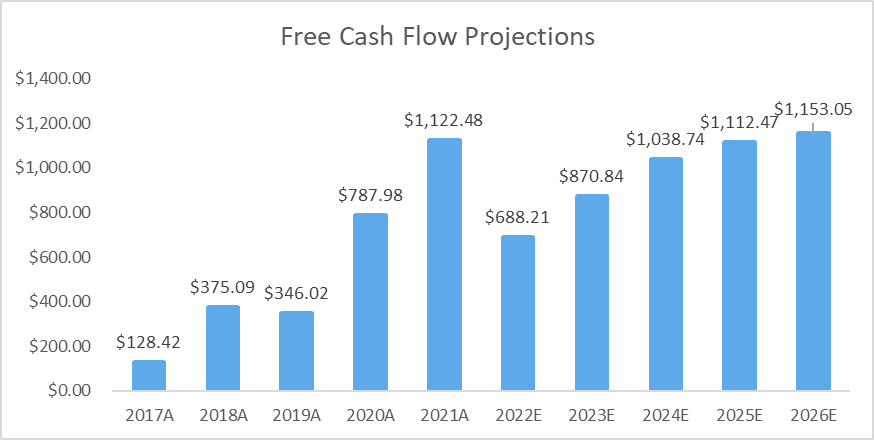
Conclusion
In conclusion, Gartner is overvalued due to the market not placing as strong of reliance on its acquisition of new clients. This will result in Gartner no longer being a double-digit growth company and suffering a multiple compression as a result. In order for this thesis to occur, the market does not need to back-track to the new client growth rate nor switch from its current contract value approach to valuing the top line. Instead, the market will adjust based on its earnings calls consistently demonstrating single-digit growth. If attempting to find a bull case for the stock, many of my calculated metrics would have to be made more conservative which would arrive at the company potentially being more overvalued.
Be the first to comment