

GBP/USD started a major decline and traded below 1.1000. GBP/JPY is also diving and there was a clear move below the 155.00 support.
Important Takeaways for GBP/USD and GBP/JPY
· The British Pound started a major decline below the 1.1000 support against the US Dollar.
· There is a connecting bearish trend line forming with resistance near 1.1220 on the hourly chart of GBP/USD.
· GBP/JPY declined steadily after it failed to clear the 165.00 resistance zone.
· There is a major bearish trend line forming with resistance near 152.50 on the hourly chart.
GBP/USD Technical Analysis
This past week, the British Pound started a major decline from the 1.1400 zone against the US Dollar. The GBP/USD pair declined below the 1.1200 support to move into a bearish zone.
There was a steady decline below the 1.1100 level and the 50 hourly simple moving average. The pair even traded below the 1.0850 support zone. The pair traded as low as 1.0341 on FXOpen and is currently consolidating losses.
An immediate resistance on the upside is near the 1.0580 level. It is near the 23.6% Fib retracement level of the recent decline from the 1.1364 swing high to 1.0341 level.
The next major resistance is near the 1.0850 level. It coincides with the 50% Fib retracement level of the recent decline from the 1.1364 swing high to 1.0341 level, above which the pair could start a steady increase.
There is also a connecting bearish trend line forming with resistance near 1.1220 on the hourly chart of GBP/USD. An upside break above 1.1220 might start a fresh increase towards 1.1350. Any more gains might call for a move towards 1.1450 or even 1.1500.
An immediate support is near the 1.0450. The next major support is near the 1.0350 level. If there is a break below the 1.0350 support, the pair could test the 1.0200 support. Any more losses might send GBP/USD towards 1.0000.
GBP/JPY Technical Analysis
The British Pound also started a fresh decline from the 165.00 zone against the Japanese Yen. The GBP/JPY pair gained pace below the 162.80 and 160.50 support levels.
There was a clear move below the 158.00 level and the 50 hourly simple moving average. The pair even declined below 150.00 support and traded as low as 148.72. It is now consolidating losses above the 150.50 zone.
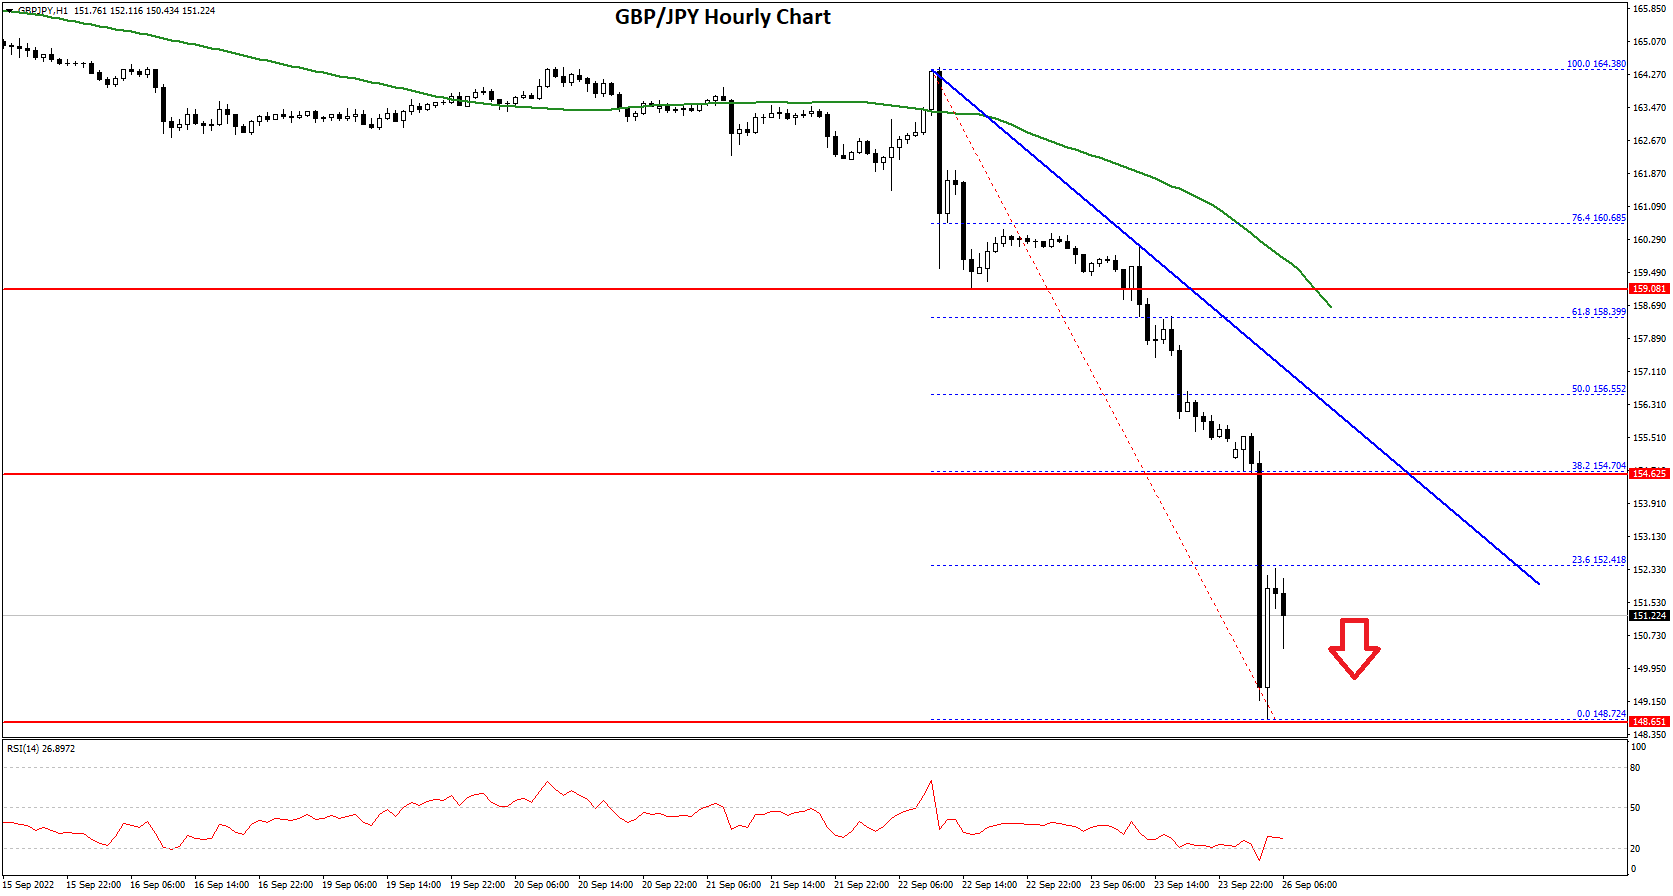
An immediate resistance on the upside is near the 152.40 zone. It is near the 23.6% Fib retracement level of the downward move from the 164.38 swing high to 148.72 low.
The next key resistance could be 152.50. There is also a major bearish trend line forming with resistance near 152.50 on the hourly chart. It is near the 38.2% Fib retracement level of the downward move from the 164.38 swing high to 148.72 low.
A clear break above the 152.50 resistance could push the pair towards the 155.00 resistance. If not, the pair could continue to move down below 151.00.
On the downside, an initial support is near the 150.50 level. The next major support is near the 150.00. If there is a downside break below the 150.00 support, the pair could decline towards the 148.00 support zone. Any more losses might send the pair towards the 146.50 level in the near term.
This forecast represents FXOpen Markets Limited opinion only, it should not be construed as an offer, invitation or recommendation in respect to FXOpen Markets Limited products and services or as financial advice.
Trade global forex with the best ECN broker of 2021*.
Choose from 50+ forex markets 24/5.
Open your FXOpen account now or learn more about making your money go further with FXOpen.
* FXOpen International, best ECN broker of 2021, according to the IAFT

Be the first to comment