

GBP/USD started a decent increase above the 1.2550 resistance. EUR/GBP is struggling to clear the 0.8500 and 0.8520 resistance levels.
Important Takeaways for GBP/USD and EUR/GBP
· The British Pound started a decent increase above 1.2550 against the US Dollar.
· There was a break above a key contracting triangle with resistance near 1.2640 on the hourly chart of GBP/USD.
· EUR/GBP is holding the 0.8480 support but struggling above 0.8500.
· There was a break above a major bearish trend line with resistance near 0.8500 on the hourly chart.
GBP/USD Technical Analysis
The British Pound remained well bid above the 1.2400 zone against the US Dollar. The GBP/USD pair started a decent increase after it broke the 1.2500 resistance.
There was a clear move above the 1.2550 level and the 50 hourly simple moving average. The bulls were even able to clear the 1.2600 resistance. Recently, there was a break above a key contracting triangle with resistance near 1.2640 on the hourly chart of GBP/USD.
The pair traded as high as 1.2663 and is currently consolidating above the 50% Fib retracement level of the recent decline from the 1.2663 swing high to 1.2585 low.
On the upside, an initial resistance is near the 1.2650 level. It is near the 76.4% Fib retracement level of the recent decline from the 1.2663 swing high to 1.2585 low. The next main resistance is near the 1.2665 zone.
A clear upside break above the 1.2665 and 1.2680 resistance levels could open the doors for a steady increase in the near term. The next major resistance sits near the 1.2750 level.
If not, the pair might start a downside correction below 1.2620. The next major support is near the 1.2600 level. Any more losses could lead the pair towards the 1.2550 support zone or even 1.2520.
EUR/GBP Technical Analysis
The Euro struggled to continue higher above the 0.8580 level against the British Pound. The EUR/GBP pair started a fresh decline and traded below the 0.8520 support.
The pair even traded below the 0.8500 level and the 50 hourly simple moving average. It traded as low as 0.8480 and is currently attempting an upside break. There was a move above the 23.6% Fib retracement level of the recent decline from the 0.8528 high to 0.8480 low.
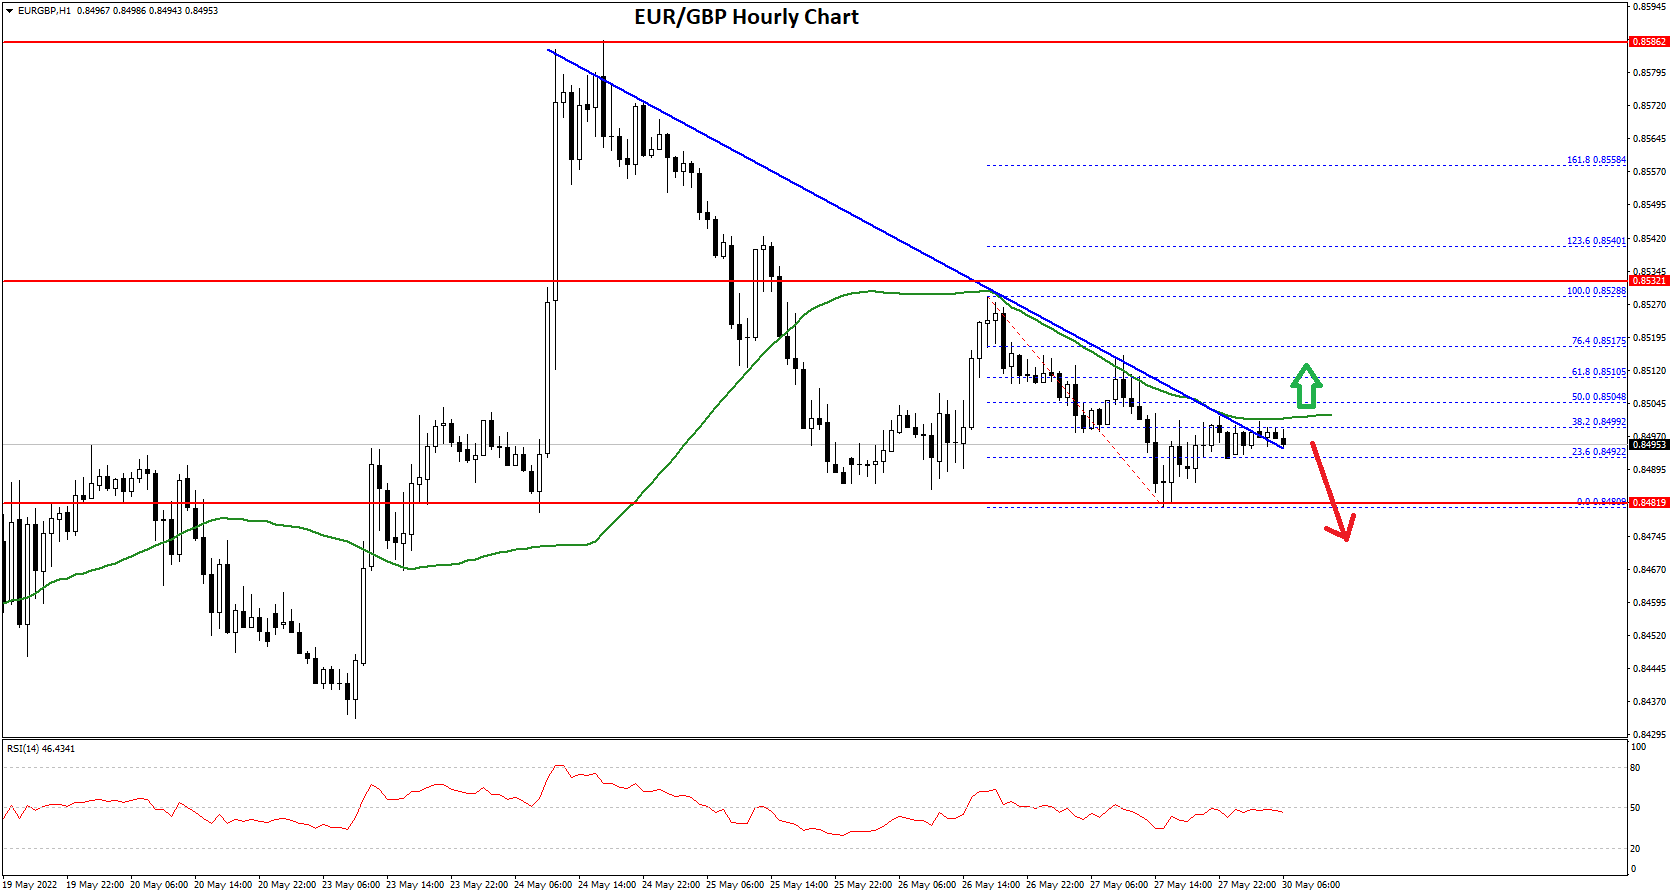
Besides, there was a break above a major bearish trend line with resistance near 0.8500 on the hourly chart. The pair is now facing resistance near the 0.8500 level and the 50 hourly simple moving average.
The next major resistance for the bulls is near the 0.8505 level. It is near the 50% Fib retracement level of the recent decline from the 0.8528 high to 0.8480 low. A clear move above the 0.8505 resistance might push the price higher.
The next main resistance on the upside is near the 0.8520 level, above which the pair could even climb towards 0.8550. On the downside, an initial support is near the 0.8480 level. The next major support is near 0.8450
A downside break below the 0.8450 support might call for more downsides. In the stated case, the pair could decline towards the 0.8400 support level in the near term.
This forecast represents FXOpen Markets Limited opinion only, it should not be construed as an offer, invitation or recommendation in respect to FXOpen Markets Limited products and services or as financial advice.

Be the first to comment