

GBP/USD started a fresh increase above the 1.2200 resistance zone. EUR/GBP is slowly moving lower below the 0.8880 support zone.
Important Takeaways for GBP/USD and EUR/GBP
· The British Pound started a fresh increase above the 1.2200 resistance against the US Dollar.
· There is a key bullish trend line forming with support near 1.2220 on the hourly chart of GBP/USD.
· EUR/GBP started a downside correction below the 0.8880 support zone.
· There was a break below a connecting bullish trend line with support near 0.8860 on the hourly chart.
GBP/USD Technical Analysis
The British Pound remained well bid above the 1.2120 level against the US Dollar. The GBP/USD pair gained pace above the 1.2200 level to move into a positive zone.
There was a clear move above the 1.2220 level and the 50 hourly simple moving average. The bulls seem to be in control and a high is formed near 1.2287 on FXOpen. It is now consolidating gains and showing positive signs above the 1.2250 level.
On the upside, an initial resistance is near the 1.2300 level. The first major resistance is near the 1.2320 level. A clear move above the 1.2320 level could spark a decent increase.
The next major resistance sits near the 1.2200 level. Any more gains might send the pair towards the 1.2400 resistance zone. On the downside, an initial support is near the 1.2250 level or the 23.6% Fib retracement level of the upward move from the 1.2150 swing low to 1.2287 high.
The next major support is near the 1.2220 level. There is also a key bullish tend line forming with support near 1.2220 on the hourly chart of GBP/USD.
The trend line is near the 50% Fib retracement level of the upward move from the 1.2150 swing low to 1.2287 high. Any more losses could lead the pair towards the 1.2150 support zone.
EUR/GBP Technical Analysis
The Euro started a steady fresh increase from the 0.8780 support zone against the British Pound. The EUR/GBP pair climbed above the 0.8850 zone to move into a bullish zone.
The pair even traded above the 0.8880 level and the 50 hourly simple moving average. Finally, there was a move above the 0.8895 level. The pair traded as high as 0.8896 and is currently correcting gains. There was a minor decline below the 0.8880 level.
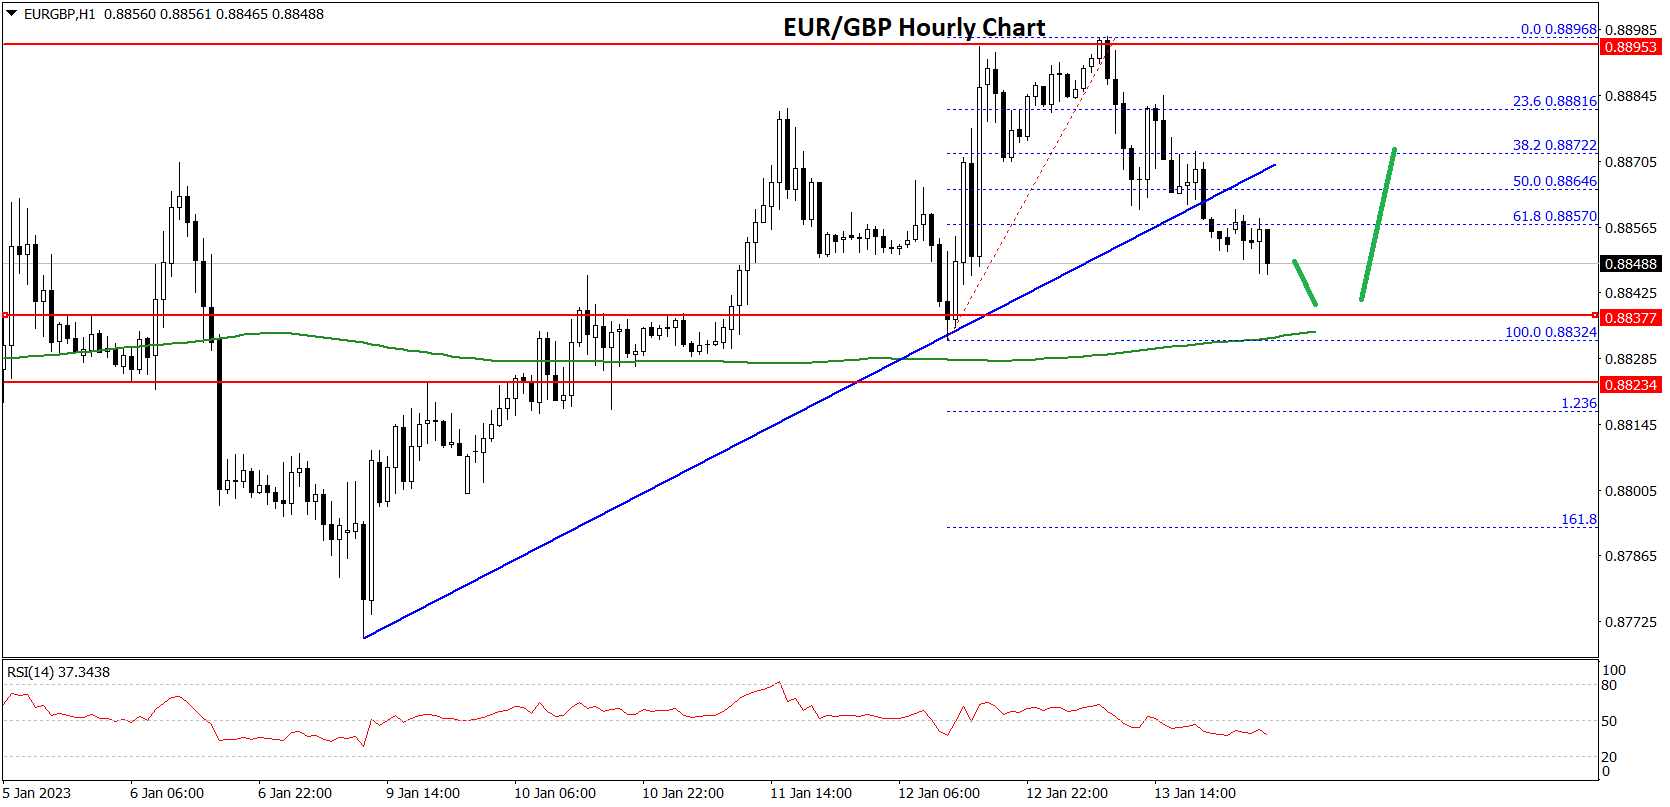
The pair declined below the 50% Fib retracement level of the upward move from the 0.8832 swing low to 0.8896 high. There was also a break below a connecting bullish trend line with support near 0.8860 on the hourly chart.
The pair is now trading below the 76.4% Fib retracement level of the upward move from the 0.8832 swing low to 0.8896 high. On the downside, an initial support is near the 0.8835 level.
The next major support is near 0.8820. A downside break below the 0.8820 support might call for more downsides. In the stated case, the pair could decline towards the 0.8780 support level in the near term.
On the upside, an immediate resistance is near the 0.8880 level. The next major resistance for the bulls is near the 0.8900 level, above which the pair might test the 0.8940 resistance. Any more gains might send the pair towards the 0.9000 level.
This forecast represents FXOpen Companies opinion only, it should not be construed as an offer, invitation or recommendation in respect to FXOpen Companies products and services or as financial advice.
Trade global forex with the best ECN broker of 2021*.
Choose from 50+ forex markets 24/5.
Open your FXOpen account now or learn more about making your money go further with FXOpen.
* FXOpen International, best ECN broker of 2021, according to the IAFT

Be the first to comment