

GBP/USD is attempting a recovery wave above the 1.2000 resistance. GBP/JPY could rise further unless there is a downside break below the 160.50 support.
Important Takeaways for GBP/USD and GBP/JPY
· The British Pound is slowly moving higher above 1.2000 against the US Dollar.
· There was a break above a key bearish trend line with resistance near 1.1970 on the hourly chart of GBP/USD.
· GBP/JPY started a fresh increase above the 160.00 resistance zone.
· There was a break above a key bearish trend line with resistance near 161.10 on the hourly chart.
GBP/USD Technical Analysis
This past week, the British Pound extended its decline below the 1.2000 support against the US Dollar. The GBP/USD pair even traded below the 1.1950 level and traded towards 1.1920.
The pair traded as low as 1.1912 on FXOpen and recently started a minor upside correction. There was a clear move above the 1.1950 resistance and the 50 hourly simple moving average. The pair even cleared the 23.6% Fib retracement level of the downward move from the 1.2268 swing high to 1.1915 low.
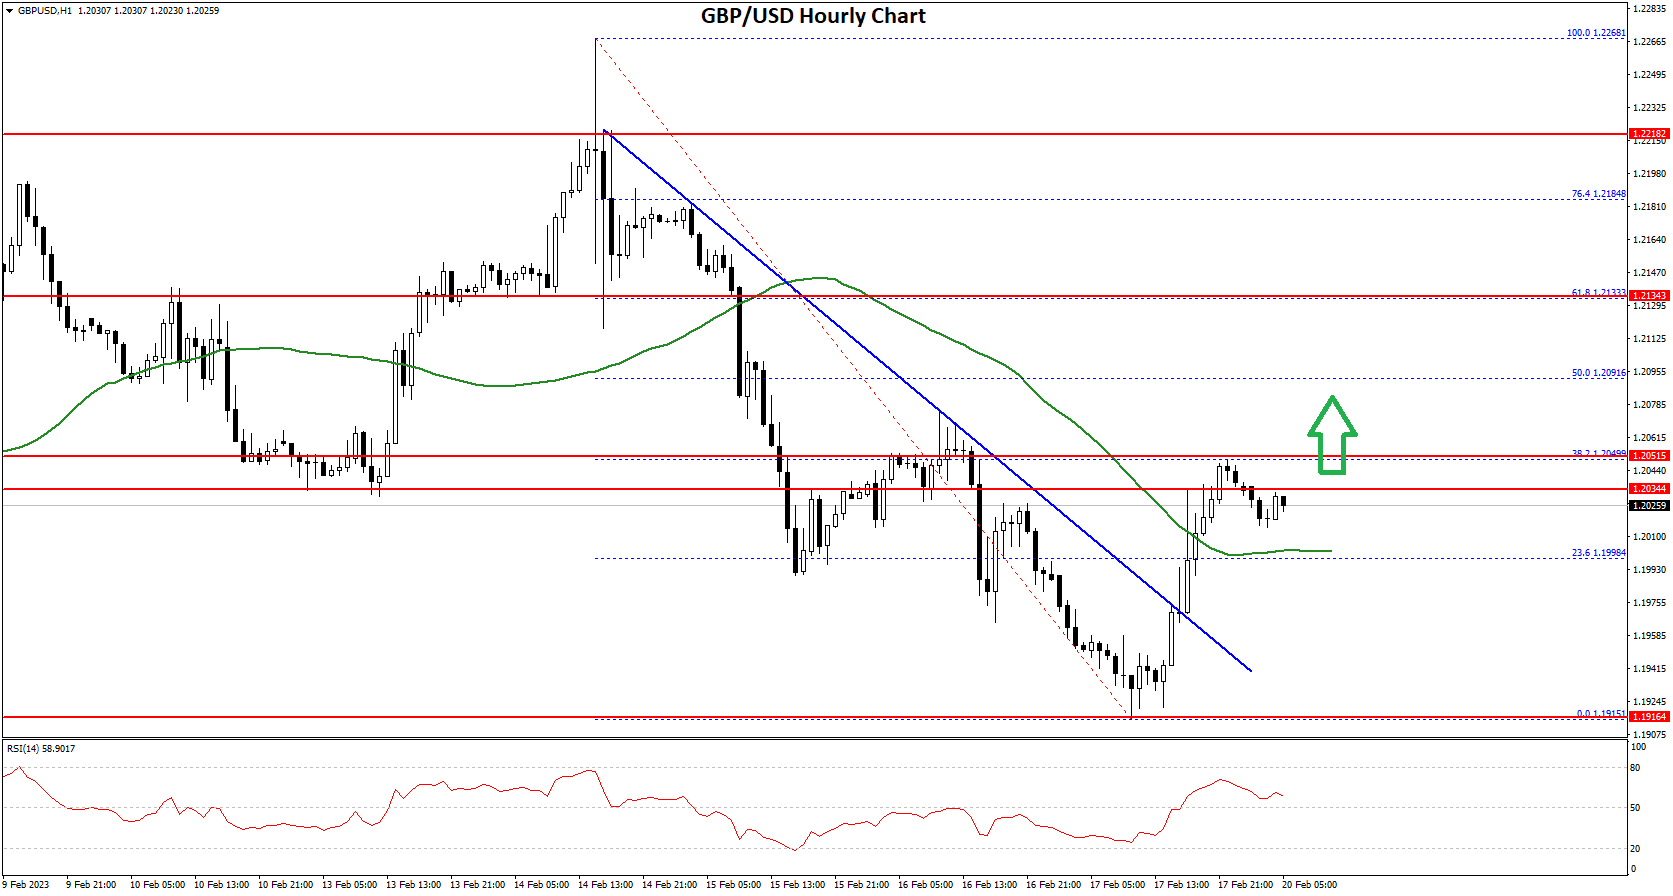
It is now trading near the 1.2020 zone. An immediate resistance on the upside is near the 1.2050 level. It is near the 50% Fib retracement level of the downward move from the 1.2268 swing high to 1.1915 low.
The next major resistance is near the 1.2100 level, above which the pair could start a steady increase towards 1.2150. An upside break above 1.2150 might start a fresh increase towards 1.2200. Any more gains might call for a move towards 1.2250 or even 1.2320.
An immediate support is near the 1.2000 and the 50 hourly simple moving average. The next major support is near the 1.1950 level. If there is a break below the 1.1950 support, the pair could test the 1.1910 support. Any more losses might send GBP/USD towards 1.1840.
GBP/JPY Technical Analysis
The British Pound started a fresh increase from the 157.50 zone against the Japanese Yen. The GBP/JPY pair gained pace for a move above the 158.50 and 160.00 resistance levels.
There was also a close above the 160.00 level and the 50 hourly simple moving average. The pair traded as high as 162.17 before there was a downside correction. The pair traded below the 161.50 level and traded as low as 160.46.
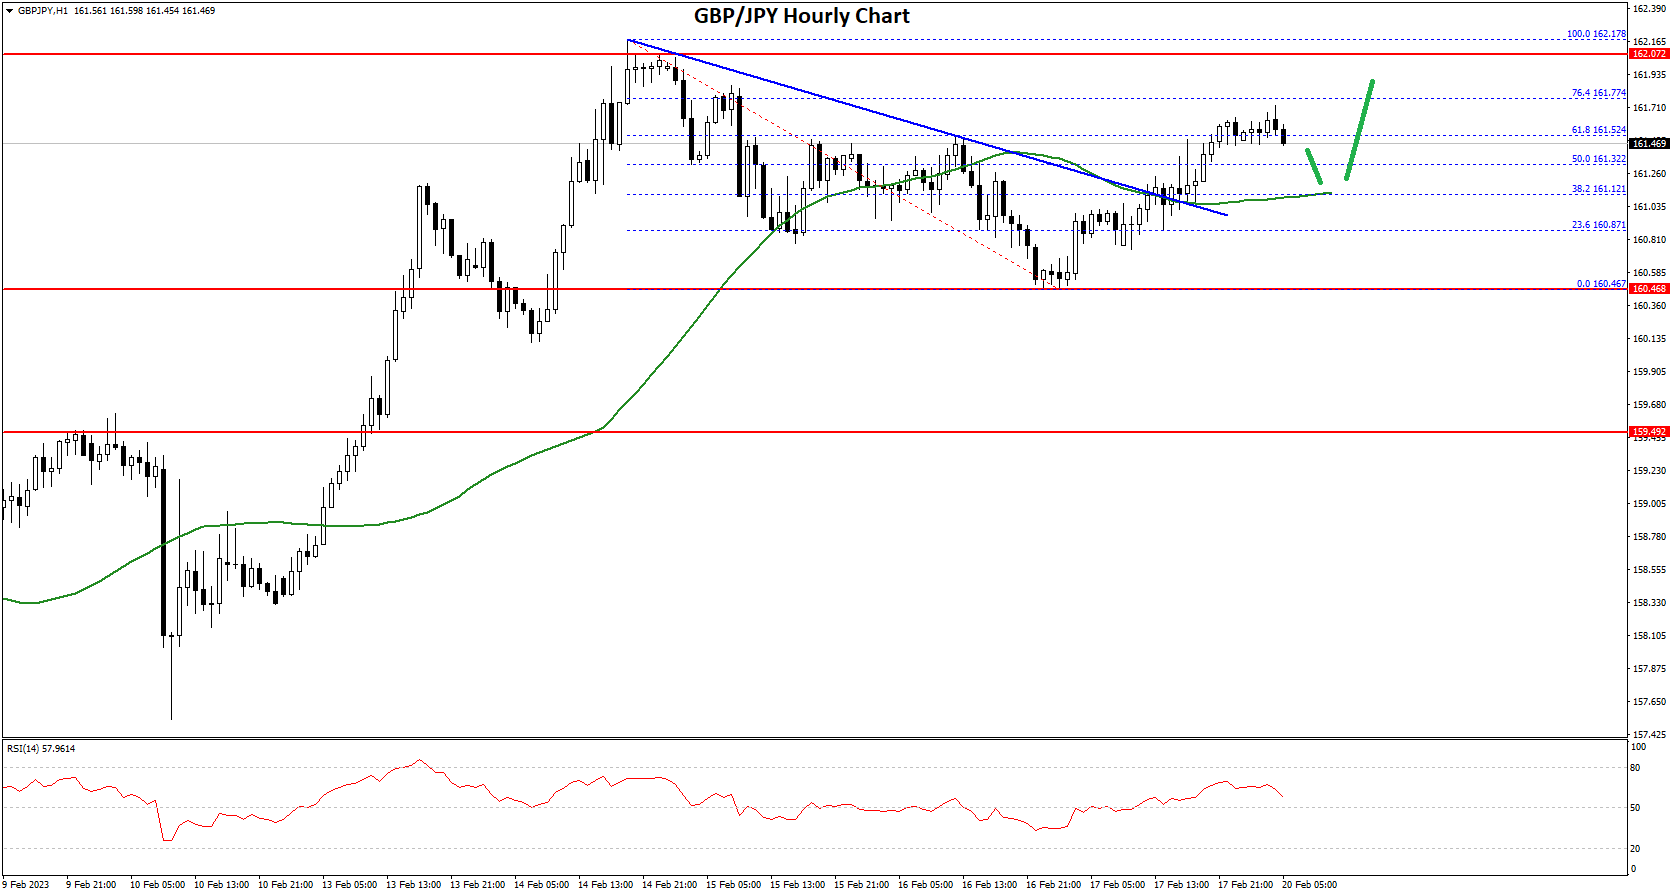
It is now rising and trading above the 50% Fib retracement level of the recent decline from the 162.17 swing high to 160.47 low. There was also a break above a key bearish trend line with resistance near 161.10 on the hourly chart.
An immediate resistance on the upside is near the 161.75 zone. It is near the 76.4% Fib retracement level of the recent decline from the 162.17 swing high to 160.47 low.
The next key resistance could be 162.20. A clear break above the 162.20 resistance could push the pair towards the 163.00 resistance. If not, the pair might decline below the 161.30 level.
On the downside, an initial support is near the 161.00 level. The next major support is near the 160.40. If there is a downside break below the 160.40 support, the pair could decline towards the 160.00 support zone in the coming sessions. Any more losses might call for a test of the 159.20 support zone.
This forecast represents FXOpen Companies opinion only, it should not be construed as an offer, invitation or recommendation in respect to FXOpen Companies products and services or as financial advice.
Trade global forex with the best ECN broker of 2021*.
Choose from 50+ forex markets 24/5.
Open your FXOpen account now or learn more about making your money go further with FXOpen.
* FXOpen International, best ECN broker of 2021, according to the IAFT

Be the first to comment