

GBP/USD started a downside correction from the 1.2400 zone. EUR/GBP climbed higher above the 0.8750 and 0.8780 resistance levels.
Important Takeaways for GBP/USD and EUR/GBP
· The British Pound started a fresh decline from the 1.2400 resistance against the US Dollar.
· There is a key bearish trend line forming with resistance near 1.2090 on the hourly chart of GBP/USD.
· EUR/GBP started a decent increase above the 0.8720 and 0.8750 resistance levels.
· There is a connecting bullish trend line forming with support near 0.8765 on the hourly chart.
GBP/USD Technical Analysis
The British Pound faced a strong selling interest near the 1.2400 zone against the US Dollar. The GBP/USD pair formed a short-term top near 1.2400 and started a downside correction.
There was a clear move below the 1.2320 and 1.2280 support levels. The pair even declined below the 1.2120 level and the 50 hourly simple moving average. It traded as low as 1.1991 on FXOpen and is currently correcting losses.
Recently, there was a minor upside correction above the 1.2040 level. There was a clear move above the 1.2050 level. It is now approaching the 50% Fib retracement level of the downward move from the 1.2147 swing high to 1.1991 low.
On the upside, an initial resistance is near the 1.2080 level. There is also a key bearish trend line forming with resistance near 1.2090 on the hourly chart of GBP/USD.
The trend line is near the 61.8% Fib retracement level of the downward move from the 1.2147 swing high to 1.1991 low. The next main resistance is near the 1.2100 zone. A clear upside break above the 1.2100 and 1.2120 resistance levels could open the doors for a steady increase in the near term.
The next major resistance sits near the 1.2200 level. On the downside, an initial support is near the 1.2020 level, below which it could test the 1.2000 support.
The next major support is near the 1.1960 level. Any more losses could lead the pair towards the 1.1900 support zone.
EUR/GBP Technical Analysis
The Euro started a steady fresh increase from the 0.8650 support zone against the British Pound. The EUR/GBP pair climbed above the 0.8700 zone to move into a bullish zone.
The pair even traded above the 0.8750 level and the 50 hourly simple moving average. Finally, there was a move above the 0.8800 level. The pair traded as high as 0.8833 and is currently correcting gains. There was a minor decline below the 0.8810 level.
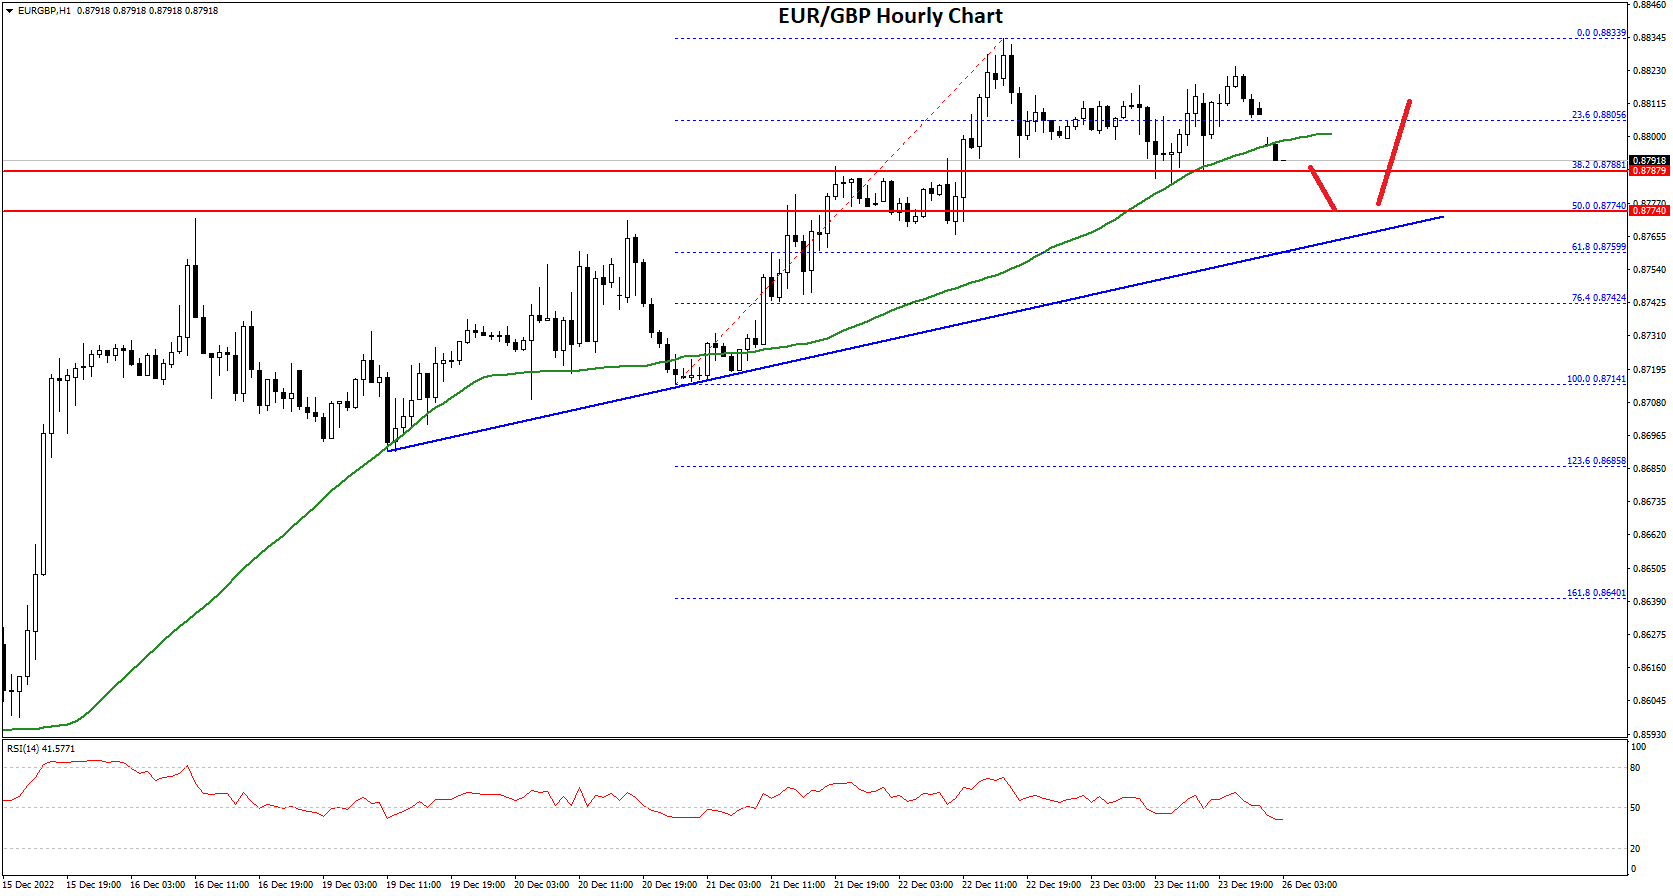
The pair declined below the 23.6% Fib retracement level of the upward move from the 0.8714 swing low to 0.8833 high. On the downside, an initial support is near the 0.8775 level.
There is also a connecting bullish trend line forming with support near 0.8765 on the hourly chart. The trend line is near the 50% Fib retracement level of the upward move from the 0.8714 swing low to 0.8833 high.
The next major support is near 0.8740. A downside break below the 0.8740 support might call for more downsides. In the stated case, the pair could decline towards the 0.8700 support level in the near term.
On the upside, an immediate resistance is near the 0.8810 level. The next major resistance for the bulls is near the 0.8840 level, above which the pair might test the 0.8880 resistance. Any more gains might send the pair towards the 0.8920 level.
This forecast represents FXOpen Companies opinion only, it should not be construed as an offer, invitation or recommendation in respect to FXOpen Companies products and services or as financial advice.
Trade global forex with the best ECN broker of 2021*.
Choose from 50+ forex markets 24/5.
Open your FXOpen account now or learn more about making your money go further with FXOpen.
* FXOpen International, best ECN broker of 2021, according to the IAFT

Be the first to comment