

koto_feja/E+ via Getty Images
The Chart of the Day belongs to the central nervous system treatment company Relmada Therapeutics (RLMD). I found the stock by sorting Barchart’s Bullish Moving Average watchlist by the closest to its 52 week high then used the Flipchart feature to review the charts for consistent price appreciation.
This watchlist helps you find today’s best stocks with bullish short, medium, and long-term moving average patterns. These large-cap stocks (greater than 300M) have a 20-day moving average greater than the 50-day moving average, and a 50-day moving average greater than the 100-day moving average. When price is above a moving average, it signals an uptrend. In addition, these stocks have a TrendSpotter “Buy” signal, are within 20% of their 52-week high, and have a 20-day average volume greater than 25,000. These additional filters were added to showcase the best bullish moving average stocks.
TIP: Using FlipCharts, apply your own chart template with a 20, 50, and 100-day moving average to further analyze this group of stocks.
Since the Trend Spotter signaled a buy in 9/27 the stock gained 2.77%.
RLMD Price vs Daily Moving Averages ( )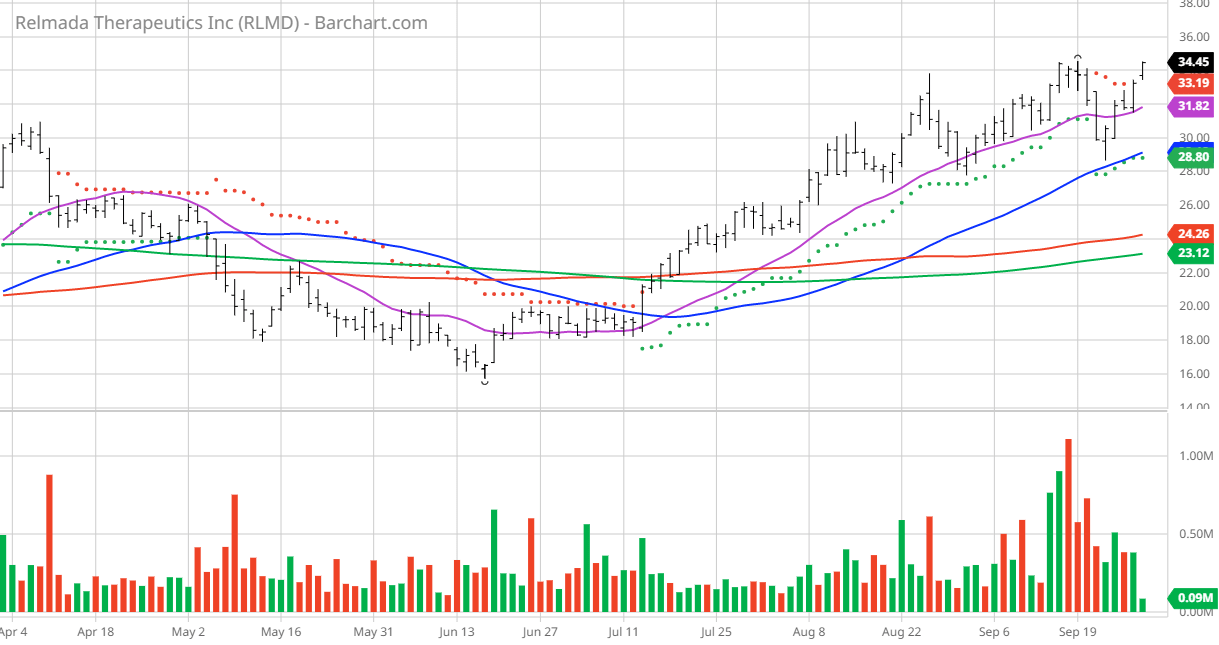
Relmada Therapeutics, Inc., a clinical-stage biotechnology company, focuses on developing various products for the treatment of central nervous system (CNS) diseases and other disorders. Its lead product candidate is Esmethadone (d-methadone, dextromethadone, and REL-1017), a new chemical entity and N-methyl-D-aspartate receptor antagonist that is in Phase 3 clinical trials for the adjunctive or monotherapy treatment of major depressive disorder in adults. The company was founded in 2004 and is headquartered in Coral Gables, Florida.
Barchart’s Opinion Trading systems are listed below. Please note that the Barchart Opinion indicators are updated live during the session every 20 minutes and can therefore change during the day as the market fluctuates. The indicator numbers shown below therefore may not match what you see live on the Barchart.com website when you read this report.
Barchart Technical Indicators:
- 100% technical buy signals but increasing
- 55.90+ Weighted Alpha
- 31.97% gain in the last year
- Trend Spotter buy signal
- Above its 20, 50 and 100 day moving averages
- 8 new highs and up 15.55% in the last month
- Relative Strength Index 61.58%
- Technical support level at 32.01
- Recently traded at 34.41 with 50 day moving average of 29.12
Fundamental factors:
- Market Cap $999 million
- On this stock Wall Street Analysts do not give revenue projections
- Earnings projections are an increase of 21.10% this year and another 20.30% next year
Analysts and Investor Sentiment — I don’t buy stocks because everyone else is buying but I do realize that if major firms and investors are dumping a stock it’s hard to make money swimming against the tide:
- Wall Street analysts have 7 strong buy opinions on the stock
- Analysts price targets from 42.00 to 90.00 with an average of 66.00
- The individual investors following stocks on Motley Fool disagree and voted 7 to 9 that the stock will not beat the market and the more experienced investors vote the same with a 1 to 4 vote
- 1,670 investors are monitoring the stock on Seeking Alpha
Ratings Summary
Factor Grades
Quant Ranking
Sector
Industry
Ranked Overall
Ranked in Sector
Ranked in Industry
Be the first to comment