

GBP/USD started a recovery wave and climbed above the 1.1750 resistance. EUR/GBP is trading above the 0.8700 support and might eye a fresh increase.
Important Takeaways for GBP/USD and EUR/GBP
· The British Pound started a fresh increase after it broke the 1.1550 resistance against the US Dollar.
· There is a key bullish trend line forming with support near 1.1780 on the hourly chart of GBP/USD.
· EUR/GBP started a decent increase and remained well bid above the 0.8700 support.
· There is a major bearish trend line forming with resistance near 0.8765 on the hourly chart.
GBP/USD Technical Analysis
The British Pound found support near the 1.1350 zone against the US Dollar. The GBP/USD pair started a recovery wave and was able to clear the 1.1550 resistance zone.
There was a decent increase above the 1.1650 level and the 50 hourly simple moving average. The pair even climbed above the 1.1750 level. A high was formed near 1.1852 on FXOpen and the pair is now consolidating gains.
On the downside, an initial support is near the 1.1780 level. There is also a key bullish trend line forming with support near 1.1780 on the hourly chart of GBP/USD, below which it could test the 23.6% Fib retracement level of the upward move from the 1.1334 swing low to 1.1852 high.
The next major support is near the 1.1650 level and the 50 hourly simple moving average. Any more losses could lead the pair towards the 1.1600 support zone or the 50% Fib retracement level of the upward move from the 1.1334 swing low to 1.1852 high.
On the upside, an initial resistance is near the 1.1820 level. The next main resistance is near the 1.1850 zone. A clear upside break above the 1.1820 and 1.1850 resistance levels could open the doors for a steady increase in the near term. The next major resistance sits near the 1.2000 level.
EUR/GBP Technical Analysis
The Euro started a steady increase from the 0.8700 zone against the British Pound. The EUR/GBP pair was able to clear the 0.8720 resistance zone to move into a positive zone.
The pair even traded above the 0.8740 level and the 50 hourly simple moving average. The bulls were able to push the pair above the 38.2% Fib retracement level of the downward move from the 0.8828 swing high to 0.8700 low.
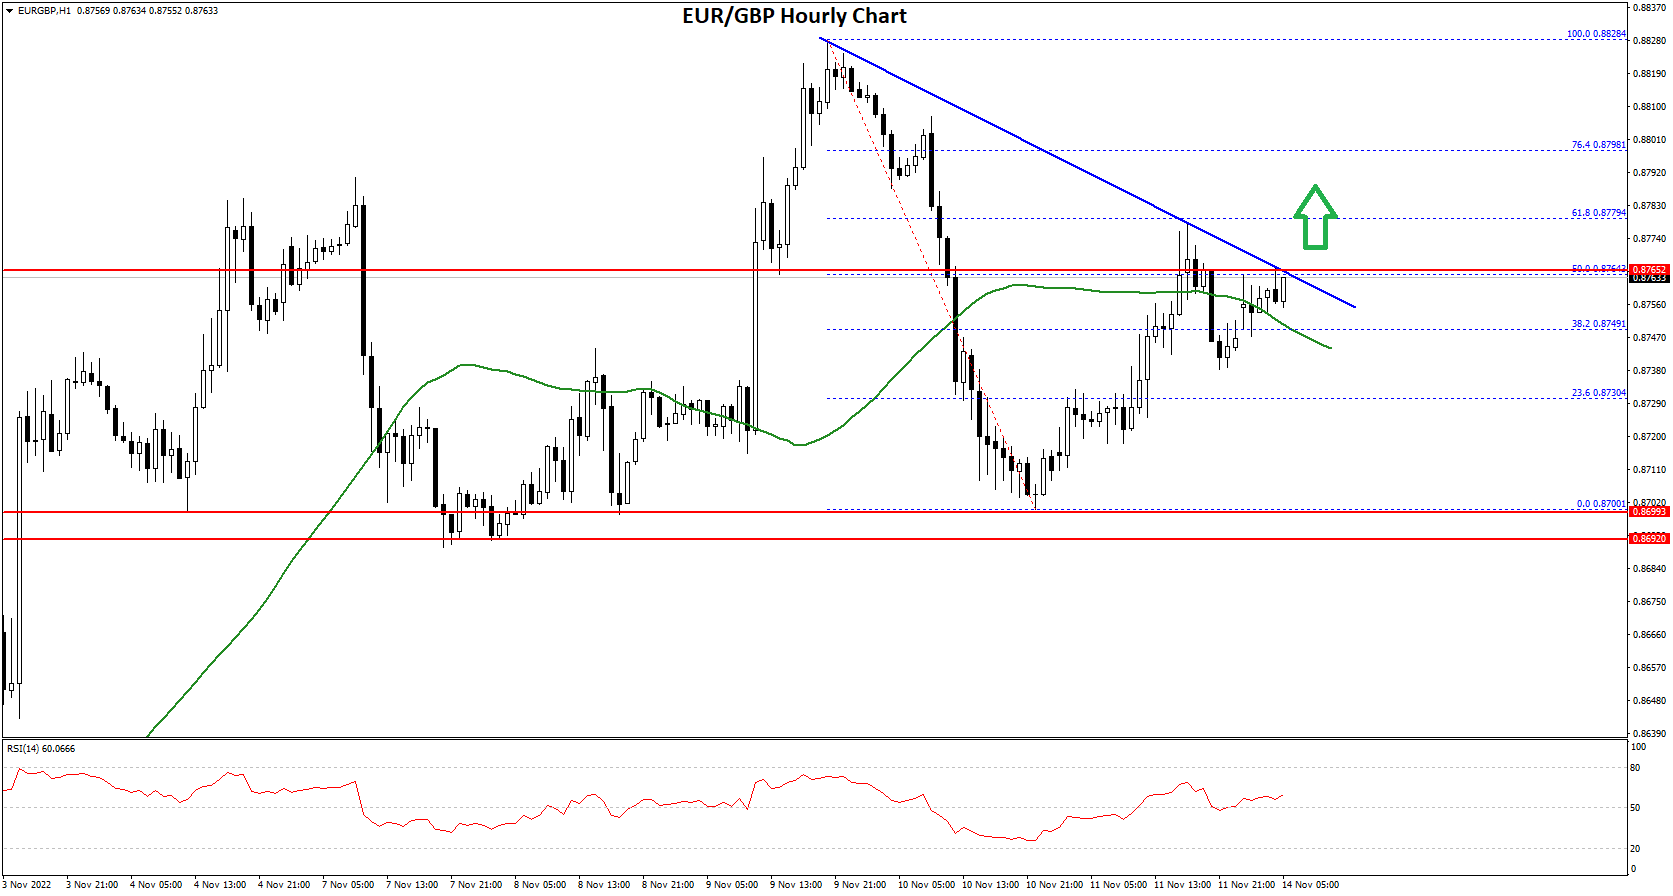
On the upside, an immediate resistance is near the 0.8765 level. There is also a major bearish trend line forming with resistance near 0.8765 on the hourly chart.
The trend line is near the 50% Fib retracement level of the downward move from the 0.8828 swing high to 0.8700 low. The next major resistance for the bulls is near the 0.8780 level. A clear move above the 0.8780 resistance might push the price higher towards the 0.8840 level.
On the downside, an initial support is near the 0.8745 level. The next major support is near 0.8700. A downside break below the 0.8700 support might call for more downsides. In the stated case, the pair could decline towards the 0.8640 support level in the near term.
This forecast represents FXOpen Companies opinion only, it should not be construed as an offer, invitation or recommendation in respect to FXOpen Companies products and services or as financial advice.
Trade global forex with the best ECN broker of 2021*.
Choose from 50+ forex markets 24/5.
Open your FXOpen account now or learn more about making your money go further with FXOpen.
* FXOpen International, best ECN broker of 2021, according to the IAFT

Be the first to comment