

GBP/USD started a fresh decline from the 1.2320 resistance zone. GBP/JPY declined and remains at a risk of more losses below 162.00.
Important Takeaways for GBP/USD and GBP/JPY
· The British Pound started a fresh decline after it failed near 1.2320 against the US Dollar.
· There is a major bearish trend line forming with resistance near 1.2120 on the hourly chart of GBP/USD.
· GBP/JPY declined steadily after it failed to clear the 167.00 resistance zone.
· There is a key bearish trend line forming with resistance near 164.25 on the hourly chart.
GBP/USD Technical Analysis
This past week, the British Pound attempted an upside break above the 1.2320 resistance against the US Dollar. The GBP/USD pair failed to gain bullish momentum and started a fresh decline from the 1.2200 zone.
There was a sharp decline below the 1.2150 support and the 50 hourly simple moving average. The pair even traded below the 1.2000 support zone. A low was formed near 1.1975 on FXOpen before the pair started a recovery wave.
The pair climbed above the 1.2050 resistance zone. It even broke the 50% Fib retracement level of the downward move from the 1.2188 swing high to 1.1975 low.
On the upside, the pair is facing resistance near the 1.2110 level. It is near the 61.8% Fib retracement level of the downward move from the 1.2188 swing high to 1.1975 low. There is also a major bearish trend line forming with resistance near 1.2120 on the hourly chart of GBP/USD.
An upside break above 1.2120 could set the pace for a move towards the 1.2200 resistance zone. If there is no upside break above 1.2120, the pair could start a fresh decline.
An immediate support is near the 1.2050. The next major support is near the 1.2000 level. If there is a break below the 1.2000 support, the pair could test the 1.1920 support.
GBP/JPY Technical Analysis
The British Pound also started a fresh decline from the 167.00 zone against the Japanese Yen. The GBP/JPY pair gained pace below the 167.00 and 166.50 support levels.
There was a clear move below the 165.00 level and the 50 hourly simple moving average. The pair even declined below 162.00 support and traded as low as 161.56. It is now correcting higher above the 162.00 pivot level.
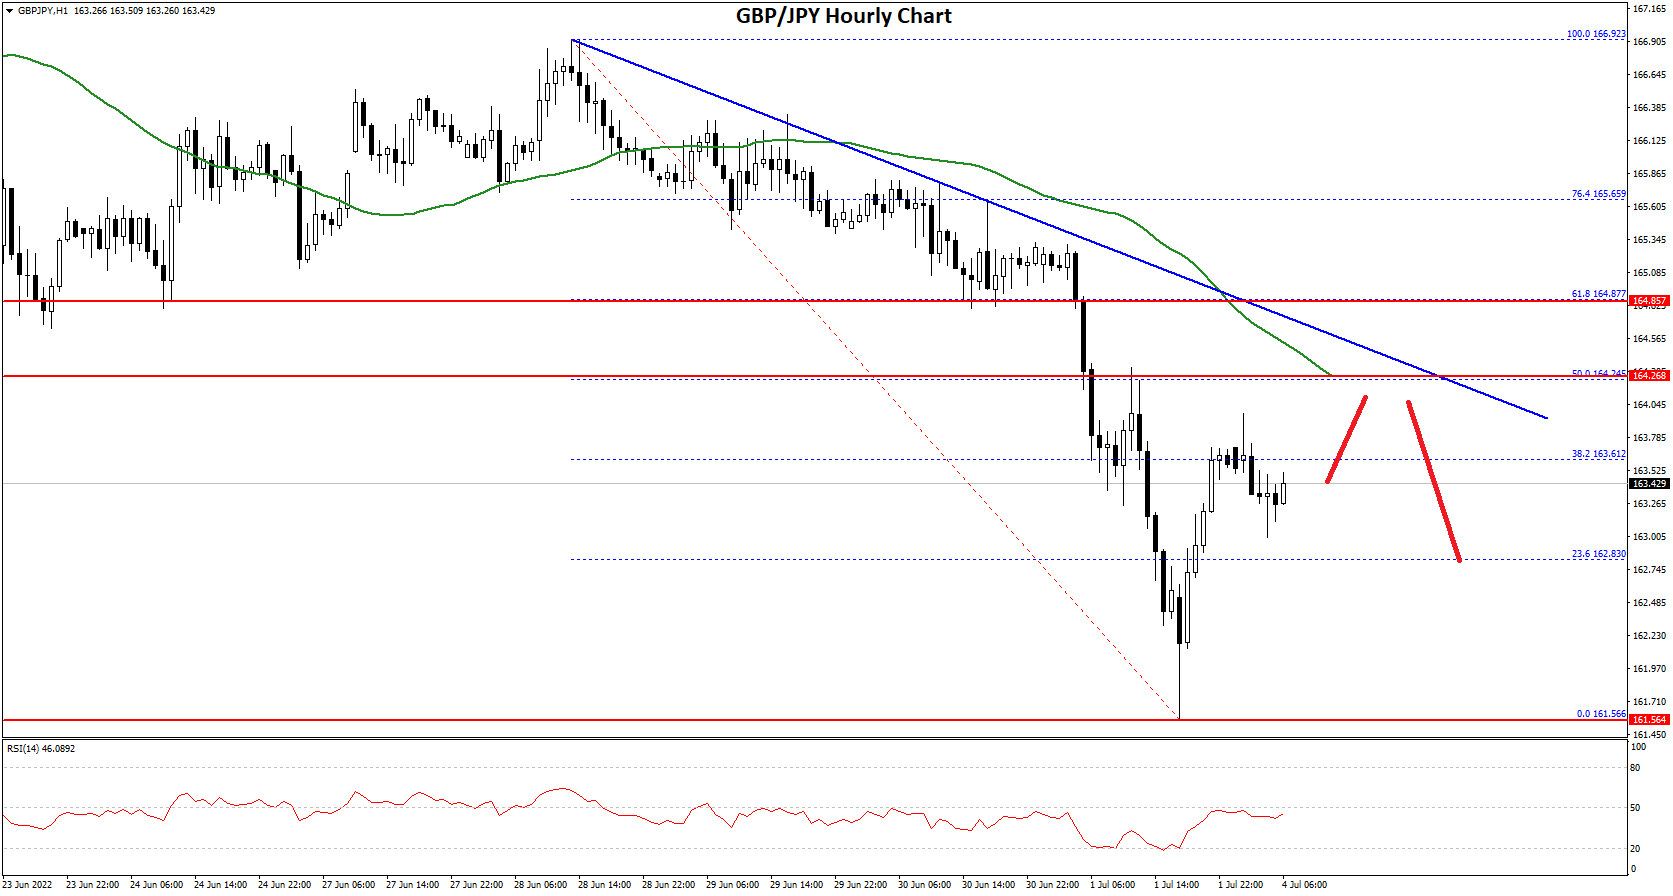
The pair climbed above the 23.6% Fib retracement level of the downward move from the 166.92 swing high to 161.56 low. On the upside, GBP/JPY is facing resistance near the 163.60 level.
The next key resistance could be 164.20 and the 50 hourly simple moving average. There is also a key bearish trend line forming with resistance near 164.25 on the hourly chart. The trend line is near the 50% Fib retracement level of the downward move from the 166.92 swing high to 161.56 low.
A clear break above the 164.25 resistance could push the pair towards the 165.00 resistance. On the downside, an initial support is near the 162.80 level.
The next major support is near the 162.00. If there is a downside break below the 162.00 support, the pair could decline towards the 161.50 support zone. Any more losses might send the pair towards the 160.00 level in the near term.
This forecast represents FXOpen Markets Limited opinion only, it should not be construed as an offer, invitation or recommendation in respect to FXOpen Markets Limited products and services or as financial advice.

Be the first to comment