

GBP/USD declined heavily below the 1.3600 and 1.3550 support levels. GBP/JPY also declined below 154.00 and is currently struggling to recover.
Important Takeaways for GBP/USD and GBP/JPY
· The British Pound started a major decline below the 1.3600 support against the US Dollar.
· There is a major bearish trend line forming with resistance near 1.3625 on the hourly chart of GBP/USD.
· GBP/JPY declined heavily below the 154.60 and 154.00 support levels.
· There is a key declining channel forming with resistance near 153.20 on the hourly chart.
GBP/USD Technical Analysis
This past week, the British Pound started a major decline from well above 1.3650 against the US Dollar. The GBP/USD pair broke the 1.3620 and 1.3600 support levels.
The pair even settled below the 1.3550 level and the 50 hourly simple moving average. Finally, there was a spike below the 1.3500 support zone. It traded as low as 1.3423 on FXOpen and is currently consolidating losses.
The pair is now facing resistance near 1.3485. It is near the 23.6% Fib retracement level of the recent decline from the 1.3697 swing high to 1.3423 low.
The first key resistance is near the 1.3500 zone. The next major resistance is near the 1.3550 level. It is near the 50% Fib retracement level of the recent decline from the 1.3697 swing high to 1.3423 low.
There is also a major bearish trend line forming with resistance near 1.3625 on the hourly chart of GBP/USD. A close above the 1.3625 level could open the doors for more gains. The next major hurdle is near 1.3660 and the 50 hourly SMA, above which the pair could surge towards 1.3700.
On the downside, an immediate support is near the 1.3450 level. The next major support is near the 1.3425 level. If there is a break below the 1.3425 support, the pair could test the 1.3400 support. If there are additional losses, the pair could decline towards the 1.3350 level.
GBP/JPY Technical Analysis
The British Pound also started a major decline from well above 155.50 against the Japanese Yen. The GBP/JPY pair broke the 155.00 support zone to move into a bearish zone.
The pair declined below the 154.60 support level and the 50 hourly simple moving average. Finally, there was a break below the 153.80 support level. It traded as low as 152.81 and is currently consolidating losses.
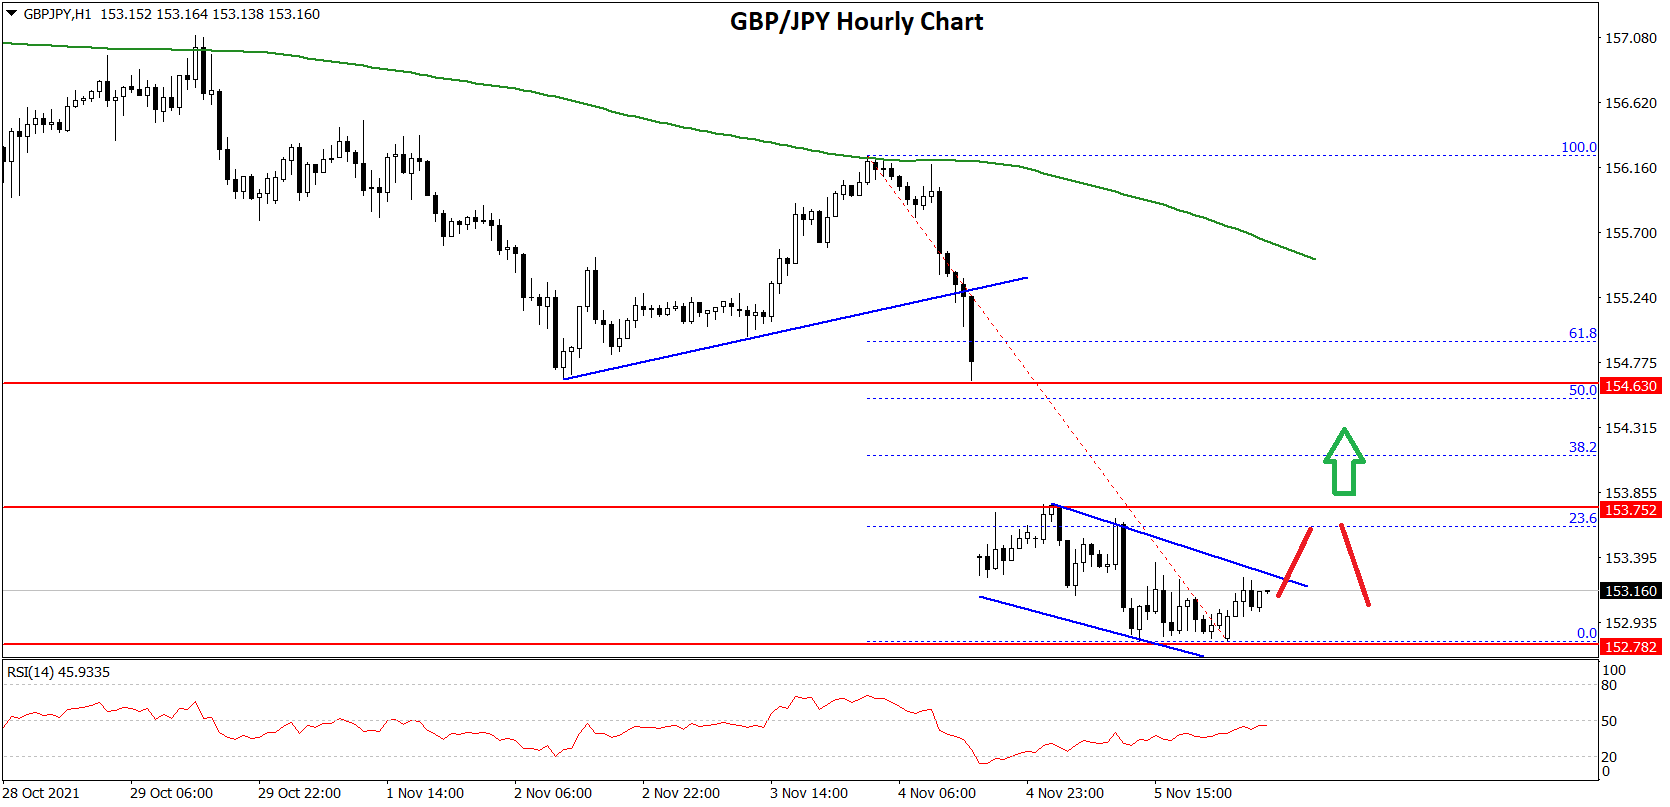
An initial resistance is near the 153.25 level. There is also a key declining channel forming with resistance near 153.20 on the hourly chart.
The first major resistance is near the 153.70 level. It is near the 23.6% Fib retracement level of the recent decline from the 156.24 high to 152.81 low. A clear break above the 153.70 level could send the pair towards the 154.60 resistance.
The 50% Fib retracement level of the recent decline from the 156.24 high to 152.81 low is also near the 154.60 level. If there is no upside break, the pair could move down below the 153.00 support.
The next major support is near the 152.80 level. Any more downsides may possibly spark a major decline below 152.00. The next key support is near the 151.20 level.
This forecast represents FXOpen Markets Limited opinion only, it should not be construed as an offer, invitation or recommendation in respect to FXOpen Markets Limited products and services or as financial advice.

Be the first to comment