

GBP/USD started a steady increase above the 1.3700 resistance. EUR/GBP is consolidating gains above the 0.8550 support zone.
Important Takeaways for GBP/USD and EUR/GBP
· The British Pound gained pace above the 1.3680 and 1.3700 resistance levels.
· There was a break above a key bearish trend line with resistance near 1.3720 on the hourly chart of GBP/USD.
· EUR/GBP started a decent increase and it settled above the 0.8550 pivot level.
· There is a major bullish trend line forming with support near 0.8565 on the hourly chart.
GBP/USD Technical Analysis
The British Pound formed a base above the 1.3620 zone against the US Dollar. As a result, the GBP/USD pair started a steady increase above the 1.3680 resistance zone.
The pair even broke the 1.3700 resistance and it settled above the 50 hourly simple moving average. There was also a break above a key bearish trend line with resistance near 1.3720 on the hourly chart of GBP/USD.
The pair is now struggling to clear the 1.3900 resistance barrier. A high is formed near 1.3780 level on FXOpen and the pair is consolidating gains.
There was a dip to the 23.6% Fib retracement level of the upward move from the 1.3679 swing low to 1.3780 high. The first key support is near the 1.3730 level and the 50 hourly simple moving average.
It is close to the 50% Fib retracement level of the upward move from the 1.3679 swing low to 1.3780 high. Any more losses could lead the pair towards the 1.3680 support zone. On the upside, an immediate resistance is near the 1.3780 level.
The main resistance is near the 1.3800 zone. Therefore, a proper break above the 1.3900 resistance could open the doors for a steady increase. The next major resistance for the bulls could be 1.4000. An intermediate resistance is seen near the 1.3950 level.
EUR/GBP Technical Analysis
The Euro started a strong increase after it settled above the 0.8500 zone against the British Pound. The EUR/GBP pair cleared the 0.8550 resistance level.
Recently, there was a test of the 0.8585 resistance zone. The pair struggled to continue higher and a high was formed near 0.8588. It corrected lower below the 0.8565 and the 50 hourly simple moving average.
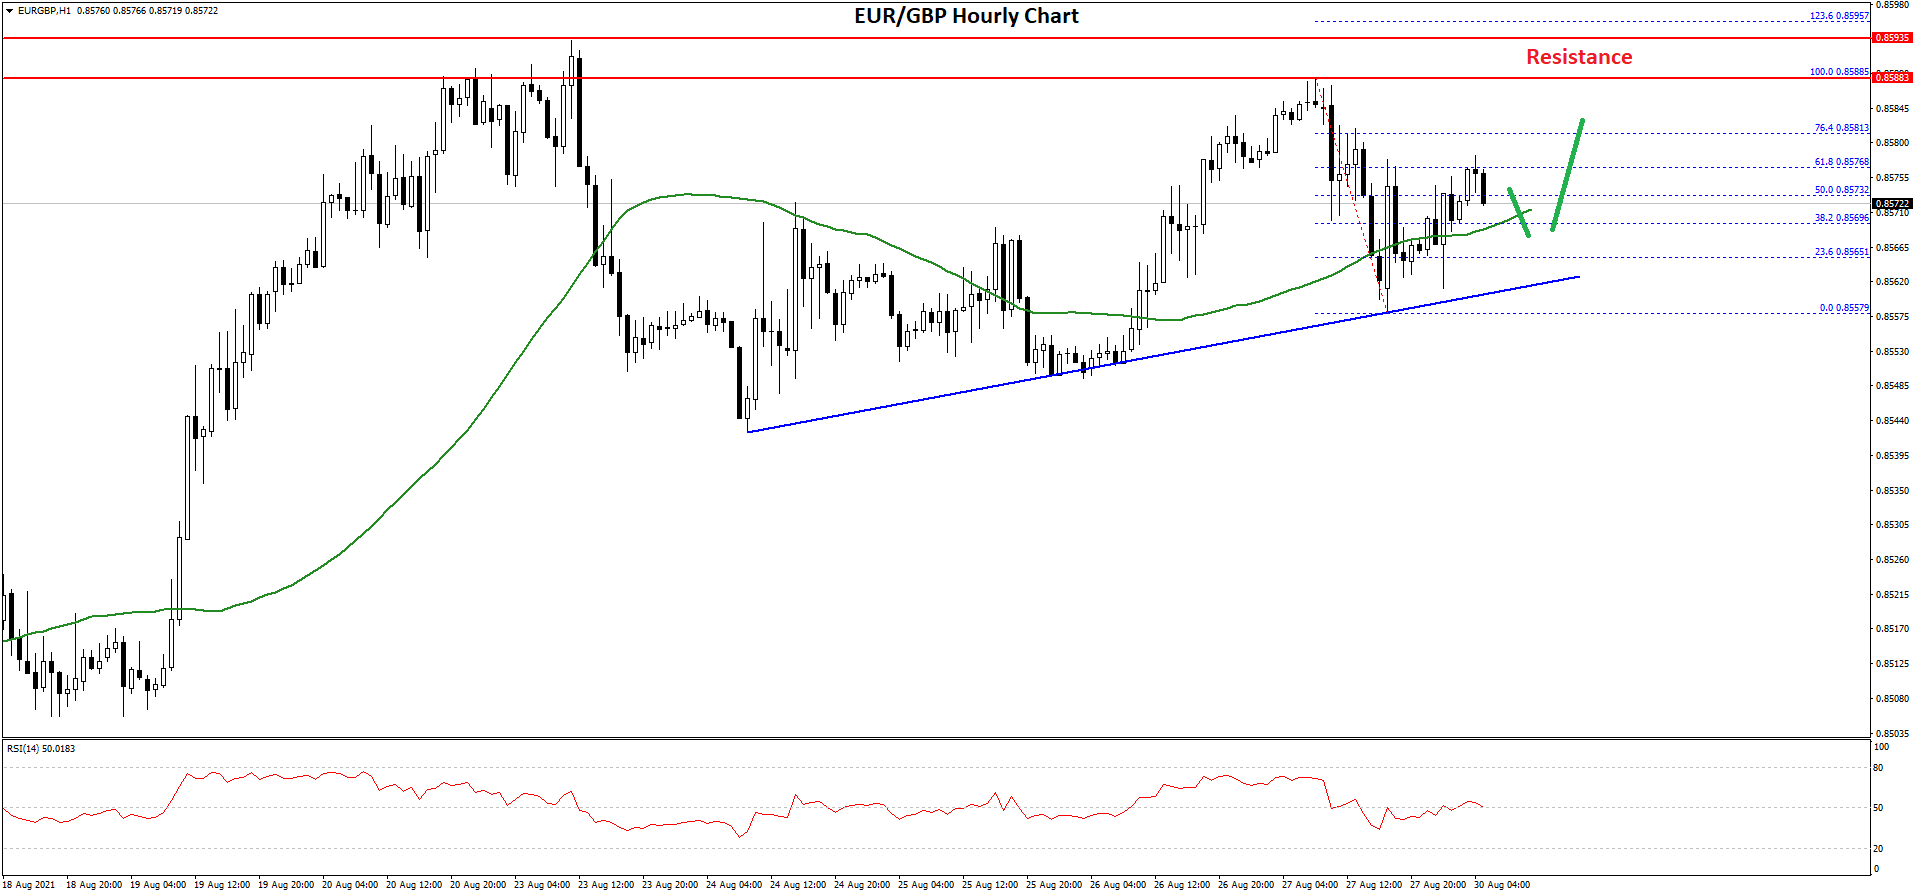
A low was formed near 0.8557 and the pair is now moving higher. It surpassed the 50% Fib retracement level of the downward move from the 0.8588 high to 0.8557 low.
An immediate resistance is near the 0.8580 level. It is close to the 76.4% Fib retracement level of the downward move from the 0.8588 high to 0.8557 low. The main resistance is near the 0.8588 and 0.8595 levels. A close above 0.8600 could the doors for another increase.
An initial support on the downside is near the 0.8570 level. There is also a major bullish trend line forming with support near 0.8565 on the hourly chart. The next major support is near 0.8550 level.
A downside break below the 0.8555 and 0.8550 support levels might call for more downsides. In the stated case, the pair could decline towards the 0.8520 support level in the near term.
This forecast represents FXOpen Markets Limited opinion only, it should not be construed as an offer, invitation or recommendation in respect to FXOpen Markets Limited products and services or as financial advice.

Be the first to comment