

RBA, RBNZ, Aussie Dollar Analysis
- RBA appears less hawkish after shock 25 bps hike in October
- Diverging pace of future rate hikes may leave AUD susceptible to the downside into year end
- AUD/NZD, AUD/USD price action setups analyzed
Recommended by Richard Snow
Get Your Free AUD Forecast
RBA Appears Less Hawkish after Shock 25 Bps Hike in October
The RBA shocked markets on the 4th of October when it decided to hike the target cash rate by a mere 25 basis points after 4 consecutive clips of 50 bps prior, citing sizeable frontloading. The rate setting committee did mention that further tightening is likely but will remain dependent on the data.
History of Recent RBA Rate Hikes
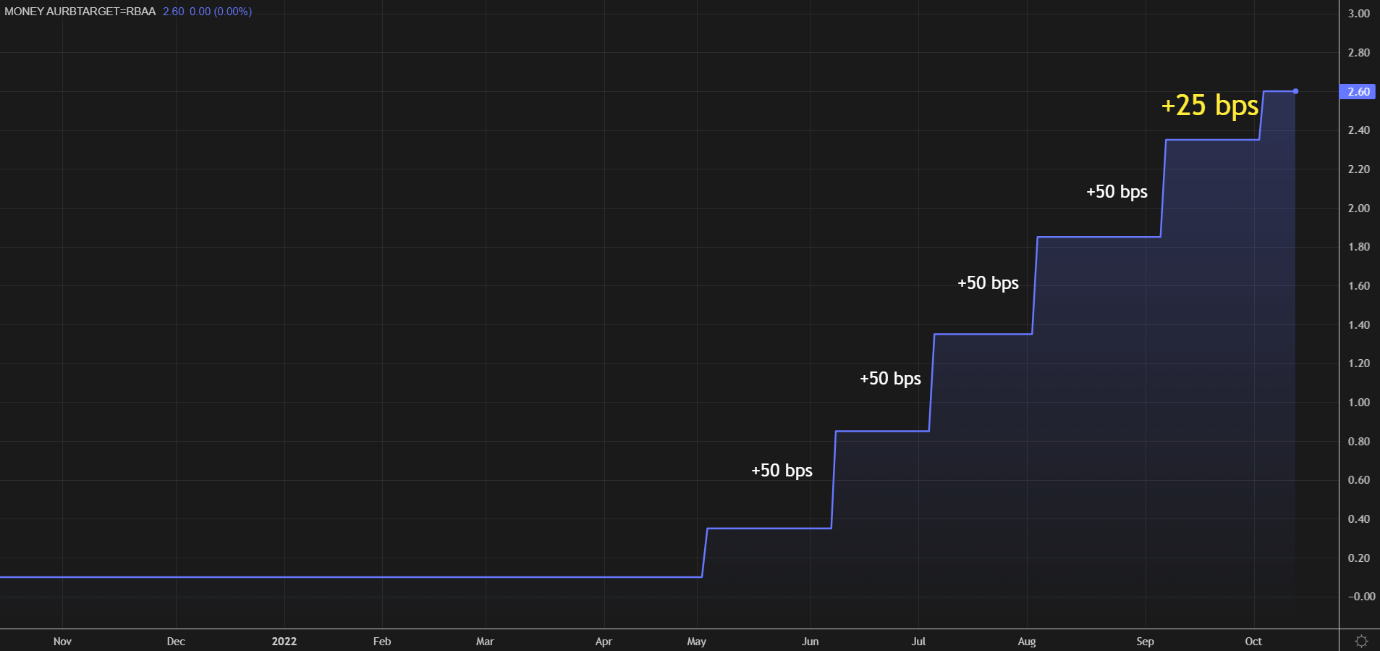
Source: Refinitiv
Speaking of data, earlier this morning Australian CPI printed higher than anticipated for Q3 (7.3% vs 7.1% exp) rising from Q2’s print of 6.1%.

Customize and filter live economic data via our DaliyFX economic calendar
The fact that inflation continues to rise suggests that rate hikes are still going to play a huge part in taming widespread price increases in the months to come but at what pace? The RBA pointed out that the Aussie dollar declined significantly against the dollar but maintains that on a trade weighted approach, the currency hovers around levels observed since the start of the year – suggesting that the Aussie dollar has retained its value rather well.
AUD Trade Weighted Index
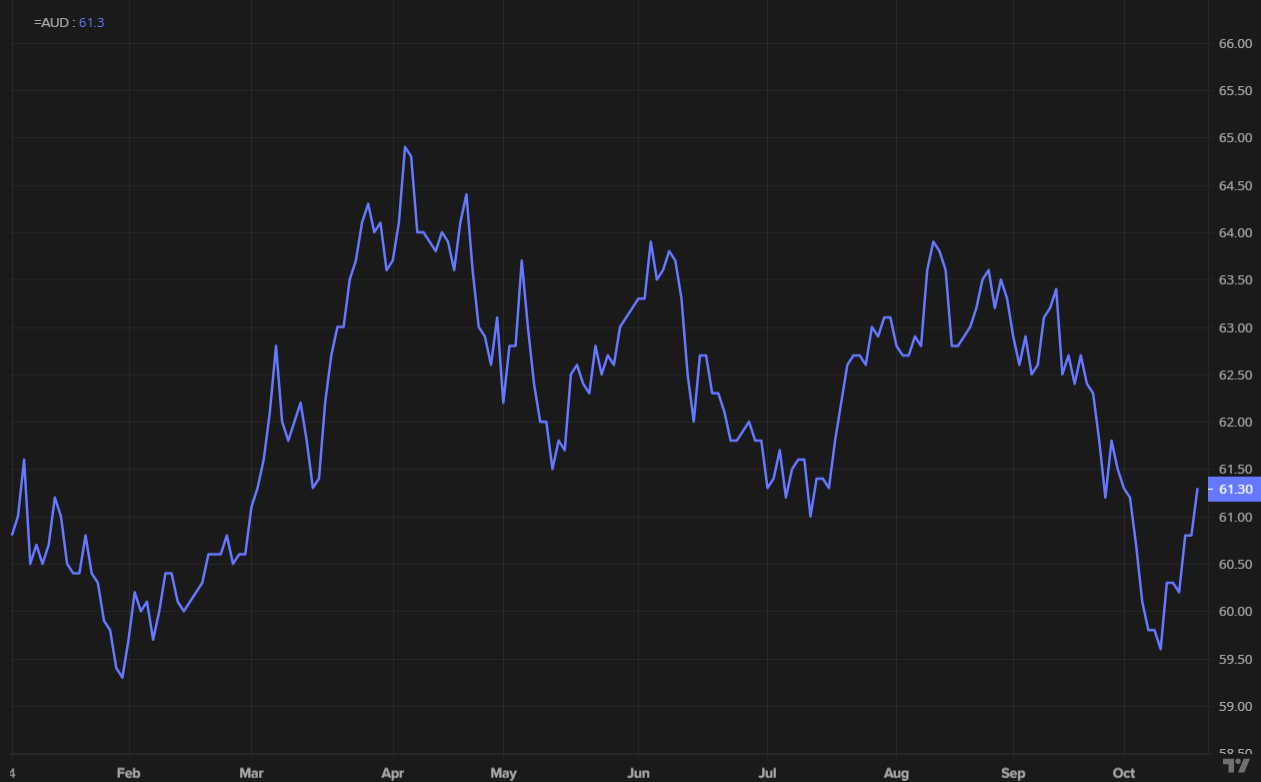
Source: Refinitiv, prepared by Richard Snow
With the RBA seemingly more focused on the trade weighted index of the Aussie dollar it would appear that there may be more scope for smaller rate hikes which will only widen the interest rate differential between the RBA and other major central banks, which tends to lead to AUD depreciation.
The chart below shows the gap between the RBA and RBNZ forecasted policy rates widening – opening up the potential for AUD/NZD declines in line with what was highlighted in last week’s analyst pick.
RBA vs RBNZ Divergence in Forecasted Policy Rates
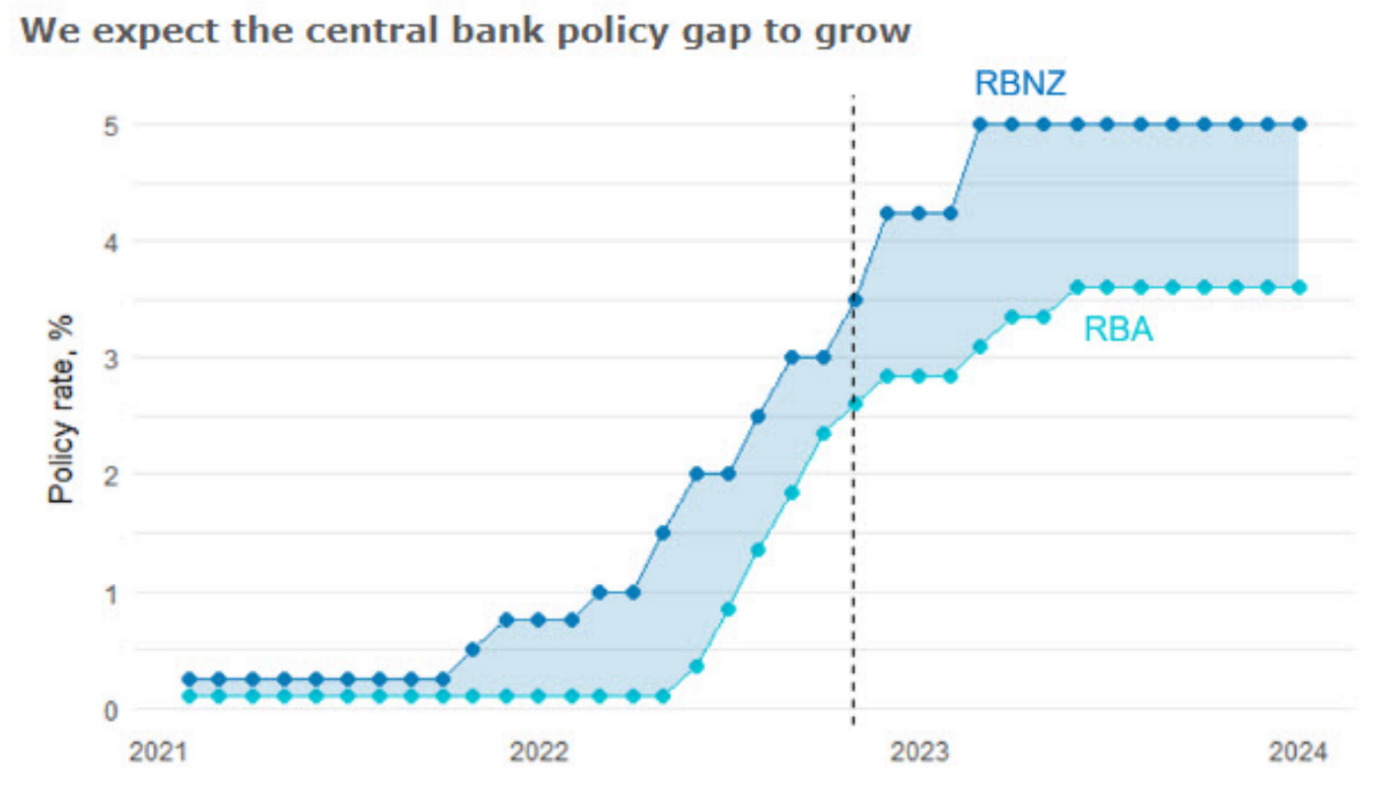
Source: Bloomberg, ANZ research
In addition, while inflation trends higher, Australian GDP and unemployment has held up fairly well. The chart below reveals that the unemployment rate is declining while GDP continues to moderate. While the RBA is cognizant of overtightening and forcing the economy into a recession, it would appear that there is still room for further tightening.
Australian GDP,CPI and Unemployment
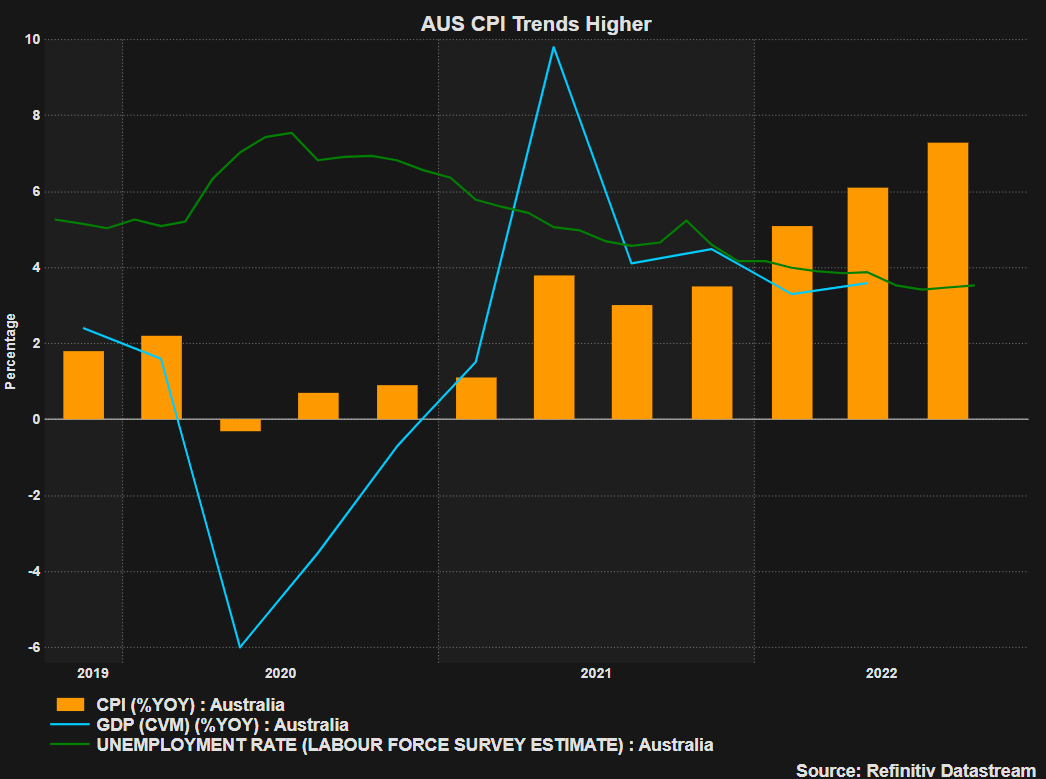
Source: TradingView, prepared by Richard Snow
Fundamentals Weigh on the Aussie Dollar
Despite the recent uptick in AUD, the currency actually grapples with a weakening economic outlook for its major trading partner China and lower prices of its top commodity export (iron ore). Iron ore has weakened while gold has shown somewhat of a resurgence on the back of a weaker dollar and possibility of slower U.S. rate hikes as mentioned earlier.
Iron Ore Daily Price Chart
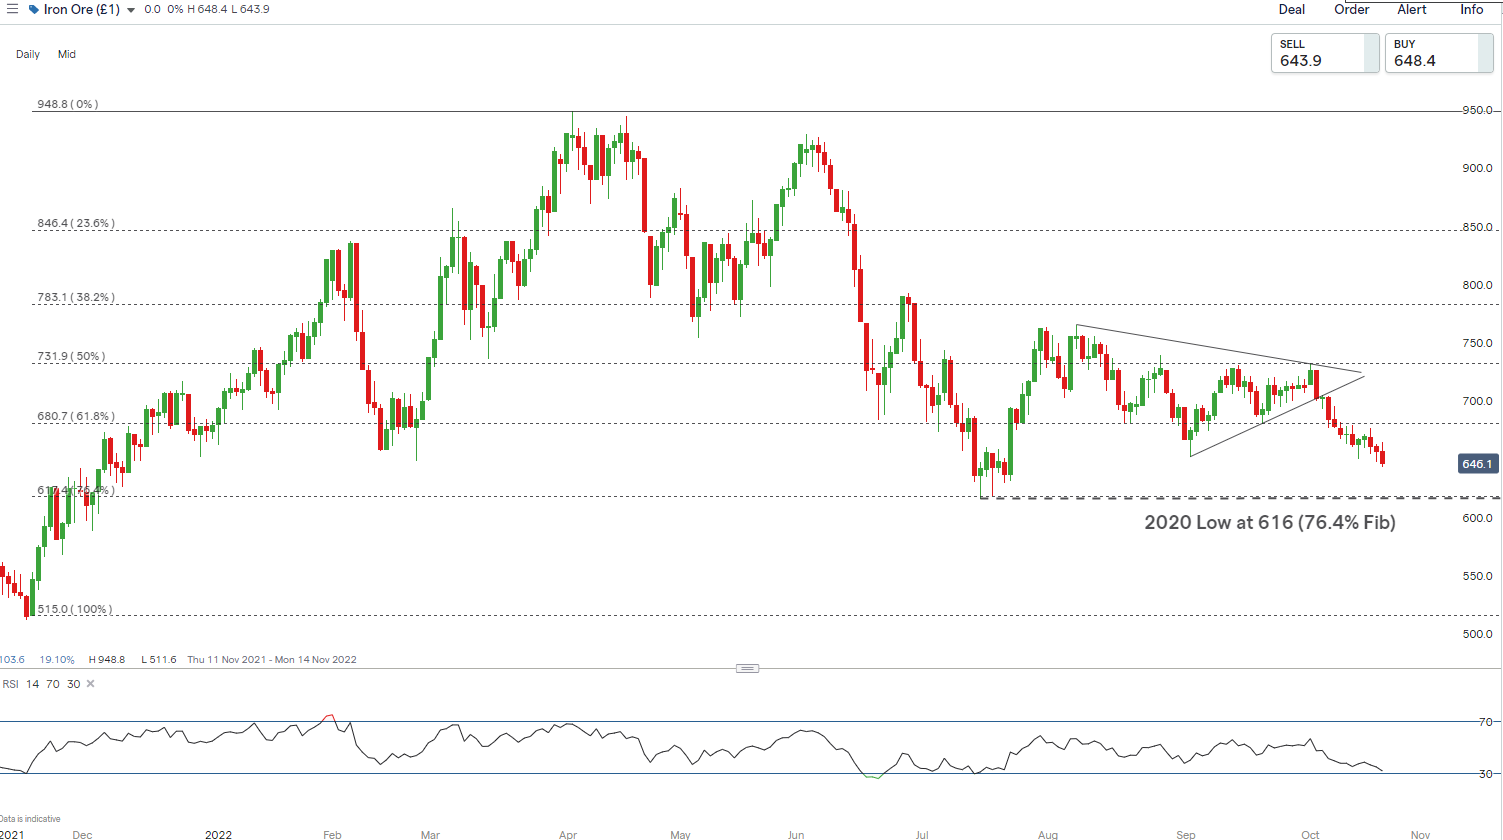
Source: IG, prepared by Richard Snow
AUD/NZD and AUD/USD Price Action Setups
The recent AUD/NZD advance occurs after the bearish breakdown of the long-term uptrend, circled in purple. Price action now tests resistance and prior support at 1.1170-1.1180. There are more challenges to the bullish move appearing with the underside of the ascending trendline and then the 50 SMA. The daily close and even early trading tomorrow will be crucial to assess the validity of an extended move higher.
A failure to break and hold above the level of resistance suggests that bulls may be running out of steam at this level which prevented previous attempts to move higher. Support appears at the 1.1095 followed by the 1.0972 level.
AUD/NZD Daily Chart
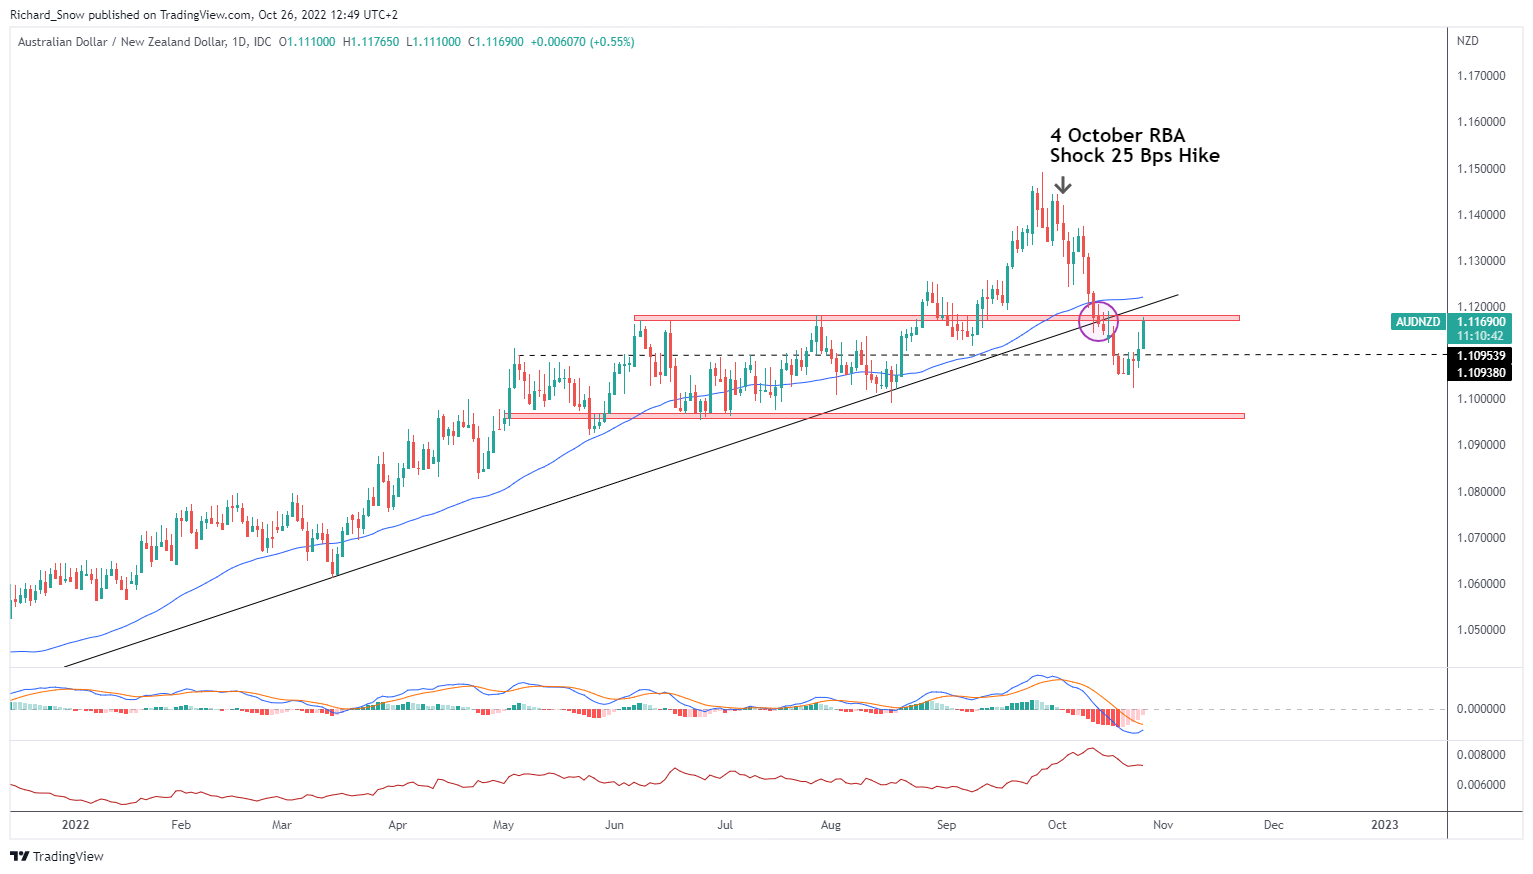
Source: TradingView, prepared by Richard Snow
Recommended by Richard Snow
How to Trade AUD/USD
The AUD/USD pair has actually broken above the zone of resistance with relative ease and now approaches 0.6535-0.6550 zone (yellow) where price action consolidated before continuing lower. As mentioned above, the potential for a widening interest rate differential between the two central bank rates and elevated US yields places the dollar in a strong position.
Therefore, the zone of resistance should be monitored keenly for any sign of rejection. Keep in mind that volatility in this pair is continuing higher, implying that price swings are certainly possible from current levels meaning the probability for a breakout, or even false breakout, remains a possibility. Support appears via the upper side of the zone of support at 0.6415
AUD/USD Daily Chart
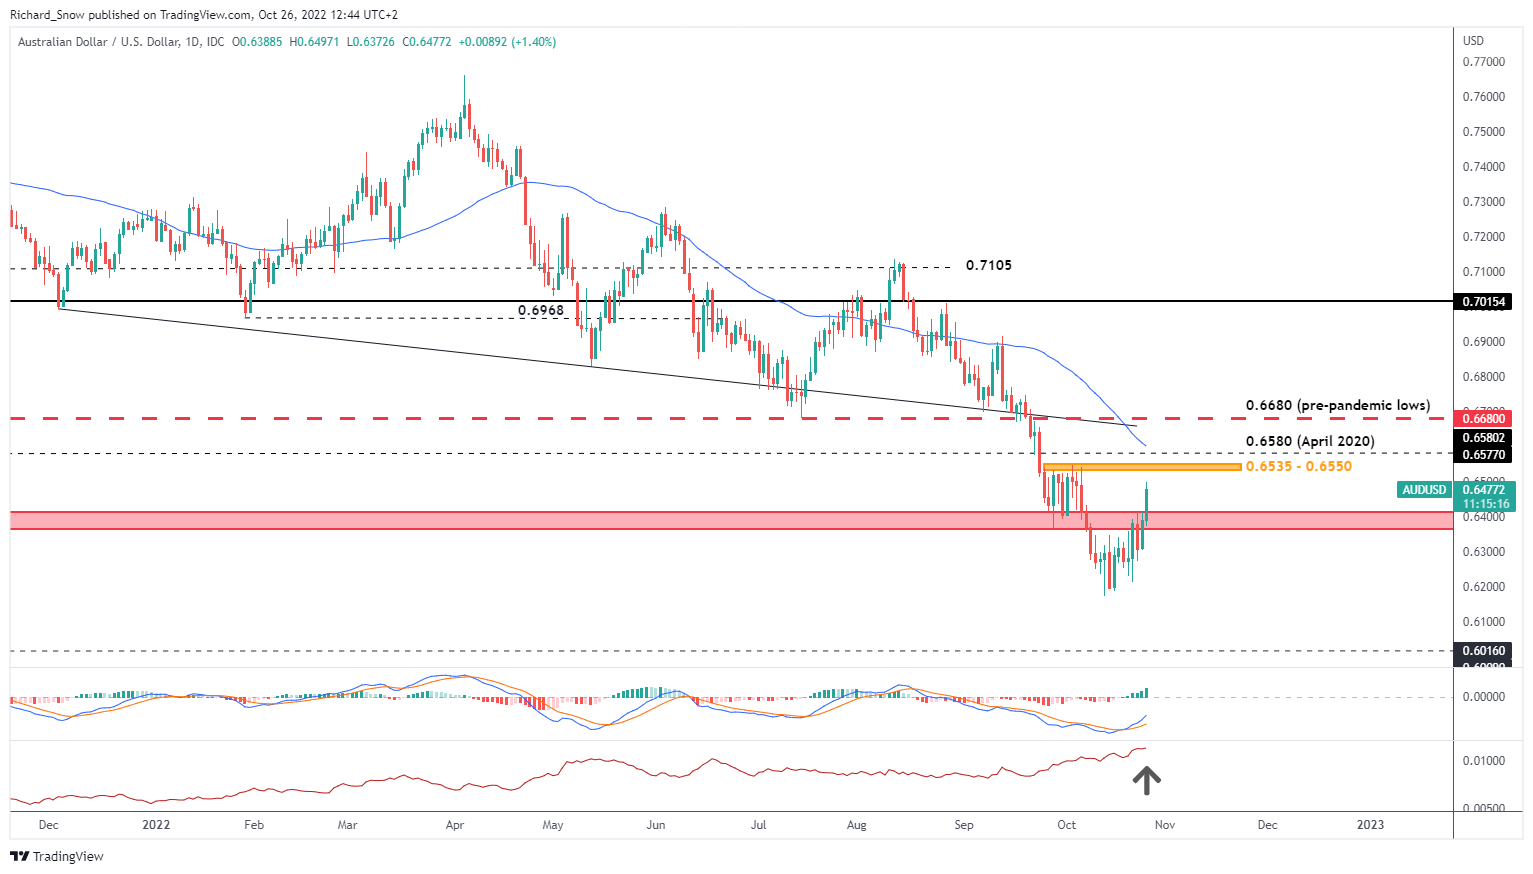
Source: TradingView, prepared by Richard Snow
The weekly chart further underscores the many challenges to an extended bullish move as the red dotted line at 0.6880 (pre-covid lows) has acted like a pivot point before.
AUD/USD Weekly Chart
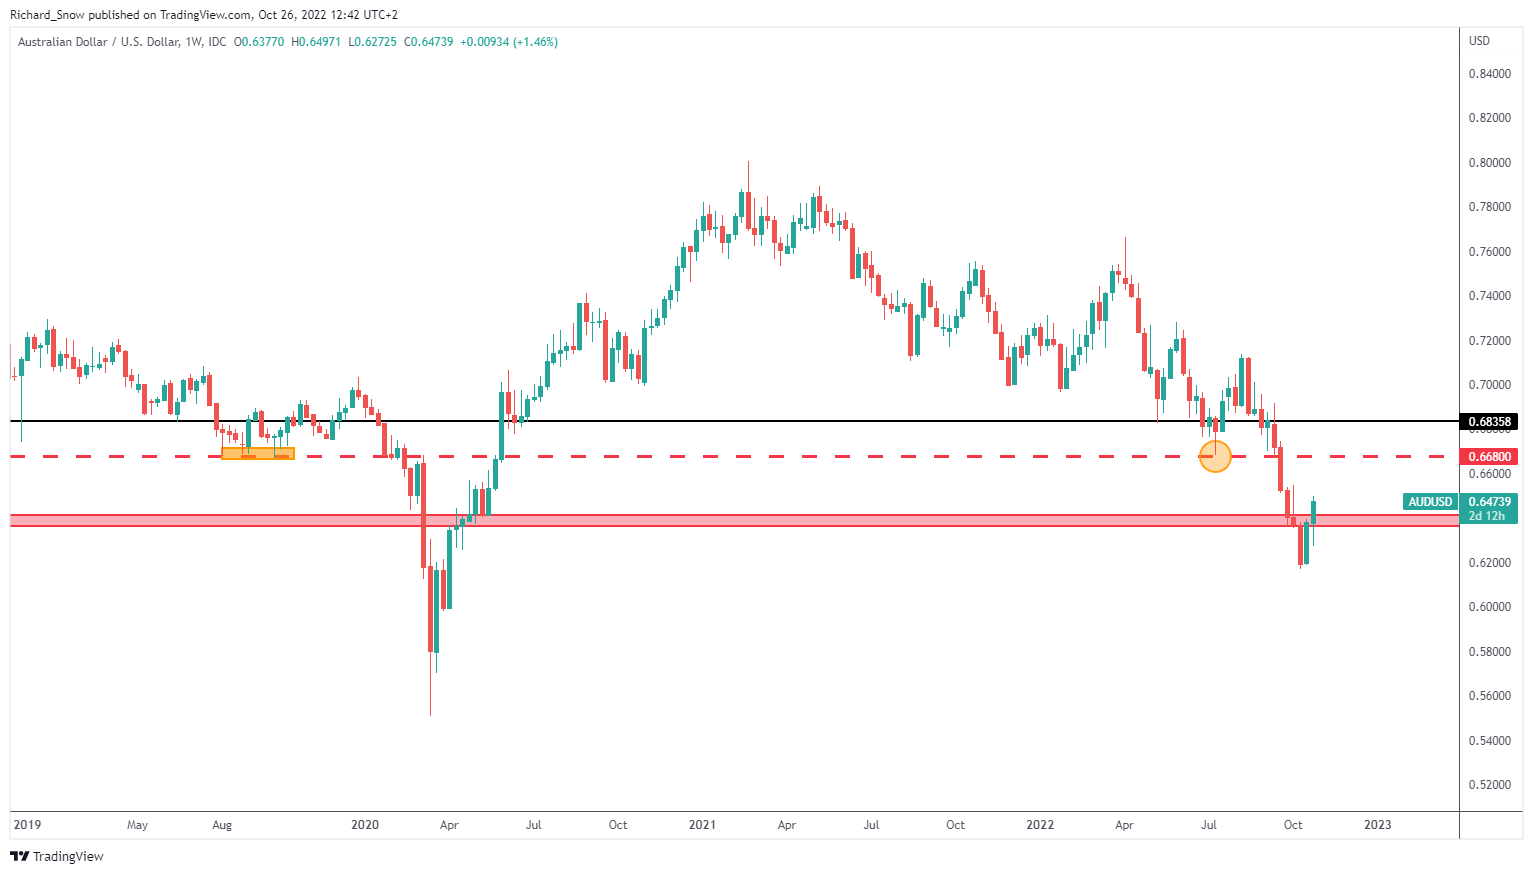
Source: TradingView, prepared by Richard Snow
Trade Smarter – Sign up for the DailyFX Newsletter
Receive timely and compelling market commentary from the DailyFX team
Subscribe to Newsletter
— Written by Richard Snow for DailyFX.com
Contact and follow Richard on Twitter: @RichardSnowFX
Be the first to comment