

andresr
Every decision is a kind of prediction… and every prediction, crucially, involves thinking about two distinct things: What you know and what you don’t.
– B. Christian & T. Griffiths, Algorithms to Live By
Has Fundamental Investing Broken Down?
Were you sold a wonderful stock story of great sales, earnings, and profit margins that foretold of large future price gains for 2022? You’re not alone. You probably remember how this year began with some extremely bold predictions. Those predictions quickly ran into record market declines and have since followed with countless calls every day, every week, every month to just keep “buying the dip.”
Famously, active manager Cathie Wood said ahead of the 2022 start that her ARK Innovation ETF (ARKK) “could deliver a 40% compound annual rate of return during the next five years.” She was widely criticized for such exuberance and what followed just 10 months later is the worst year since the founding of the fund now down over -62% YTD and -77.3% from ARKK’s highs. As the fund languishes near the March lows of the Covid correction more than two years ago, so too does the index of the 10 largest FANG mega caps shown in the MicroSectors FANG+ Index 3X Leveraged ETN (FNGU) chart insert below:
FinViz.com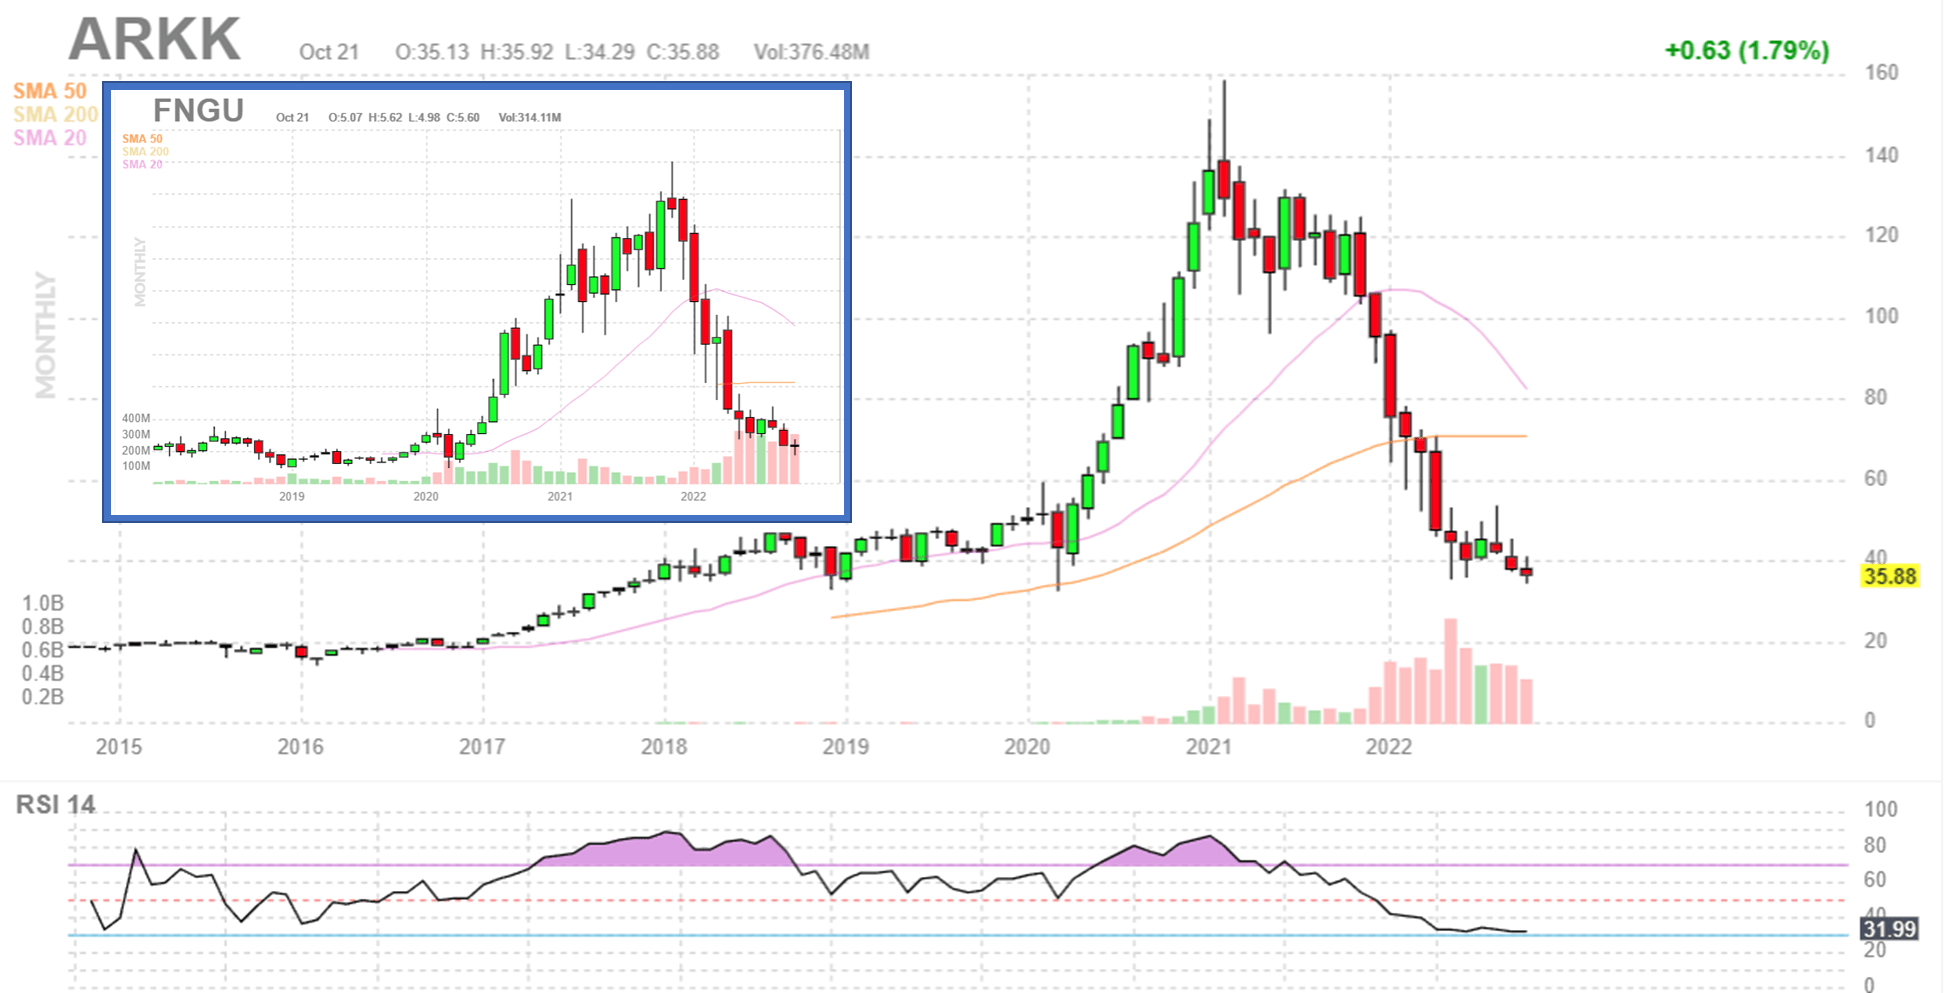
Besides the actively managed ARKK fund showing virtually no discernable difference over the past few years from the passive index fund FNGU of the 10 largest mega cap stocks, repeated calls for active dip buying in the ARKK fund have intensified record losses for investors.
Think about it. Would you have kept on buying the dip if you knew the S&P 500 would have its worst start to the year since 1939, the worst first half in over 50 years and the worst 10 months for both stocks and bonds since 1969?
Before you assume that I am somehow opposed to fundamental investing, value investing or anything having to do with “set it and forget it” or “buy-the-dip” trading approaches let me tell you a bit more.
Introduction
We’ve all put a lot of faith in fundamental stock picking over the years as a sure way to outperform the markets. As a finance Ph.D. and MBA investor, certified fraud examiner, investment adviser and anti-money laundering specialist, I want to operate with fundamentals. I have a huge bias toward fundamentals. I want to the find the numbers I can trust to substantially outperform the markets in the year ahead. But the best of my research, applying multiple discriminant analysis to find the strongest market variables, keeps showing me that “winning” has become less about the fundamentals. I am still genuinely skeptical of far-fetched theories about stock performance linked to planetary alignment, weather changes in global trading capitals, and the results of professional sports teams as models to predict the stock market. However, the evidence is clear, you absolutely have to look at things differently and apply alternative methodologies.
What is going wrong with fundamental investing?
Ultimately, that’s the critical question that multi-billion dollar hedge fund companies are struggling with today. In my doctoral research I have reviewed hundreds of peer-reviewed scholarly financial studies that have arrived at many of the same conclusions that I have. Fundamental and classical finance models are imperfect and should not operate at the exclusion of all other behavioral and technical market models. In fact, as Nobel Laureate Richard Thaler has said candidly,
Everyone’s lost a lot of money on their 401k plans. I’ve heard some people calling them 201k plans. So it’s even more important to get people to be saving more for retirement. Behavioral economics has helped us learn a lot about how to do that.
Not only has behavioral economics revealed powerful effects in saving for retirement, but also in many trading advantages. Scholars have even documented better reliability in technical and behavioral variables than they could achieve using only classical financial fundamental ratios and variables. After years like this one, I find it shocking that financial services are still discounting alternative technical models and decades of published research. Rather than just restate technical papers and share prior articles with more details,
let’s look at a brief analysis of today’s stock market for a simple current example:
Out of 6,046 stocks across the three largest US stock exchanges, we can run a basic comparison using two of the most common classical finance variables, sales growth and earnings growth. Three different stock samples are shown below to see how well these two fundamental variables correlate with stock performance in 2022:
| Stock Samples | Positive Return YTD | Negative Return YTD |
| 1) Pos Sales + Pos Earnings = 2,373 | 548 / 23.1% | 1,825 / 76.9% |
| 2) Pos Earnings = 3,408 | 700 / 20.5% | 2,708 / 79.4% |
| 3) Pos Sales = 3,644 | 763 / 20.9% | 2,881 / 79.1% |
| All Stocks / Total 6,046 | 1,205 / 19.9% | 4,841 / 80.1% |
What the results show us is that using only earnings or sales growth to pick stocks this year would give us a losing return and only a tiny percentage improvement in comparison to the broad market of all stocks. Neither positive sales, nor positive earnings, nor the combination of the two variables are statistically different in winners and losers this year than randomly selecting from the entire population of stocks in the three major US exchanges.
So the quick takeaway from this brief analysis of a few key fundamental variables is that fundamentally based stock selection of sales and earnings, would land you statistically no better off in the number of winners and losers than if you had picked randomly to include stocks with declining sales and earnings in 2022.
Even day to day there’s correlations that make no sense. It’s all messed up. My great hope is that we get out of this ridiculous monetary regime. And when we do things start to make sense again.
~ Stanley Druckenmiller
How Do We Win In Markets Like This?
So there has to be more to investing in the stock market than knowing a stock has good value (fundamental). You need to know if enough investors will also believe the stock has good value (behavioral) and whether they will actually commit to buying on that belief at this time (technical). Members of my marketplace community and students at the university may be familiar with this picture I use in my presentations:
Public Domain
(freeimageslive.co.uk)
This is essentially a picture of the stock market in 2022 with many good assets stuck in a market of draining liquidity. “Buy-the-dippers” frequently remind investors that there is a lot of good fundamental value out there. Yes they are correct, there is good value. I even believe that the “buy-the-dippers” may ultimately and eventually time the bottom perfectly after many tries. However, if you are stuck for days, or weeks, or months in a sailboat that doesn’t move forward, you begin to be concerned that some critical conditions may have been neglected. You might even wonder how you got stuck where you are in the first place.
Assets have been decoupled from reality based on predictable liquidity
Mohamed A. El-Erian, Chief economic adviser at Allianz SE, the parent company of Pimco, where he served as CEO and co-CIO, stated it this way:
Asset prices that, for years, were decoupled from fundamentals amid ample and predictable liquidity, and the proliferation of passive investing, computer trading and exchange-traded funds, including some that promised liquidity in inherently less liquid asset classes, are potentially amplifying the risk of contagion both on the way up and on the way down.
So, here are four ways that I navigate these markets:
1. Look for significant macro-economic events and anomalies in the market
We are in the midst of the largest quantitative tightening (QT) event in the history of the United States. Everyone was a superb stock picker from the start of the Fed intervention to add trillions of dollars of liquidity (QE) from March 2020 to March 2022. Just look at correlation on the ARKK and FNGU charts at the start of this article with the S&P 500 index fund (SPY) shown below:
VMBreakouts.com FinViz.com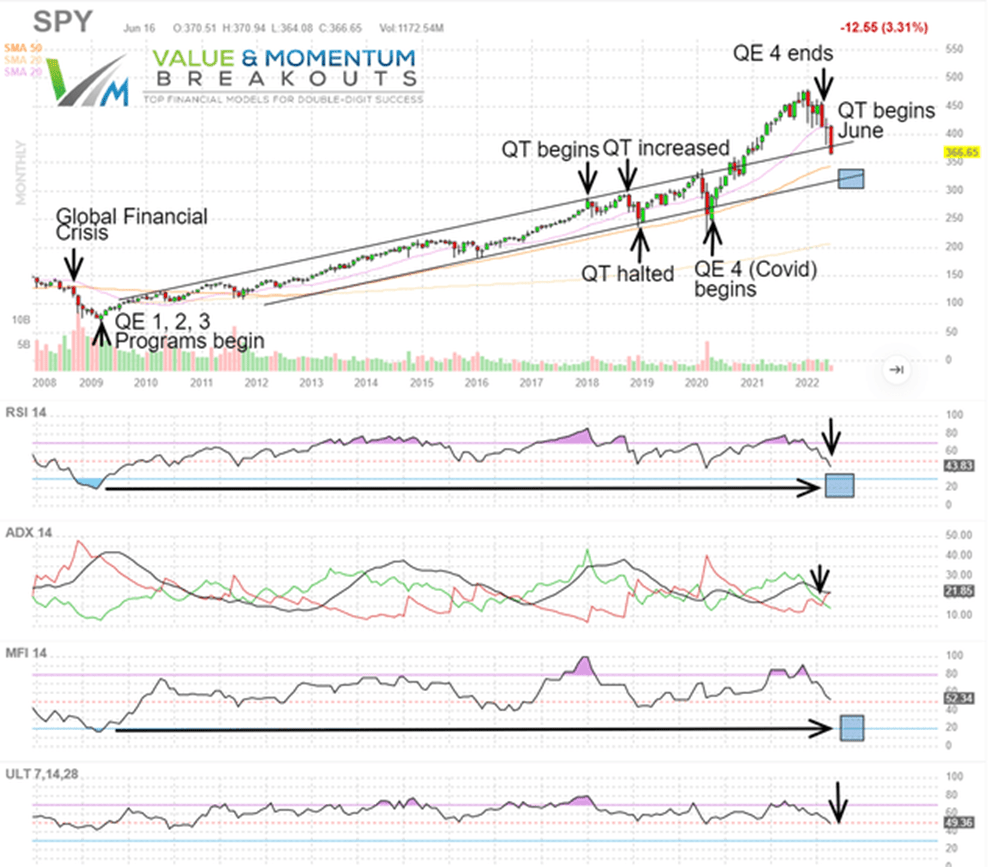
After some delay, the Fed’s QT began in June 2022 and has been increasing sharply through 41 weeks into October. The Fed balance sheet reduction may bear a strong resemblance to many investors 401k (or 201k as Dr. Thaler jokingly calls it). In fact you may see a much stronger correlation with the Fed balance sheet to markets than with sales or earnings of stocks this year. Negative market outflows and declining liquidity don’t care where fair valuation may be for our favorite stocks.
VMBreakouts.com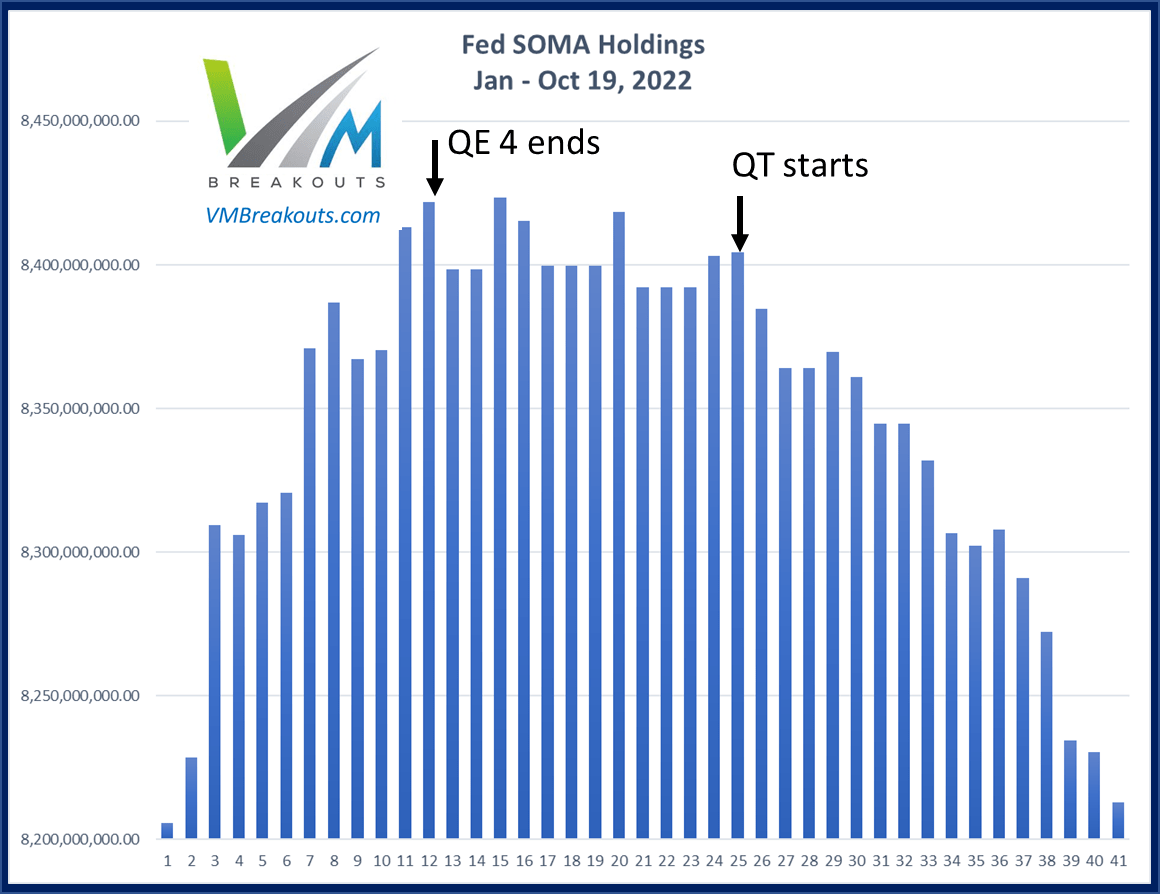
If you were unaware of this critical fund flow and market intervention from the Federal Reserve you might think earnings and sales will forever be useless variables in picking stocks. When central bank intervention ends, we should see more fundamental variables return to dominance. The Fed balance sheet is nearly back down to $8.2 trillion close to the start of 2022, but all indications from Chairman Powell are that their fight against inflation is not over. How this may continue to impact markets is a subject I track closely and have written about frequently since the last QT event in 2018:
There are many other market forces that are very important consider in this unprecedented year with record high inflation and frequent global central bank intervention from the Bank of England and Japan at levels not seen in decades.
2. Check for new variables that better explain price variance
I have written at length about the statistical approaches I use to find powerful discriminant variables across different cycles of momentum conditions. Testing more than 75 different variables simultaneously in combination through statistical measures to explain price behavior is a very powerful tool that anyone can apply. This introductory article may give you more insight on what variables you should consider across the technical, behavioral, and fundamental spectrum.
A Primer On Quick-Pick Momentum Accelerators
3. Improve your signals by monitoring momentum conditions across key variables
Here are several ways that I accomplish this monitoring function to see what degree of momentum is in the market. I still strongly believe in fundamental finance, but not to the exclusion of technical and behavioral financial models. In fact the more models that validate the signals the better I like it. I use something called the momentum gauges to evaluate market, S&P 500 index, and sector momentum conditions to identify market tops and bottoms:
Monthly Market Momentum Gauges
The monthly market momentum gauges turned negative November 2021 and have remained negative 10 out of the last 11 months. On the weekly gauges the market turned negative November 19th and more specifically November 17th on the daily gauges. The monthly gauge chart shown below over the past 2 years from the Covid Correction shows the monthly signals from the market gauge signals.
app.VMBreakouts.com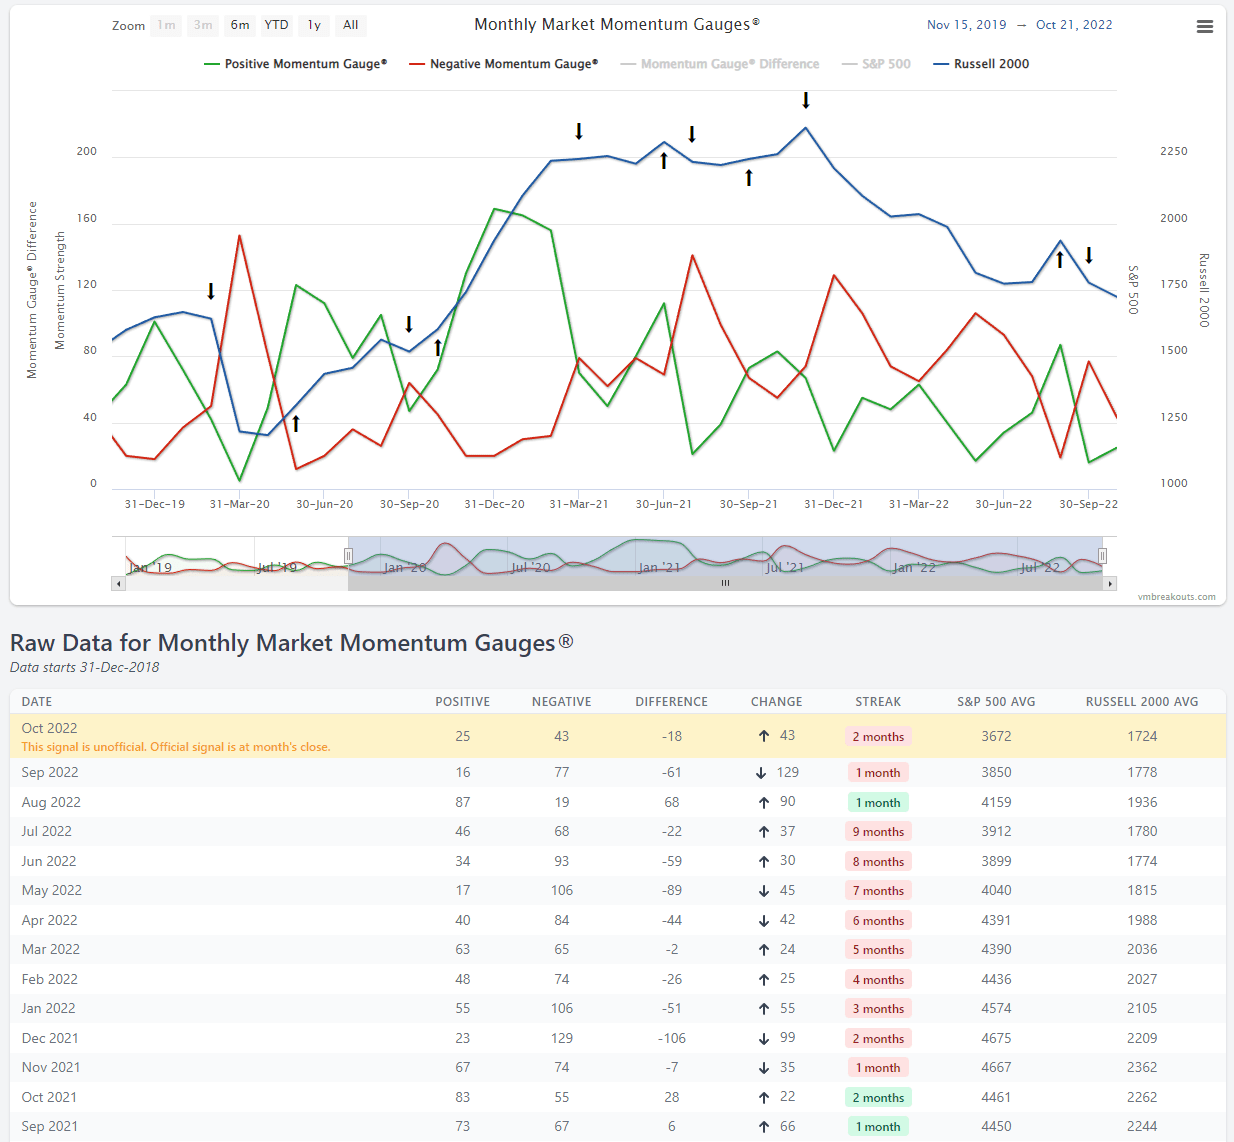
Timing the markets on these signals has avoided very significant market downturns since the model was first applied. The 2018 chart below also includes the QT market correction from October when the Fed increased their balance sheet reduction to -$50 billion per month to then the highest levels in history. Additionally the chart shows how we avoided the Covid Correction from February 19th until the Fed’s massive QE 4 intervention on March 23rd.
VMBreakouts.com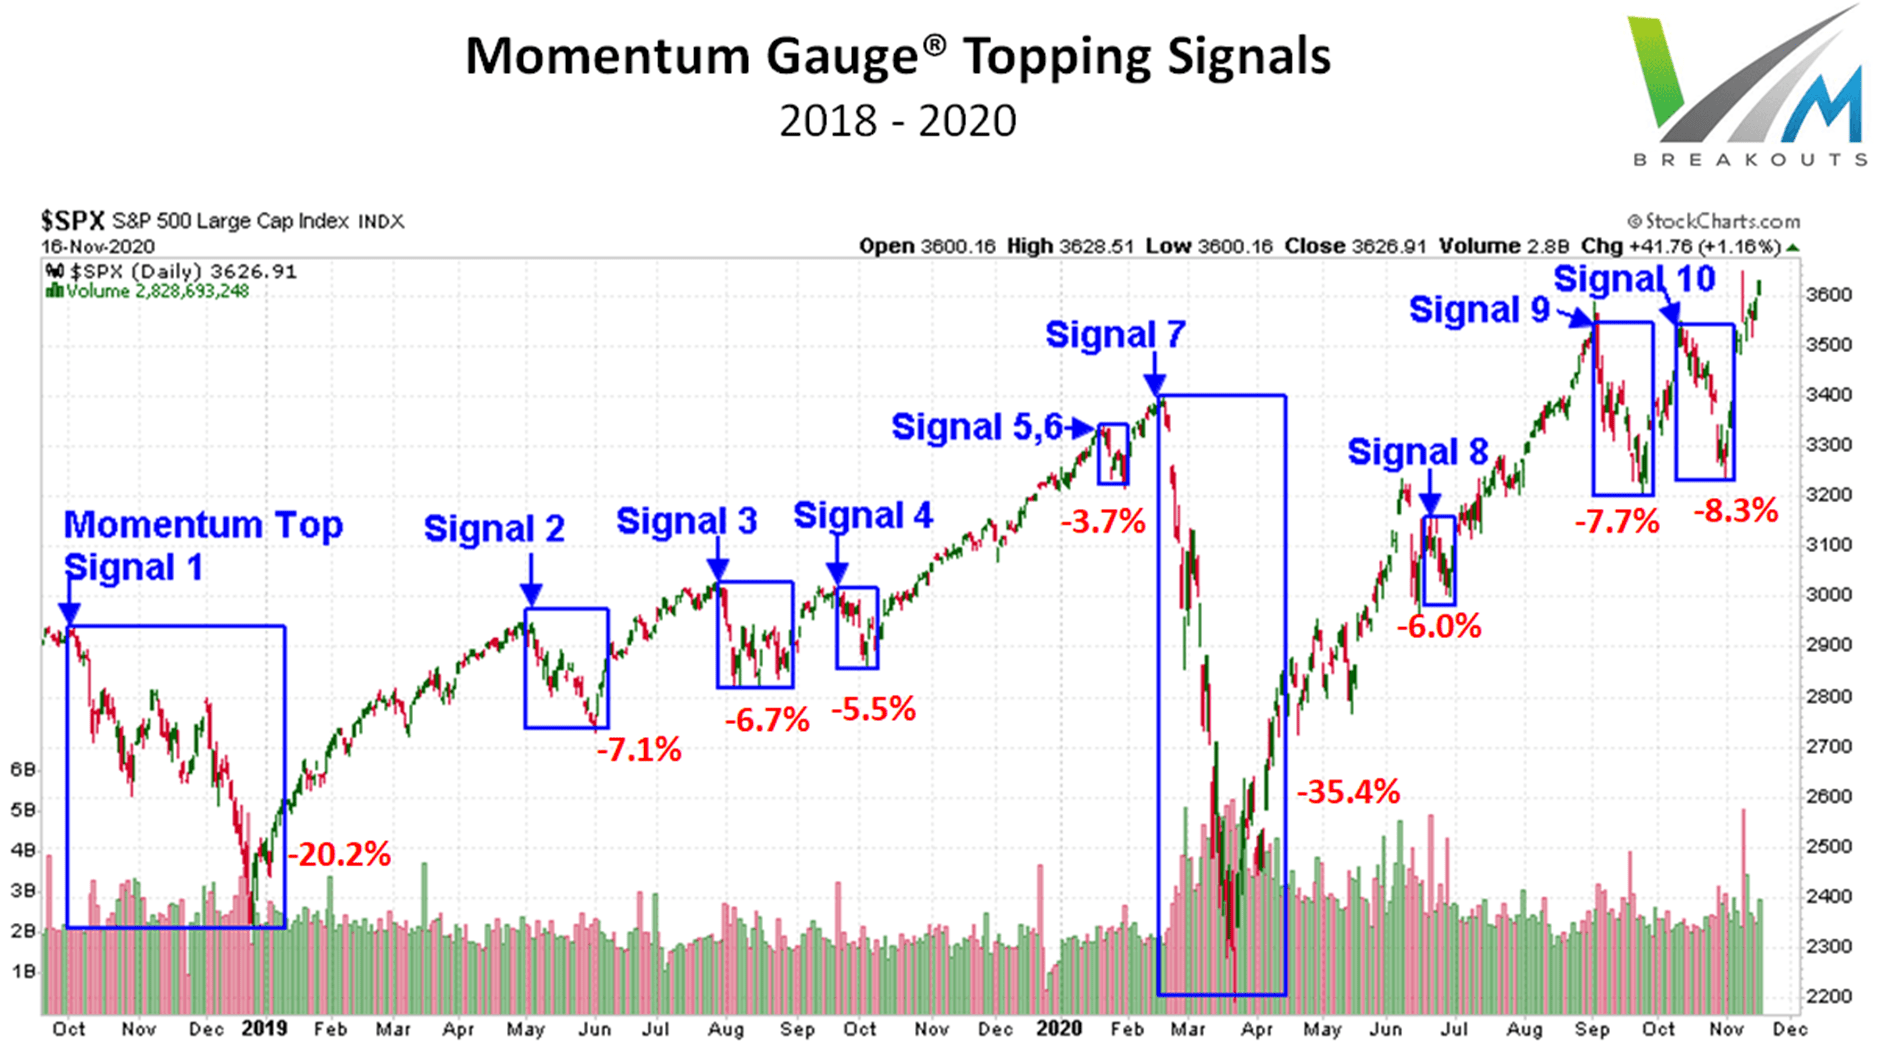
4. Pick stocks when the timing, market conditions, and top models converge
This year has been the worst year since 1991 for the buy-the-dip strategy according to data compiled by Barclays. It is also the only year since the 5-trading day week started that has seen a higher percentage of down days since 1974.
Zerohedge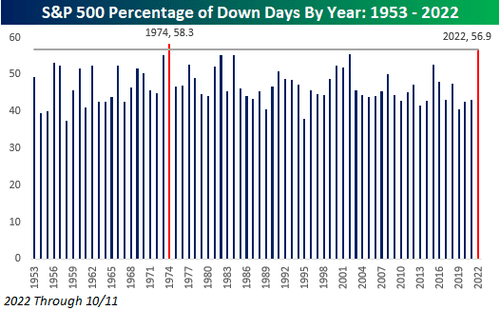
Similarly it has been the longest the Momentum Gauge model has stayed negative in all the years I have applied the signals. While we have had daily positive signals, the longer monthly and weekly signals have been strongly negative since November 2021.
As a result, I have been heavily in cash and bear funds this year with the Active ETF portfolio +31.90 YTD and so far beating the S&P 500 by 53.2%. In addition all the V&M stock portfolios are beating the S&P 500 ranging from short term high frequency breakout portfolios to long term value buy/hold portfolios. I don’t know how the year will end, nor do I try to pretend that I know the future. The best I can do is see when the market signals are changing, how significantly they are changing, and where the money flows are heading for strong gains, or to avoid the worst losses until it is safe to buy-the-dip again.
Conclusion
The evidence is clear that fundamental approaches and conventional trading schemes are floundering. I offer a few alternative ideas that may be critical to our future success in finding excess returns, and welcome your thoughts toward finding even more opportunities.
I don’t know where this is all going. If it continues I’m not going to return to 30 percent a year any time soon. Not that I think I might not anyway. But one can always dream when the free money ends we’ll go back to a normal macro trading environment. ~ Stanley Druckenmiller
I stay out of a lot of trouble by not pretending to be some brilliant prognosticator of a generally unpredictable world. My quantitative investing models screen the entire market throughout the day and I rely on an inductive investment approach to follow where the strongest momentum, value, and behavioral signals lead me. I would encourage you to embrace technical and behavioral models, not put warning labels on them — Especially when these models are greatly outperforming hedge fund averages and the classical finance variables again this year.
I wish you all the very best in your investing decisions,
JD Henning, PhD, MBA, CFE, CAMS
Be the first to comment