

FTSE 100 Analysis:
- The FTSE 100 index surpasses 7000 landmark for the first time since Feb 2020
- Ocado Group is strong out of the gate after £10m investment in Oxbotica
- IG Client Sentiment nearing 50/50 split providing mixed trading environment
FTSE 100 Continues Bullish Run above ‘milestone’ 7000 mark
The FTSE 100 index breached 7000 on Friday with UK banking stocks Natwest and Barclays among some of the biggest movers. In early UK trading this morning, it is Ocado Group that leads the way after the online delivery service invested £10m in Oxbotica to develop autonomous vehicles for future deliveries. Demand for online purchases and doorstep deliveries have increases drastically during lockdown and are well positioned to thrive even after restrictions ease.
FTSE 100 Extends into Potential Zone of Resistance
While the FTSE still lags US tech-heavy indices, it has experienced a rather consistent bull run of late. Recovering to the 7000 mark after trading below 5000 just over a year ago shows how consumer confidence has picked up – albeit with massive monetary and government support.
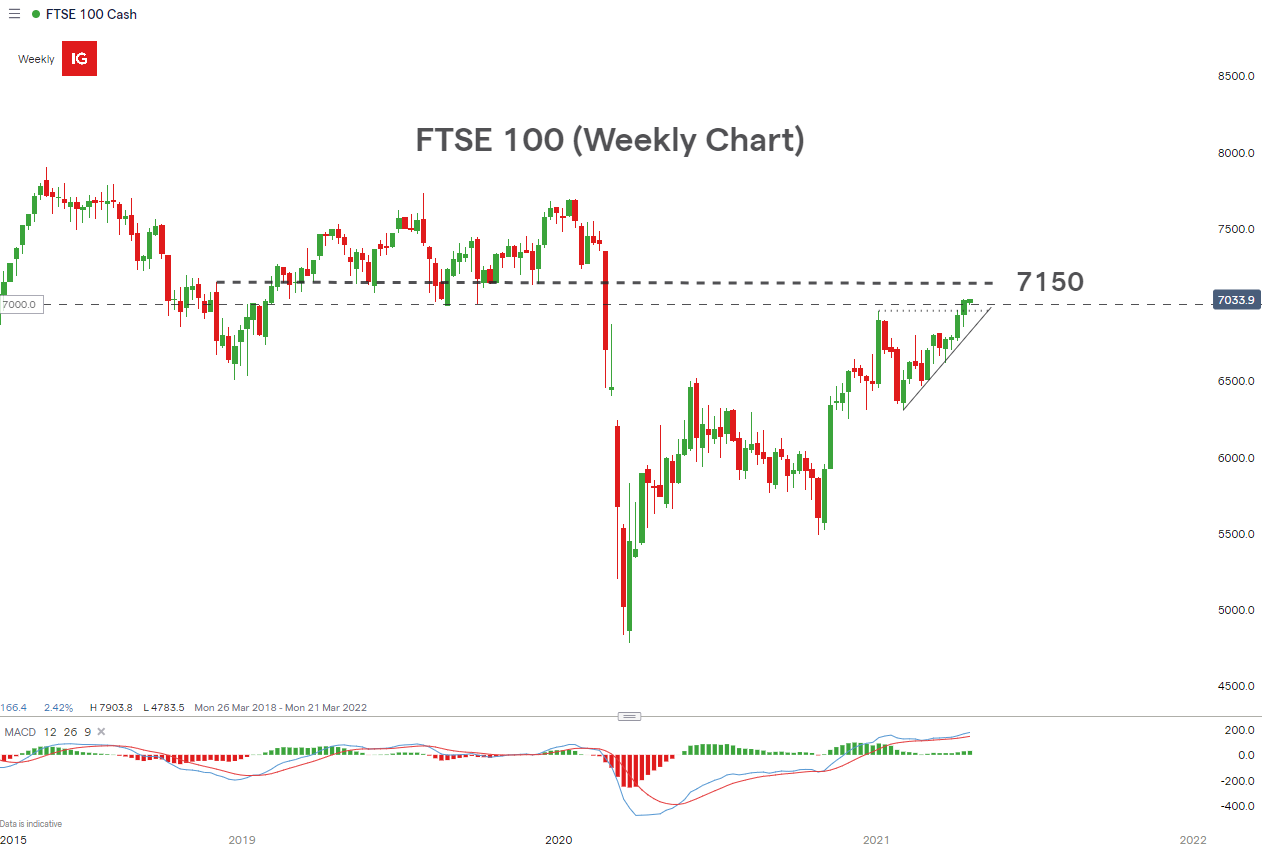
The weekly chart shows how price has moved above the recent high and the 7000 mark but may run into a rather significant zone of resistance from just over 7000 to 7150. The 7150 level played a large role throughout 2019 as a long term level of support.
FTSE 100 Weekly Chart
Chart prepared by Richard Snow, IG

Recommended by Richard Snow
Get Your Free Equities Forecast
FTSE 100 Daily Chart Showing Signs of Possible Bullish Fatigue
The daily chart takes a closer look at the levels most relevant to the UK index. Price action may trade within the previously mentioned range of 7000-7150. A break and hold above 7150 will most likely attract the attention of bulls as such a move may be indicative of further upside to come.
However, right now, there appear to be signs that the recent bull run may be running out of momentum. While it is still early, the 700-7150 band poses a threat to the current bull run while the RSI index placed current levels into overbought territory. Therefore, we could see a retracement (cooling off period) back below 6960 and even back towards the ascending trendline.
FTSE 100 Daily Chart
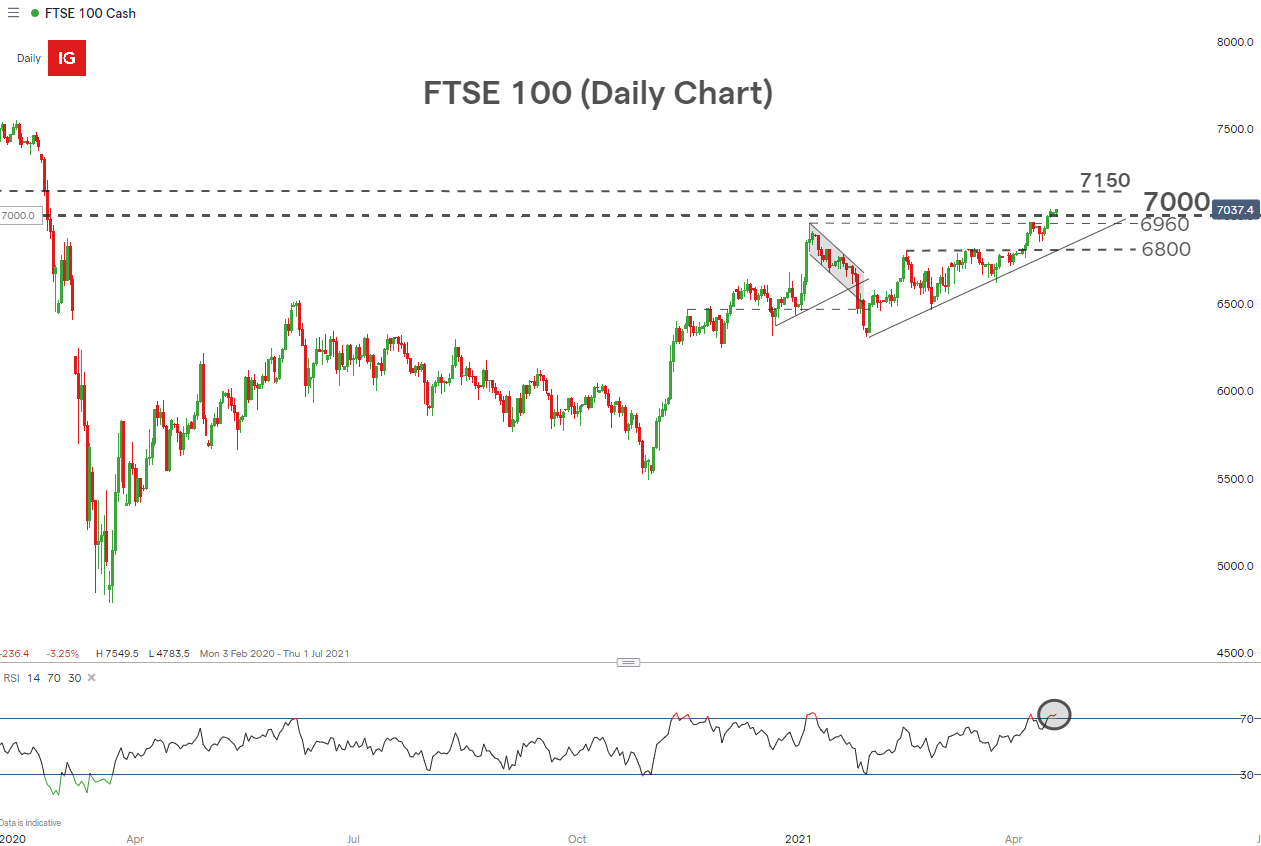
Chart prepared by Richard Snow, IG
IG Client Sentiment Nearing 50/50 Split – Providing Mixed Trading Environment
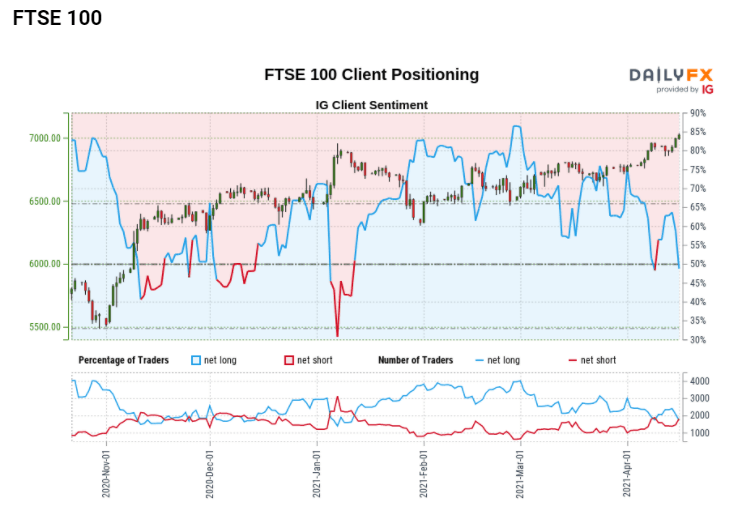
- FTSE 100: Retail trader data shows 52.94% of traders are net-long with the ratio of traders long to short at 1.12 to 1.
- We typically take a contrarian view to crowd sentiment, and the fact traders are net-long suggests FTSE 100 prices may continue to fall.

Recommended by Richard Snow
Learn how to read and incorporate IG CS
- The number of traders net-long is unchanged than yesterday and 12.94% lower from last week, while the number of traders net-short is unchanged than yesterday and 8.23% higher from last week.
- The combination of current sentiment and recent changes gives us a further mixed FTSE 100 trading bias.
— Written by Richard Snow for DailyFX.com
Contact and follow Richard on Twitter: @RichardSnowFX
Be the first to comment