

NicoElNino
This quarter’s letter begins with a review of performance, currency effects, earnings growth, margins, valuation, our performance outlook from this valuation level, and timing considerations. These topics reiterate and expand upon our Septembermonthly comment, which received more feedback than usual from our investors and readers, with nearly all of it encouraging. Then in bullet point form, we present new material that summarizes macro discussion points from recent conversations with investors. Finally, we conclude with travel notes and our statistical appendix.
Q3 Performance
Net of fees, we lost 7.30% in Q3, somewhat similar to our 6.49% Q2 loss and our 5.28% Q1 loss. Our Q3 monthly profile was similar to Q2, with the first two months of the quarter around break-even and the third month showing a 7% loss. In our opinion, the brutal losses in June and September reflect global markets discounting recession risk as their primary worry. Before June, we believe the primary concern was inflation, interest rate hikes, and the Ukraine war—all contributing factors toward recession to be sure, but the focus was on these issues rather than recession itself. Having begun to price in recession risk in June, global markets then took a summer holiday and deluded themselves with unlikely scenarios, in our opinion, such as an early Fed rate pivot or an economic soft landing. In the second half of August and continuing through September, global markets got serious again about recession risk and unwound their summer fantasy.
The indices we track had a dreadful Q2 (all down 11%-16%) and a somewhat less dreadful, but still poor, Q3. On a total returns basis in Q3, MSCI Frontier Markets (FM) and MSCI FM Small Cap (FM SC) both dropped 6%, MSCI EAFE (EAFE) fell 9%, and MSCI Emerging Markets (EM) plunged 12%. The S&P 500 lost 5% in Q3, after giving up 16% in the prior quarter.
YTD and COVID-era outperformance
Year to date (YTD), we have lost 18%. All the indices we track have greater losses. Their YTD total returns are FM SC -22%, S&P 500 -24%, FM -26%, and EM and EAFE -27%.
We also lead all the indices over the past 12 and 24 months. The COVID low was 30 months ago in March 2020, and, with a lag, we really began to outperform after August 2020, 25 months ago. From September 2020 onward, we have beaten the S&P 500 six-fold, 35.5% to 5.7%. FM is break-even over this time and EM is -16%. Figure A1 in our Statistical Appendix shows returns for all periods we discuss here: YTD, the prior one year, the prior two years, after August 2020, and after March 2020. We lead each index for all these periods with a single exception that FM SC is ahead of us after March 2020.
Currency
Nearly two-thirds of our Q3 loss and almost three-quarters of our YTD loss is due to currency. A strong US dollar is more than an emerging market or frontier market phenomenon, however. Through September, the most traded global currencies against the dollar—the euro, Japanese yen, and British pound—have all performed worse this year than our currencies in aggregate. In pound terms, our YTD performance is only -1%; in yen, we are +3%. A strong dollar may continue hurting performance and it may cause collateral damage in markets (e.g., British bonds toward the end of September) or vulnerable countries, such as the ones we sold these past 15 months. There is, however, a silver lining: developed world currencies mean revert over time. GMO estimates the dollar to be 17% overvalued before September and they note that the dollar is at its highest real effective exchange rate since 1985. We agree with their view that an expensive dollar should provide a future performance boost for non-US assets.
See the Statistical Appendix for performance details. Figure A1 shows annual returns for us and these indices, Figure A2 shows quarterly numbers, Figure A3 presents our monthly numbers, and Figure A4 translates our USD returns into the home currencies of our investors. For those wanting more detail, Figures A5 through A11 show portfolio mix, statistics, attribution, evolution, and concentration.
Earning Growth and Margins
Earnings growth
Our USD portfolio earnings per share growth for Q2 is 34% year-over-year so far (96% of the portfolio has reported), or 50% in constant currency. YTD, our USD portfolio EPS is up 37% (49% in constant currency). This is in sharp contrast to US companies where reported GAAP EPS is declining (-12% in Q2 and -6% YTD).[1]
Margins
We did a study of the profit margins of the companies we own. We knew that margins had expanded significantly in 2021 and 2022 from COVID-impacted levels in 2020, giving us excellent EPS growth this year and last. We wondered how sustainable this was. In our opinion, margin expansion among S&P 500 companies to an all-time high in Q4 2021 was unsustainable, and the earnings declines those index companies have seen this year do result from margin compression. Are we vulnerable to the same effect? What we learned was that our margins in Q1 and Q2 2022 were below the same respective quarters in 2019, the last pre-COVID year, and below the average for the same respective quarters in 20172019, the three years before COVID. This is not to say that our margins cannot fall from where they are. We have had periods in the last decade where our margins were below the present level. Given the disruptive change, both positive and negative, that COVID has brought to demand and supply, no one can be that confident in predicting the future course of margins. Nevertheless, we do not feel exposed to this risk to the degree that we observe US companies are. As we have noted previously, most of the new positions we added in 2022 are companies that still have significant COVID earnings recovery remaining this year and, in most cases, next year. Regardless, our unusually high portfolio EPS growth rates will decline to more normal levels as the prior year comparisons become less easy and as our economies slow some due to likely developed world recession.
Valuation
Quality Value Score
Continued earnings growth and lower prices have improved our month-end portfolio PE, price/book, and weighted average dividend yield to 5.3, 0.97, and 6.8%, respectively. At the end of September, our Value Score (VS) that weights these three metrics equally was our 6th best ever at 97 (100 = cheapest ever), while our Quality Value Score (QVS) that adds ROE as a fourth metric was 98, our 4th best ever. The only months with a better VS or QVS were in early 2009 around the Global Financial Crisis (GFC) low or after the COVID selloff, both times where strong gains followed.
Performance possibilities
Regressions of QVS (or VS) and future 12- and 24-month performance have strong statistical significance. Our QVS regression at the end of Q3 shows gains of 25% and 49% over the next one and two years, respectively. There is no guarantee of this outcome, of course.
A different way to consider performance is to examine what has happened after our worst monthly drops, such as the one we had last month. We’ve had seven months (out of 179) where we lost around 7% or more.[2] They are: September-November 2008 (-7.90%, -17.46%, and -10.72%, respectively), May 2018 (-6.75%), March 2020 (-19.35%), June 2022 (-7.07%), and September 2022 (-6.98%). We studied performance after these drops (excluding the June and September 2022 drops as they are too recent to measure their subsequent record). One year later, we rose 24% on average, with the best outcome being +48% and the worst being -5%. Two years later, we rose 50% on average, with the best being +96% and the worst being -27% (due to the COVID selloff that was a new event unrelated to the initial May 2018 drop, but within its ensuing 24-month window). Further declines after the initial drop are normal, but the ultimate low typically was not far away (within five months four times out of five). This further decline to the bottom averaged 14%, but within six months of the initial drop, we recovered to be only 1% below the initial drop level, on average. We draw these results from a limited number of data points and future results could differ completely from our past experience.
Timing
Twin signals
To conclude, two signals exist that in the past preceded future strong gains: low valuations and a large monthly selloff. Although coincidence, both signals produce nearly identical one- and two-year forward performance numbers, as we presented above, of 24%25% and 49%-50%, respectively. Yet, investors may feel it is early because the US and the developed world still face significant interest rate hikes and recession. What is a rational investor to do? Investing now makes sense, but the record shows losses are likely before the gains kick in. We propose this to investors who think it early and who may also want to consider our pronounced positive seasonality that begins in December. A $5 million investor might invest $1 million in four consecutive months December 2022 through March 2023 and hold $1 million back in case of a longer drawdown tail. It probably won’t feel comfortable investing (it never tends to around market bottoms), but past situations like the present are where our greatest gains occurred.
Dollar-cost averaging
We think dollar-cost averaging is a good technique to mitigate timing stress and the impossibility of bottom-ticking the market low. We have recommended this tactic to numerous investors over the years in rough markets such as these or when the investor was struggling with the timing question. While many have used this tactic, frankly we’d like to see our investors use it more often—we think they could have made more money for themselves by investing regularly on autopilot instead of only in large chunks. It’s human nature that investors tend to make large allocations more often when everything feels good rather than when valuations are at their lowest and future return projections are at their highest. Please contact us to set up a monthly or quarterly investment plan.
Investor Macro Discussion Points
Interest rates are the price of money, the US dollar is the world’s reserve currency, and US equity markets are a significant portion of the world’s total. This year, US interest rate policy and related US currency, fixed income, and equity market performance have been the driving factor behind global asset price performance, including Frontaura’s performance. With the US policy interest rate of 3.00%-3.25% at its highest level in nearly 15 years, and rising at the fastest pace in decades, we suppose this makes sense. It will not always be this way, and it does not change our investment process.[3] We think about it though and we discuss it to help set our expectations and those of our investors. Even if something different should and will eventually happen, we’ve got to live through these events first. There’s no avoiding them, but the good news is that past global equity selloffs in 2008 and 2020 set the table for our best performance ever and as we cited above, the 2022 selloff has put our metrics at similar levels to where those selloffs bottomed.
Thus, let’s consider where the world is.
- Where are we in the market cycle? From 2020, we believe the top market issue has evolved from pandemic; to the fiscal and monetary liquidity response, which, along with pandemic supply constraints, contributed to inflation; requiring interest rate hikes. The Ukraine War increased supply challenges, worsening inflation. Companies overestimated the duration of liquidity-boosted demand, leaving them with too much inventory. An inventory correction, inflation, and rate hikes will likely cause a recession, which will hurt company profits and margins. Higher rates and quantitative tightening reduce liquidity, creating a dollar shortage and a strong dollar. Tighter liquidity and the dollar shortage increases the chance of a disorderly market event.
- The Fed put has a lower strike price than in the past. We don’t see the Fed riding to the rescue of falling equity markets by cutting interest rates anytime soon; if they do, it will be because something bad happens. In the words of Mohamed El-Erian, as quoted by Bloomberg September 30, “All of you who are looking for a pivot, be careful what you wish for. This pivot only happens if you have an economic accident or a financial accident. And the journey to an economic accident or a financial accident is a very painful journey.”
- Despite a brutal 45 days through the end of Q3 where it lost 17%, on September 30 the S&P was only 2% below its mid-June level. In other words, in the past 3.5 months, the US market has hardly priced in any further risks, recession or otherwise.[4]
- If a US recession occurs with its average recession market drop, the S&P 500 would fall 14% from its 30 September 2022 level to 3068. That’s the decline necessary from its 3 January 2022 peak for it to match its average 36% recession slump. To match its worst recession fall, it would drop 42% further from September 30 to 2073 (a 57% decline in total from January 3). The best case would be that the S&P declines no further from September 30 because its 25% loss already exceeds the drop from the 1980 (17%) and 1990-1991 (20%) recessions.[5]
- At the end of Q3, the S&P 500 was technically oversold and investor sentiment was strongly bearish. These contrarian indicators support a Q4 rally, and with positive US seasonality from November onward, the year could end on an upbeat note. We note that the selloff after August 16 had a couple of downward gaps, one from 4037-4084 and another even higher from 4203-4219. Technicians tell us that reversals tend to fill in gaps. If that happens, the S&P would be only 2% shy of its summer high. If this occurred, we would not expect it to last.[6]
- Domestically, 2023 could be another slow downward grind, especially if a year-end 2022 rally does occur. We mention a year-end rally primarily to highlight its possibility and to point out the negative implication. If rallies occur that prove false, the ultimate US low will take longer to reach.
- When setting a low, will non-US markets decouple from US as they did in GFC? The US and global markets bottomed in early March 2009, but EM hit its low over four months earlier, at the end of October 2008. That specifically was due to massive stimulus from China. We are not predicting a repeat of that (although a COVID reopening in China, if it were to occur, could help the global economy), rather we are just observing that there’s the possibility, that—for whatever reason—different markets come out of the selloff that commenced in 2022 at different times. By the time the US hit its bottom on 9 March 2009, EM was up 7% from its low. The S&P 500 had a good year in 2009, with a total return of 26%, but EM tripled this gain with its 79% rise (we made 46% in 2009 and another 37% in 2010). We don’t know when we will turn around, but we do know we have lower valuations, lower margins relative to our own history, and better EPS growth than the developed world. Many countries in the EM and FM universe began their rate-hiking cycle earlier than the developed world and our currencies are undervalued compared to the dollar. We believe these factors are supportive of our future performance.
Travel News
We attended two conferences the third week of September. Tim traveled to Dubai for the largest global frontier markets conference of the year, held in person for the first time since 2019. He met with 30 companies from 18 countries. From Chicago, Nick and Christian attended a Latin America virtual conference, meeting 14 companies from Argentina, Chile, Colombia, and Peru. Altogether, we met with 43% of our portfolio at these two conferences. Nick will present at the University of Wisconsin Hawk Center Investment Conference in Madison, Wisconsin on Friday, October 21.
We thank you for being a Frontaura investor.
Best regards,
Nick Padgett, CFA, and Tim Raschuk, CFA
Statistical Appendix
Our Statistical Appendix follows this section. Figure A1 shows annual, cumulative, and compounded returns for us and the indices we typically cite. Figure A2 shows quarterly performance for Frontaura and these indices. Figure A3 shows our monthly returns since inception. Figure A4 shows Frontaura’s returns in US dollars and six foreign currencies that are the home currencies of our investors.
Please see Figure A5 for portfolio mix by country, region, and sector, along with our portfolio statistics. Figures A6 and A7 show quarterly country attribution by dollar and percentage returns. Figure A8 shows regional attribution, including at the country level within each region. Figures A9 and A10 show changes in country mix for the quarter and the last 12 months. Figure A11 shows portfolio concentration changes over the last three and 12 months.
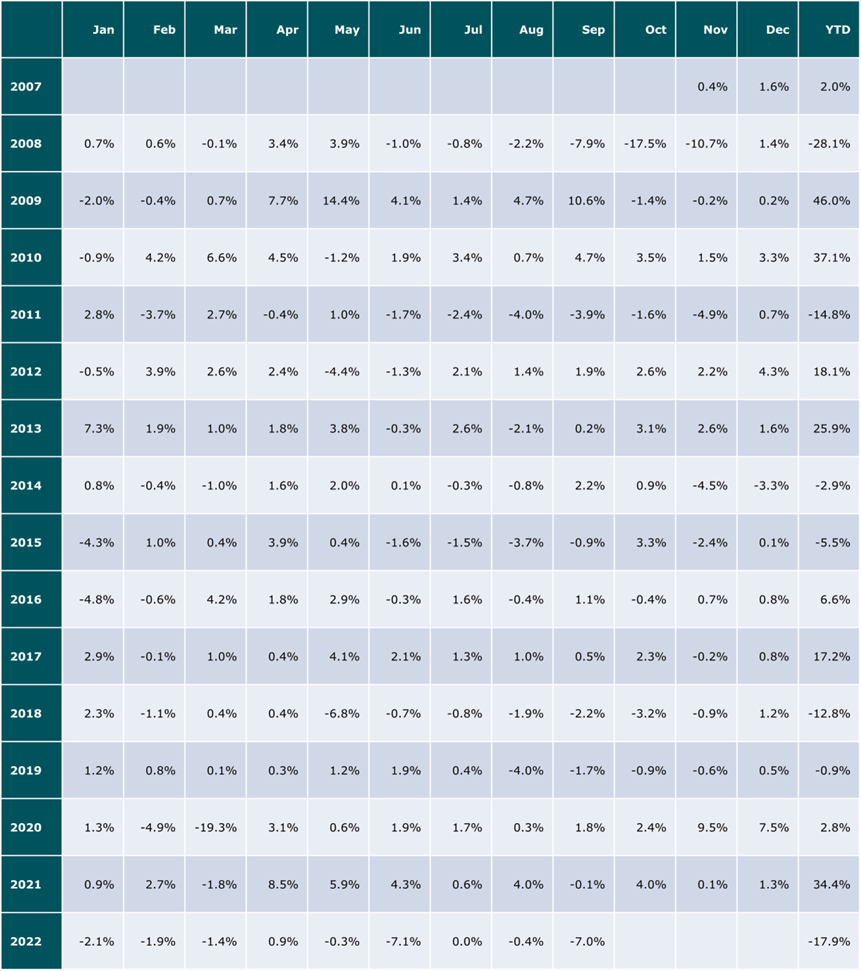
Figure A1: Annual Frontaura and Index Performance[7] 30 September 2022
![Figure A1: Annual Frontaura and Index Performance[7] 30 September 2022](https://static.seekingalpha.com/uploads/2022/11/10/542689-16681309779309025_origin.png)
|
Figure A2: Quarterly Frontaura and Index Performance[8] 30 September 2022
![Figure A2: Quarterly Frontaura and Index Performance[8] 30 September 2022](https://static.seekingalpha.com/uploads/2022/11/10/542689-16681309780187533_origin.png)
|
Figure A3: Monthly Frontaura Performance
| Frontaura returns are net of all fees for a reference investor joining the fund at inception, making no further contributions, making no withdrawals, and converting to Series B in 2021 Q2. Investors joining on other dates, making additional contributions, making withdrawals, or not converting to Series B in 2021 Q2 may have different results. Our auditor has audited results through 2021. We discuss our returns and different series here. |
Figure A4: Performance by Currency[9] [10] 30 September 2022
![Figure A4: Performance by Currency[9] [10] 30 September 2022](https://static.seekingalpha.com/uploads/2022/11/10/542689-16681309783399906_origin.png)
Figure A5: Portfolio Mix and Statistics[11]
![Figure A5: Portfolio Mix and Statistics[11]](https://static.seekingalpha.com/uploads/2022/11/10/542689-16681319773213935.png)
Figure A6: 5 Best and Worst Performing Countries (Dollar Return) 2022 Q3
|
5 Best Countries |
5 Worst Countries |
||||||
|
Country |
Frontaura Return ($millions)[12] |
Frontaura Return (%) |
Country |
Frontaura Return ($millions) |
Frontaura Return (%) |
||
|
UAE |
0.8 |
9% |
Cambodia |
(1.6) |
-19% |
||
|
Rwanda |
0.2 |
3% |
Colombia |
(1.2) |
-24% |
||
|
Niger Republic |
0.0 |
1% |
Côte d’Ivoire |
(1.2) |
-11% |
||
|
Ecuador |
(0.0) |
-3% |
Philippines |
(1.0) |
-5% |
||
|
Kenya |
(0.0) |
-13% |
Nigeria |
(0.7) |
-18% |
||
Figure A7: 5 Best and Worst Performing Countries (Percentage Return) 2022 Q3
|
5 Best Countries |
5 Worst Countries |
||||||
|
Country |
Frontaura Return ($millions) |
Frontaura Return (%) |
Country |
Frontaura Return ($millions) |
Frontaura Return (%) |
||
|
UAE |
0.8 |
9% |
Colombia |
(1.2) |
-24% |
||
|
Rwanda |
0.2 |
3% |
Cambodia |
(1.6) |
-19% |
||
|
Niger Republic |
0.0 |
1% |
Nigeria |
(0.7) |
-18% |
||
|
Bahrain |
(0.1) |
-3% |
Poland |
(0.1) |
-13% |
||
|
Ecuador |
(0.0) |
-3% |
Kenya |
(0.0) |
-13% |
||
Figure A8: Performance by Region and Country 2022 Q3
|
Region / Country |
Frontaura Return ($millions)[13] |
Frontaura Return (%) |
MSCI Small Cap Return (%)[14] |
MSCI Standard Return (%) |
|
Middle East / North Africa |
0.6 |
4% |
||
|
United Arab Emirates |
0.8 |
9% |
0% |
-2% |
|
Bahrain |
(0.1) |
-3% |
-1% |
10% |
|
Egypt |
(0.1) |
-6% |
3% |
-1% |
|
Eastern Europe |
(0.1) |
-13% |
||
|
Poland |
(0.1) |
-13% |
-22% |
-25% |
|
South Asia |
(0.4) |
-6% |
||
|
Bangladesh |
(0.2) |
-7% |
-5% |
-9% |
|
Pakistan |
(0.2) |
-5% |
— |
-9% |
|
Latin America & Caribbean |
(2.1) |
-13% |
||
|
Ecuador |
(0.0) |
-3% |
||
|
Chile |
(0.4) |
-10% |
6% |
3% |
|
Peru |
(0.5) |
-8% |
-14% |
-1% |
|
Colombia |
(1.2) |
-24% |
-35% |
-18% |
|
Southeast Asia |
(3.0) |
-8% |
||
|
Vietnam |
(0.4) |
-5% |
-6% |
-10% |
|
Philippines |
(1.0) |
-5% |
-6% |
-14% |
|
Cambodia |
(1.6) |
-19% |
||
|
Sub-Saharan Africa |
(3.3) |
-7% |
||
|
Rwanda |
0.2 |
3% |
||
|
Niger Republic |
0.0 |
1% |
||
|
Kenya * |
(0.0) |
-13% |
5% |
2% |
|
Uganda |
(0.2) |
-7% |
||
|
Botswana |
(0.2) |
-12% |
— |
-22% |
|
Tanzania |
(0.4) |
-10% |
||
|
Senegal |
(0.4) |
-6% |
— |
-6% |
|
Namibia |
(0.5) |
-10% |
||
|
Nigeria * |
(0.7) |
-18% |
-11% |
-15% |
|
Côte d’Ivoire |
(1.2) |
-11% |
| *We present MSCI returns for Nigeria and Kenya as they report them, but we use a materially more conservative exchange rate than MSCI for each country. In Nigeria, were we to use MSCI’s exchange rate assumption, we would outperform their returns we show here. For historical background on Nigeria, see our 2020 Q4 letter, page 3. |
Figure A9: Significant Quarterly Country Mix Changes[15] 2022 Q3
|
Country |
Percentage Point Change |
Explanation |
|
None |
No country weight changed by 2% or more |
Figure A10: Significant Annual Country Mix Changes October 2021 – September 2022
|
Country |
Percentage Point Change |
Explanation |
|
Cambodia |
+6 |
Re-entered country Q1 2022 |
|
Peru |
+5 |
Re-entered country Q2 2022 |
|
Namibia |
+4 |
Entered country Q2 2022 |
|
Vietnam |
+2 |
Added position Q2 2022 and increased prefunding balance Q3 2022 |
|
Rwanda |
+2 |
Relative outperformance |
|
Tanzania |
+2 |
Increased size of existing position, relative outperformance |
|
Bahrain |
+2 |
Re-entered country Q2 2022 and increased size Q3 2022 |
|
Georgia |
-2 |
Exited position and country Q2 2022 |
|
Botswana |
-2 |
Exited position and country Q3 2022 |
|
Papua New Guinea |
-3 |
Exited position and country Q1-Q2 2022 |
|
Egypt |
-5 |
Exited one position in Q1 2022 and one position in Q3 2022 |
|
Turkey |
-5 |
Exited position and country Q4 2021 |
|
Ghana |
-7 |
Exited positions and country Q4 2021-Q1 2022 |
|
Kazakhstan |
-11 |
Exited positions and country Q2 2022 |
Figure A11: Portfolio Concentration[16] 30 September 2022
|
Companies |
Countries |
Change from Prior Quarter |
Change from Prior Year |
|||
|
Companies |
Countries |
Companies |
Countries |
|||
|
Positions |
31 |
21 |
-3 |
-2 |
-5 |
-2 |
|
Top 5 |
32% |
47% |
-2 |
+1 |
-2 |
0 |
|
Top 10 |
55% |
71% |
-1 |
+1 |
+1 |
-2 |
|
Top 20 |
78% |
92% |
0 |
-1 |
-1 |
-5 |
|
Top 20 + USA (CASH) |
85% |
99% |
+1 |
0 |
+6 |
+2 |
|
This document does not constitute an offer to sell, or a solicitation of an offer to buy, membership interests in Frontaura Global Frontier Fund LLC or shares in Frontaura Global Frontier Fund Offshore Limited. We will not make such offer or solicitation prior to the delivery of appropriate offering documents. Before making an investment decision, we advise potential investors to read these materials carefully and to consult with their tax, legal, and financial advisors. Frontaura accepts subscriptions from accredited investors only, and we require you to prove your accredited investor status. We have compiled this information from sources we believe to be reliable, but we cannot guarantee its accuracy. We present our opinions without warranty as of the publication date. We may change our opinions at any time. Due to market risk and uncertainties, actual events, results, or actual performance may differ materially from that reflected or contemplated in any forward-looking statements contained herein. Past results are no guarantee of future performance. Please contact us if you would like any materials, such as our legal documents, investment presentation, monthly comments, or quarterly letters, or if you would like access to our website that contains these materials and more. To remove yourself from future mailings, please reply to this message with the word “Remove” in the e-mail subject header. If you are not on our mailing list but would like to be, please e-mail us with “Add” in the header. |
Footnotes[1] In each case, Frontaura and the S&P 500, these are as-reported EPS, not operating earnings that exclude some expenses. (For those who enjoy excluding things such as Berkshire Hathaway’s Q2 unrealized investment loss, we note that Q2 and YTD S&P 500 EPS still shrink year-over-year with this loss excluded. Be sure to exclude any gains of a similar character going forward.) We calculate the S&P 500 EPS change using data from what we consider to be the definitive source: S&P Dow Jones Indices. Click this link, then page down and click the “Additional Info” pulldown menu, then click “Index Earnings” to download the S&P 500 earnings history spreadsheet. We use the “As Reported Earnings Per Shr” columns for the appropriate quarters as inputs to our calculations. Other data sources may calculate S&P 500 EPS differently, usually higher and not necessarily better, in our opinion. [2] All other monthly drops were less than 5%, so the ~7% or worse drops do stand out. A further distinction is that we can clearly remember these seven worst losses in our mind without needing to look up what month they were, how bad the loss was, or what caused it. The firsthand experience of living through these losses has burned them into our memory more fully than other bad months. [3] We acknowledge that we’ve been quicker to sell risky macro situations and we’ve limited some country exposures to a greater degree than in the past. As we have written many times before, seeing the interest rate hikes that began in our universe in 2021, we began pruning vulnerable countries from mid-2021 onward. We discuss this in depth, for each position exit, in the What We Sold section on pages 5-17 of last quarter’s letter. We would not label this as a change in process, but rather as increased vigilance attuned to the risks of the day that has allowed us to sidestep some significant losses. [4] On the first trading day of Q4, the S&P 500 erased its small amount of progress in discounting risk by rallying to close above its June 16 level. [5] Unlike elsewhere in this document, we did all calculations in this bullet point using S&P 500 price returns rather than its total returns, as total return data is not available for all recessions we considered, back to 1969. [6] Reflecting our 0.48 beta, we’d expect Frontaura’s performance to lag during any bear market rallies, as occurred earlier this year. When the S&P 500 made a 18% total return after June 16 through August 16, we were -1%. We did have a 6% rally after July 14 through August 11. YTD through June 16, we were -9% while the S&P 500 was -23% (at our July 14 low we were -15% YTD). After August 16 through September 30, we were also -9% while the S&P 500 was -17%. [7] Frontaura returns are net of all fees for a reference investor joining the fund at inception, making no further contributions, making no withdrawals, and converting to Series B in 2021 Q2. Investors joining on other dates, making additional contributions, making withdrawals, or not converting to Series B in 2021 Q2 may have different results. Our auditor has audited results through 2021. Index returns are in USD on a total return basis, net of any withholding tax. We discuss our returns and different series and we explain the different indices we show here. [8] Frontaura returns are net of all fees for a reference investor joining the fund at inception, making no further contributions, making no withdrawals, and converting to Series B in 2021 Q2. Investors joining on other dates, making additional contributions, making withdrawals, or not converting to Series B in 2021 Q2 may have different results. Our auditor has audited results through 2021. Index returns are in USD on a total return basis, net of any withholding tax. We discuss our returns and different series and we explain the different indices we showhere. [9] USD = US dollar, AUD = Australian dollar, CAD = Canadian dollar, CHF = Swiss franc, EUR = euro, GBP = British pound, SGD = Singapore dollar. [10] Frontaura returns are net of all fees for a reference investor joining the fund at inception, making no further contributions, making no withdrawals, and converting to Series B in 2021 Q2. Investors joining on other dates, making additional contributions, making withdrawals, or not converting to Series B in 2021 Q2 may have different results. Our auditor has audited USD results through 2021. We discuss our returns and different series here. [11] Click herefor an explanation of our holdings and portfolio statistics. [12] This footnote applies to all columns labeled “Frontaura Return ($millions)” and “Frontaura Return (%)” on this page and any similar page. Frontaura individual stock, country, and regional returns are before management fees, fund expenses, and any incentive compensation, as those deductions occur at the fund level and not at the individual stock, country, or regional level. Click herefor an explanation of how we calculate country returns. [13] The Frontaura Return footnote on the first attribution table on a prior page applies to all Frontaura Return columns on this page. [14] This footnote applies to all columns labeled “MSCI Small Cap Return” and “MSCI Standard Return” on this page and any page with a similar table. We state MSCI small cap and MSCI standard (large cap and mid-cap stocks) country indices on a total return basis with dividends net of any withholding tax. We show “–” if MSCI does not have a small cap or a standard index for a given country. [15] We show countries whose weighting has changed by two percentage points or more. Total may not add to 0 due to rounding and exclusion of countries changing by less than two percentage points. Note that we do not show the United States as we only hold cash there. Click herefor a discussion of how we classify cash by country. [16] We do not include the US in our country count and most of the percentage totals as we hold only cash there. Change from the prior quarter and the year ago quarter represent the change in the number of positions and the change in percentage points for the top 5, 10, and 20 positions. The Top 20 + USA row does include the US cash percentage in the percentage totals. Click herefor a discussion of how we classify cash by country. |
Editor’s Note: The summary bullets for this article were chosen by Seeking Alpha editors.
Be the first to comment