

SAND555
Introduction
Freeport-McMoRan (NYSE:FCX) is a diversified mining company based in Phoenix, AZ. It is the largest producer of molybdenum and a significant producer of copper. Freeport also owns the largest gold mine in Papua, Indonesia. This mining company has been a star performer this year as its stock price has recently accelerated upwards.
Current Fundamental Show Market Strength
Ratios
Mining companies could be more excited with these quick and current ratios. In this case, both ratios were reasonably flat over the last five years. However, mining companies will get attention to be star performers over the previous few weeks as the general stock market and other asset classes have been relatively negative this year.
|
Metric |
2017 |
2018 |
2019 |
2020 |
2021 |
|
Period |
FY |
FY |
FY |
FY |
FY |
|
Current ratio |
2.140 |
3.220 |
2.467 |
2.723 |
2.517 |
|
Quick ratio |
1.195 |
1.664 |
0.993 |
1.483 |
1.665 |
|
Cash ratio |
0.883 |
1.267 |
0.629 |
1.070 |
1.369 |
Source: Financial Modelling Prep
Growth
As for Freeport, growth profit was reasonably solid in 2021, which appeared to be challenged for 2018 through 2020. However, revenue growth was negative during the same period, while the previous year was Freeport’s strongest.
|
Metric |
2017 |
2018 |
2019 |
2020 |
2021 |
|
Period |
FY |
FY |
FY |
FY |
FY |
|
Revenue growth |
0.106 |
0.136 |
-0.227 |
-0.014 |
0.609 |
|
Gross profit growth |
2.593 |
0.183 |
-0.750 |
0.961 |
2.466 |
|
Ebit growth |
2.301 |
0.309 |
-0.771 |
1.234 |
2.433 |
|
Operating income growth |
2.301 |
0.309 |
-0.771 |
1.234 |
2.433 |
|
Net income growth |
1.421 |
0.432 |
-1.092 |
3.506 |
6.189 |
|
Epsgrowth |
1.396 |
0.246 |
-1.106 |
3.494 |
6.213 |
Source: Financial Modelling Prep
Data
As stated earlier, Freeport has been relatively negative or flat over the years with growth, but this year has been a solid performer. Both simple moving average periods of 20 and 50 days are strongest compared to the last five years.
|
Metric |
Values |
|
SMA20 |
17.95% |
|
SMA50 |
25.85% |
|
SMA200 |
5.49% |
Source: FinViz
Enterprise
The stock price for Freeport has nearly doubled in the last five years but has significantly strengthened in the previous two years. Market capitalization appears to have suffered in 2018 and 2019 but peaked during the last year.
|
Metric |
2017 |
2018 |
2019 |
2020 |
2021 |
|
Symbol |
FCX |
FCX |
FCX |
FCX |
FCX |
|
Stock price |
19.130 |
11.270 |
11.320 |
26.910 |
36.040 |
|
Number of shares |
1.447 B |
1.449 B |
1.451 B |
1.458 B |
1.468 B |
|
Market capitalization |
27.681 B |
16.330 B |
16.425 B |
39.235 B |
52.924 B |
|
Enterprise value |
36.351 B |
23.254 B |
24.275 B |
45.327 B |
54.625 B |
Source: Financial Modelling Prep
Estimate
As hinted before, the mining industry is relatively unexciting, as shown in the projected revenue until 2026. Dividend growth is reasonably flat; earnings price per share and EBITDA show subpar performance over the same time. One unpredictable estimated metric is its net profit growth which appears to double in the next five years. One would need to understand how this impacts Freeport’s stock price, but it also depends on if the global economy is going into a long-term downtrend. If so, this is an excellent stock to hold, as shown in a challenging market environment this year.
|
YEARLY ESTIMATES |
2022 |
2023 |
2024 |
2025 |
2026 |
|
Revenue |
22,375 |
21,792 |
23,335 |
24,979 |
25,219 |
|
Dividend |
0.55 |
0.45 |
0.48 |
– |
– |
|
Dividend Yield (in %) |
1.46 % |
1.18 % |
1.26 % |
1.39 % |
– |
|
EPS |
2.30 |
1.70 |
2.27 |
3.13 |
3.12 |
|
P/E Ratio |
16.52 |
22.31 |
16.72 |
12.12 |
12.17 |
|
EBITDA |
9,055 |
8,868 |
10,841 |
12,880 |
13,484 |
|
Net Profit |
3,446 |
2,478 |
3,417 |
4,392 |
4,501 |
Source: BusinessInsider
Optimal Market Entries Based on this Technical Analysis
Bollinger Bonds
Freeport’s recent stock price strength is breaking through the upper band, which signals that stock accumulation is in the early phase. So it is a matter of time before the fear of missing out will kick in, potentially driving up the stock price in a compelling way.
fcx bollinger (custom platform)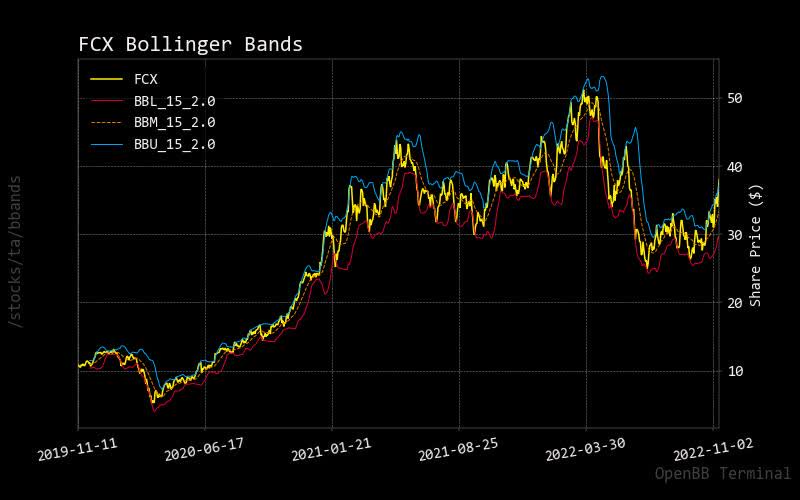
MACD
As with the current MACD stock price yellow line in the lower panel, it confirms that Freeport’s stock price velocity is starting to accelerate. The speed of this stock price momentum means there is still enough underway to capture the potential tail end of this moving uptrend.
fcx macd (custom platform )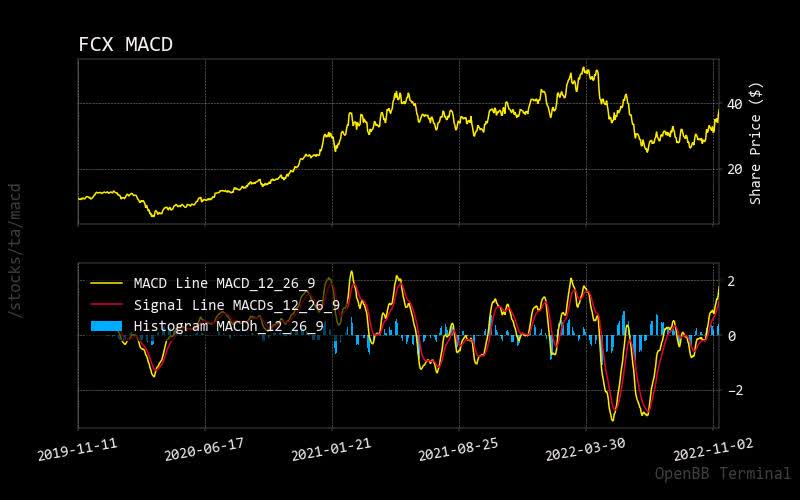
RSI
As Freeport’s stock price does continue to drive up to its RSI oversold stock condition, investors need to compare similar situations on this stock to see the impact. Once the RSI hits approximately 80, one can expect a potential continued stock price trend. RSI may have little effect overall on the stock price of Freeport.
fcx rsi (custom platform)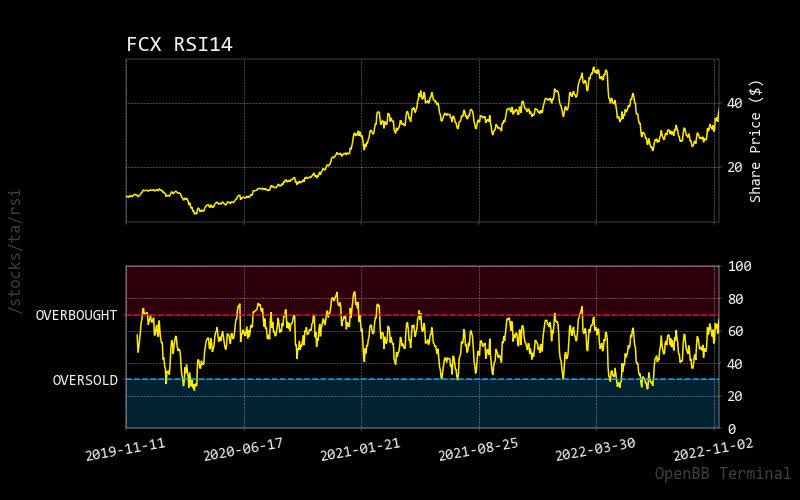
Prediction Via Artificial Intelligence
Monte Carlo
This Monte Carlo simulation convincingly shows that Freeport’s expected stock price should rise since there are many more upward-moving predictive paths. Also, the accompanying normalized distribution shows a higher stock price expectation.
fcx monte carlo (custom platform)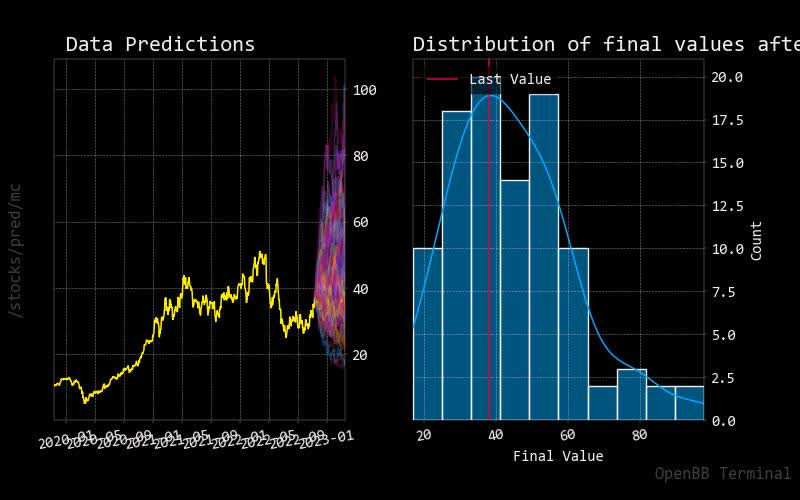
Risk Positively Supports Stock Market Direction
Short Volume vs. Total Trading Volume
As Freeport’s stock price continues to accelerate quickly, fewer short trades are placed against the total trading volume. This also confirms that we are in the early stages of a potential big upward move for the stock price.
fcs shorting volume (custom platform)
Sustainability
Interestingly, polluting industrial companies are the ones with ‘outperforming’ sustainability ratings. However, this is necessary for a company like Freeport to continue with solid stock performance compared to high-performing big technology companies.
|
Metric |
Value |
|
Social score |
10.15 |
|
Peer count |
28 |
|
Governance score |
5.22 |
|
Total esg |
31.94 |
|
Highest controversy |
4 |
|
ESG performance |
OUT_PERF |
|
Percentile |
69.88 |
|
Peer group |
Diversified Metals |
Source: Yahoo Finance
Due Diligence Analyst Price Target
As other market analysts set their stock price targets for Freeport, it has been able to meet those expectations reasonably. So, it can be a fairly positive sign, but this might be due to the low number of analysts projecting targets.
fcx target (custom platform)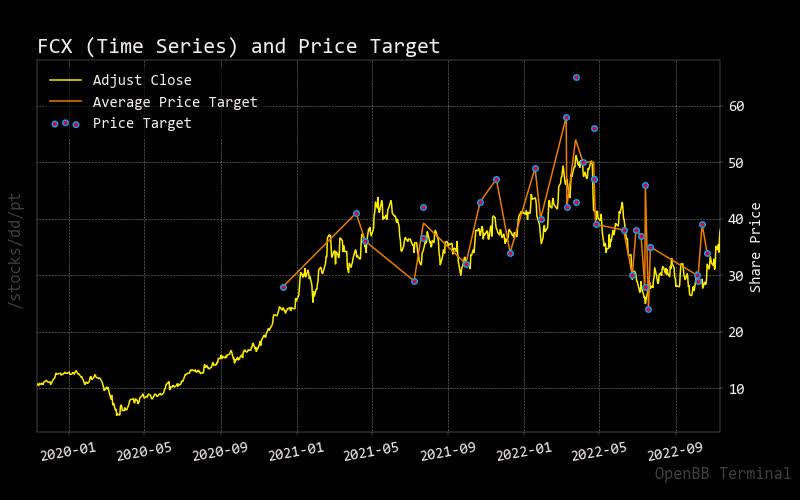
Recommendation
Other market analysts show strong buying recommendations for this company. Based on this year’s return, it is no wonder they are noticing Freeport compared to additional subpar-performing equity.
|
Interval |
RECOMMENDATION |
BUY |
SELL |
NEUTRAL |
|
One month |
BUY |
15 |
1 |
10 |
|
One week |
BUY |
15 |
2 |
9 |
|
One day |
BUY |
14 |
2 |
10 |
Source: Trading View
Insider Activity
Over the last few months, some Freeport executives have been buying large amounts of stock, confirming its stock price will continue to increase.
|
Date |
Shares Traded |
Shares Held |
Price |
Type |
Option |
Insider |
Trade |
|
2022-08-28 |
31,000.00 |
32,132.00 |
31.88 |
Buy |
No |
WHITMIRE C DONALD JR |
31000.0 |
|
2022-09-30 |
1,143.00 |
22,487.00 |
27.33 |
Buy |
No |
Robertson Maree E. |
1143.0 |
|
2022-09-30 |
686.00 |
48,512.00 |
27.33 |
Buy |
No |
Robertson Maree E. |
686.0 |
Source: BusinessInsider
Conclusion
Considering solid fundamentals and near-optimal market entries based on technical analysis, this mining company may provide long-term returns over the next few months. Based on forward guidance estimates, Freeport should continue to drive slower growth profit over the next few years, suggesting one should add this company to an investment portfolio. As hinted at by other market analysts providing a buy rating, I would also offer the same view.
Be the first to comment