

Nicholas Wright
Introduction
The Toronto-based Franco-Nevada (NYSE:FNV) released its second quarter of 2022 results on August 10, 2022.
Note: I have been covering FNV quarterly on Seeking Alpha since Mars 2017. This article is an update of my preceding article published on May 9, 2022.
Franco Nevada owns 413 assets worldwide:
FNV Map Presentation (Franco Nevada Presentation)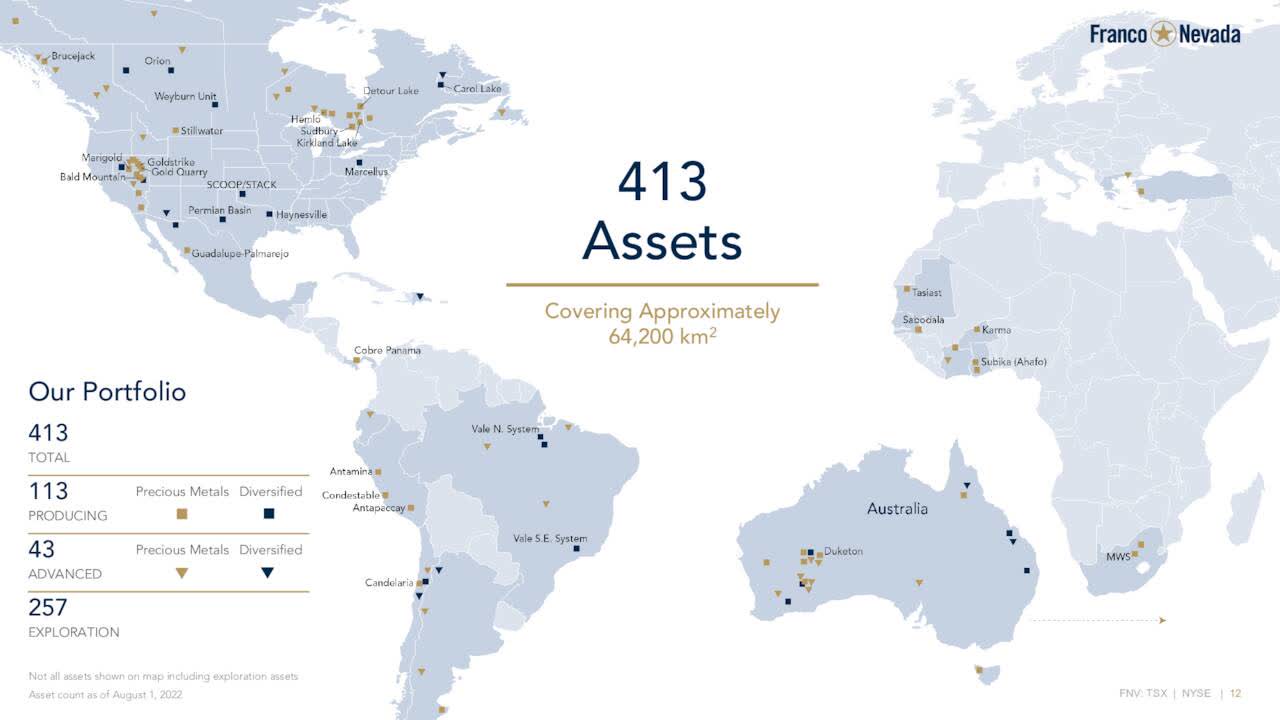
1 – 2Q22 Quick Snapshot
Franco-Nevada came out with adjusted quarterly earnings of $1.02 per share or $195.8 million, beating analysts’ expectations. The company generated $352.3 million in the second quarter, up 1.5% from last year’s same quarter.
Metals production was lower than a year ago, with 131,574 GEOs sold compared with 145,937 GEOs last year. Higher contributions from Hemlo, Gold Quarry, and Subika (Ahafo) were not enough to offset lower deliveries from Antamina, Guadalupe, Goldstrike, and Stillwater.
However, this quarter’s energy revenues were very high and reached $91.5 million.
The company sold 191,052 GEOs in 2Q22, including the Energy revenues, down slightly from last year’s quarter of 192,379 GEOs.
Below are the revenues per segment in the second quarter of 2021:
FNV Quarterly revenues per segment in 2Q22 (Fun Trading)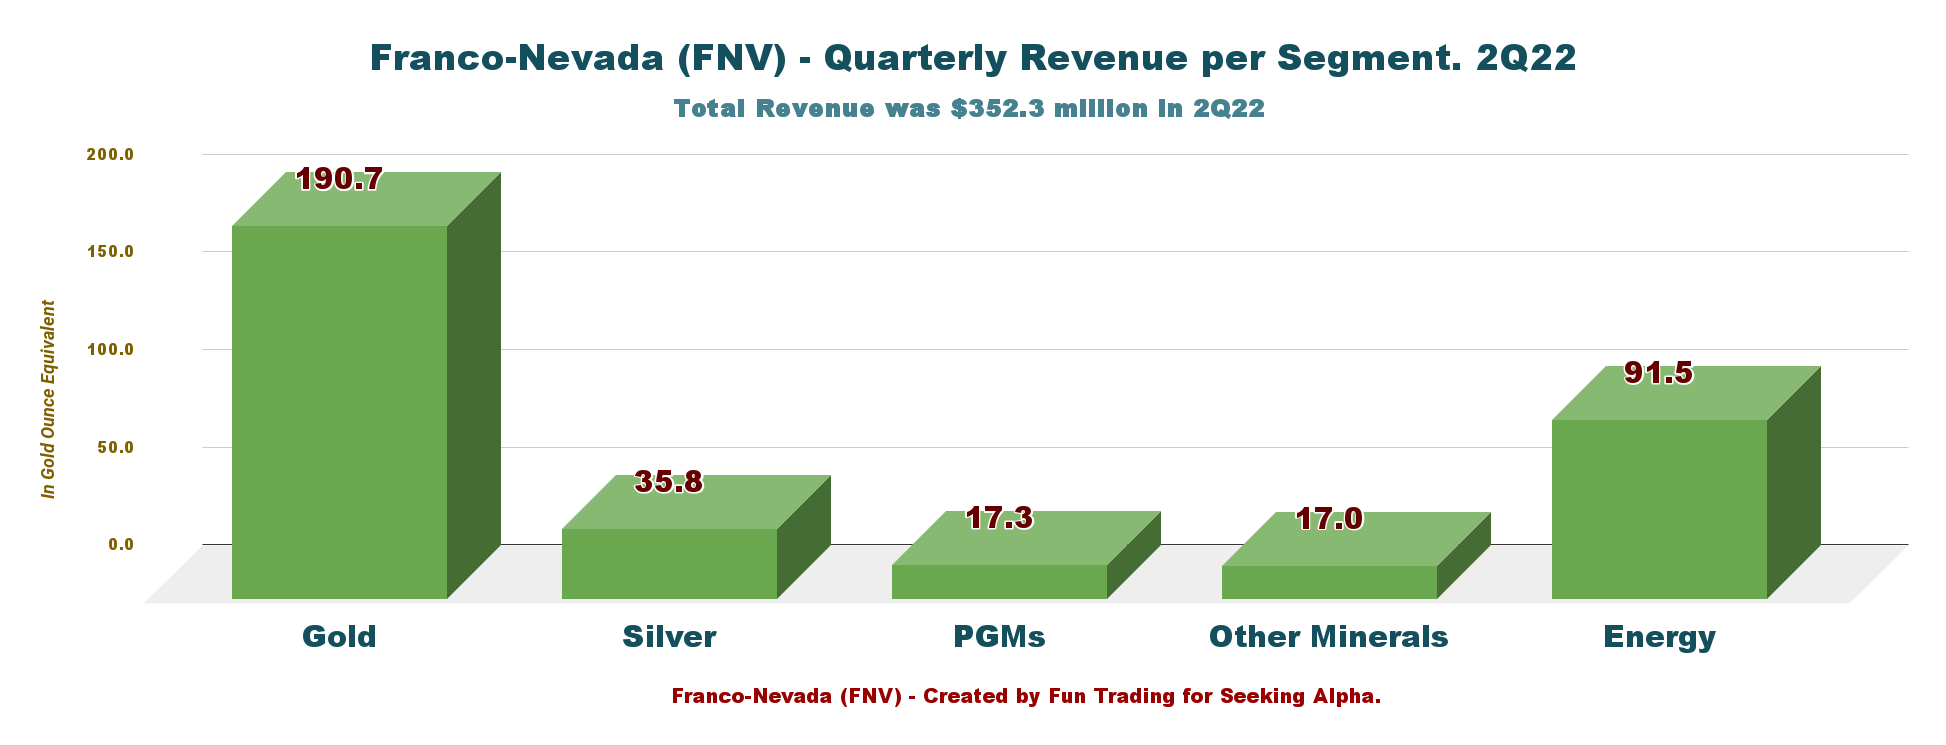
The company is highly dependent on the gold price, representing 54.13% of the total revenues in 2Q22. The energy sector is growing significantly and now represents 30%.
2 – Stock Performance
As I have indicated for years, Franco-Nevada is one of my most significant long-term investments in the streaming sector, followed closely by Wheaton Precious Metals (WPM).
The company’s fundamentals are flawless, with no debt and a cash position of $910.6 million, up strongly quarter over quarter.
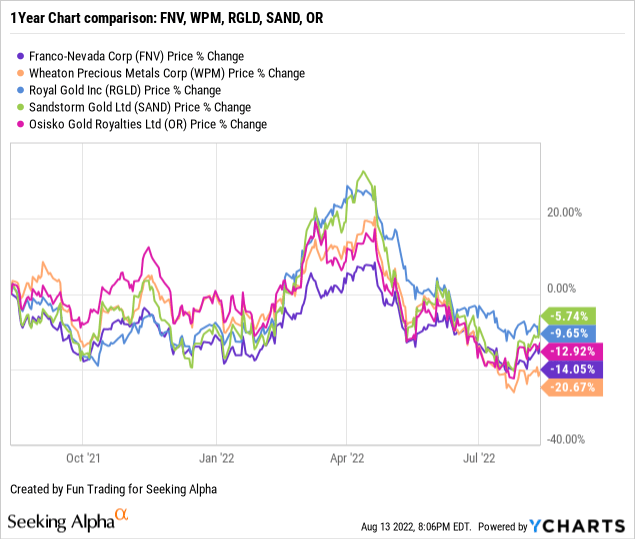
FNV has followed its competitor Wheaton Precious Metals closely. FNV is down 14% on a one-year basis, whereas WPM is down 21%. Meanwhile, Sandstorm Gold (SAND) outperforms the group and is down 6%.
3 – Investment Thesis
The investment thesis continues to be the same quarter after quarter. Franco Nevada presents a great low-risk profile with 91% of assets owned located in the Americas.
FNV Assets presentation by Region (Franco Nevada Presentation)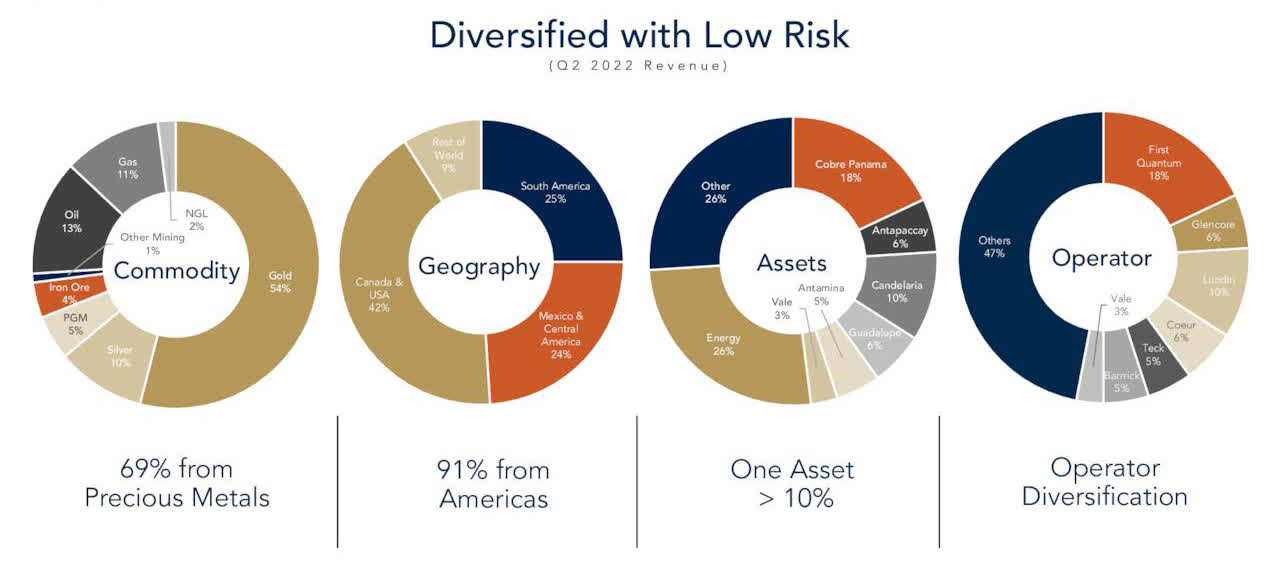
However, one recurring disappointment is the lack of a decent dividend with a yield of 1.23%. The company can certainly afford to increase the dividend with a solid free cash flow generation reaching now $934.1 million ttm.
However, Franco Nevada is highly dependent on commodity prices and fluctuates widely. Thus, I recommend short-term trading LIFO 40% of your position and keeping the remaining for a much higher target.
This dual strategy has been my dominant strategy recommended in my marketplace, “The Gold and oil corner,” and it is the best way to maximize your gain over a long period.
Franco-Nevada – A Solid Balance Sheet and Production in 2Q22. The raw numbers.
| Franco-Nevada | 2Q21 | 3Q21 | 4Q21 | 1Q22 | 2Q22 |
| Total Revenues in $ Million | 347.1 | 316.3 | 327.7 | 338.8 | 352.3 |
| Net income in $ Million | 175.3 | 166.0 | 220.9 | 182.0 | 196.5 |
| EBITDA $ Million | 282.2 | 270.0 | 341.4 | 285.3 | 302.8 |
| Adjusted EBITDA $ Million | 290.0 | 269.8 | 269.8 | 286.6 | 301.2 |
| EPS diluted in $/share | 0.92 | 0.87 | 1.16 | 0.95 | 1.02 |
| Operating Cash Flow in $ Million | 245.2 | 206.9 | 279.0 | 230.6 | 257.3 |
| CapEx in $ Million | 543.6 | 7.1 | 19.2 | 3.1 | 10.3 |
| Free Cash Flow in $ Million | -298.4 | 199.8 | 259.8 | 227.5 | 247.0 |
| Total cash $ Million | 197.7 | 346.7 | 423.0 | 722.7 | 910.6 |
| Long-term Debt in $ Million | 0 | 0 | 0 | 0 | 0 |
| Dividend per share in $ | 0.30 | 0.30 | 0.32 | 0.32 | 0.32 |
| Shares outstanding (diluted) in Million | 191.4 | 191.5 | 191.3 | 191.7 | 191.9 |
| GEOs | 2Q21 | 3Q21 | 4Q21 | 1Q22 | 2Q22 |
| Production gold equivalent K Oz Eq. | 166,856 | 146,495 | 138,799 | 139,685 | 131,574 |
| Production GEO, including Energy | 192,379 | – | 182.543 | 178,614 | 191,052 |
| Gold price | 1,816 | 1,789 | 1,795 | 1,874 | 1,872 |
Data Source: Company document
Note: More historical data starting in 2015 are available for subscribers only.
Analysis: Revenues, Earnings Details, Free Cash Flow, Debt, And Production Details
1 – Revenues were $352.3 million in 2Q22
FNV Quarterly Revenues history (Fun Trading) During the second quarter of 2022, the company generated $352.3 million, up from $347.1 million in the same quarter a year ago and up 4% sequentially. Net income came in at $196.5 million, $1.02 per diluted share, and $195.8 million adjusted net income, or $1.02 per share.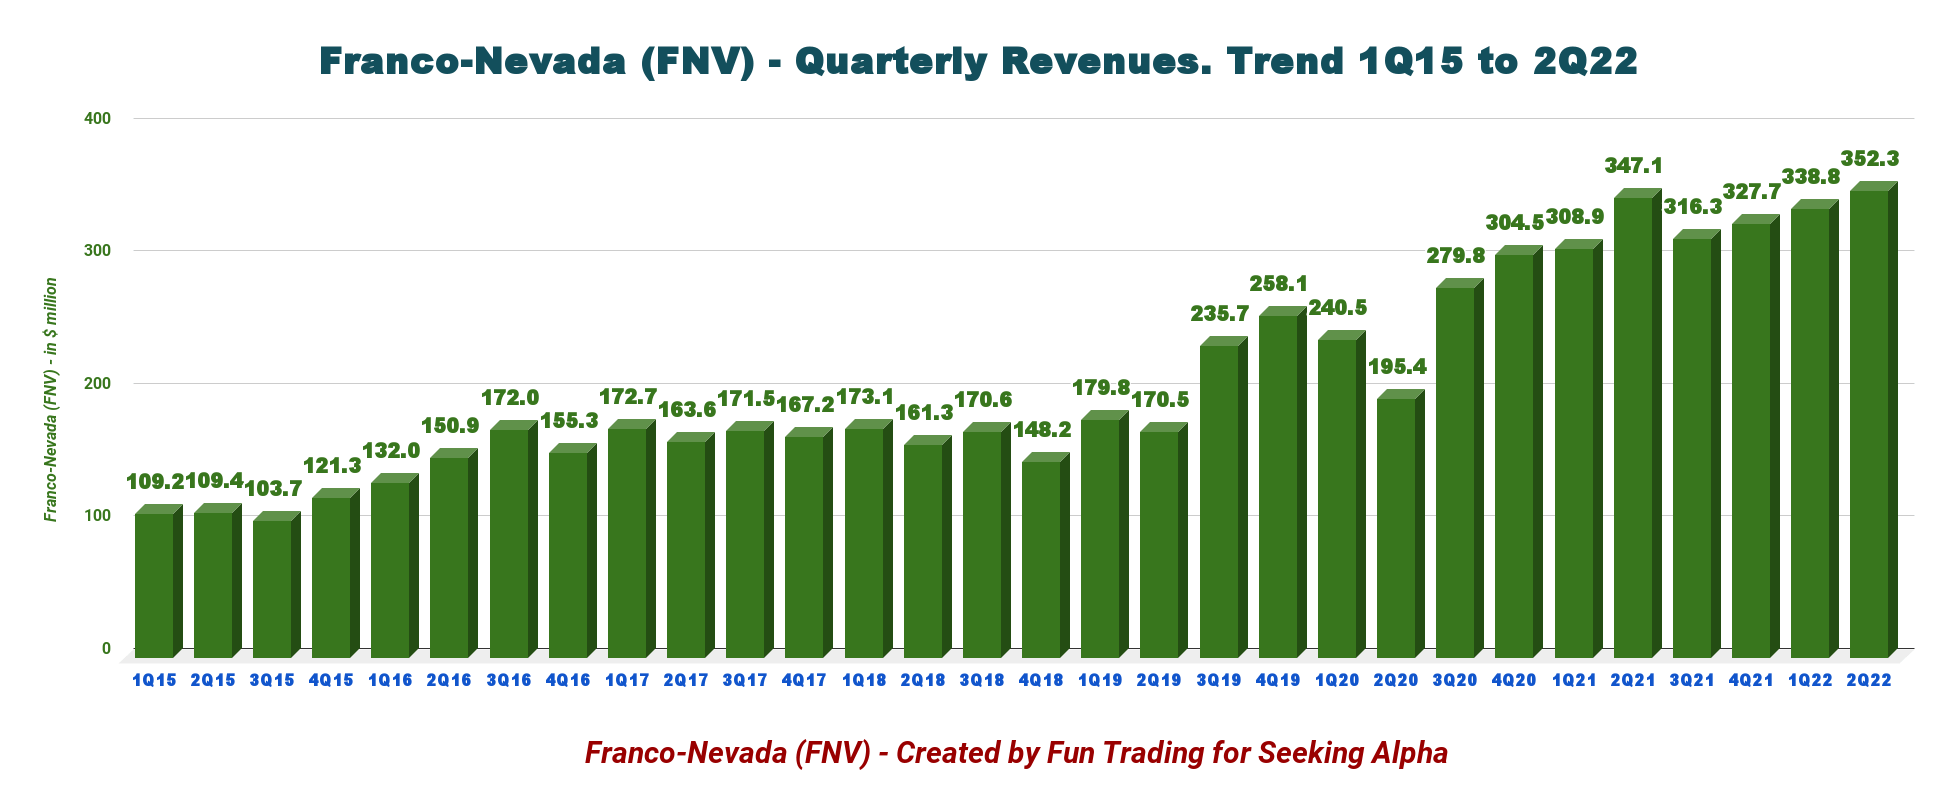
Adjusted EBITDA increased 3.9% from 2Q21 to $301.2 million during the second quarter.
Oil and gas assets added $91.5 million to Franco-Nevada’s overall quarter results. Revenues from the company’s energy assets reached a new record above $75.6 million in 1Q22.
CEO Paul Brink said in the conference call:
Our top line precious metals stream and royalty interests helped generate our highest ever margins since adding streaming to our business, over 85% for adjusted EBITDA and 55% for adjusted net income. High energy prices in this environment are positive for us and drove an increase in our diversified GEOs, partly offset by marginally lower precious metal GEOs sold.
2 – Free Cash Flow Was $247 million in 2Q22
FNV Quarterly Free cash flow history (Fun Trading) Note: The free cash flow is cash from operating activities minus CapEx.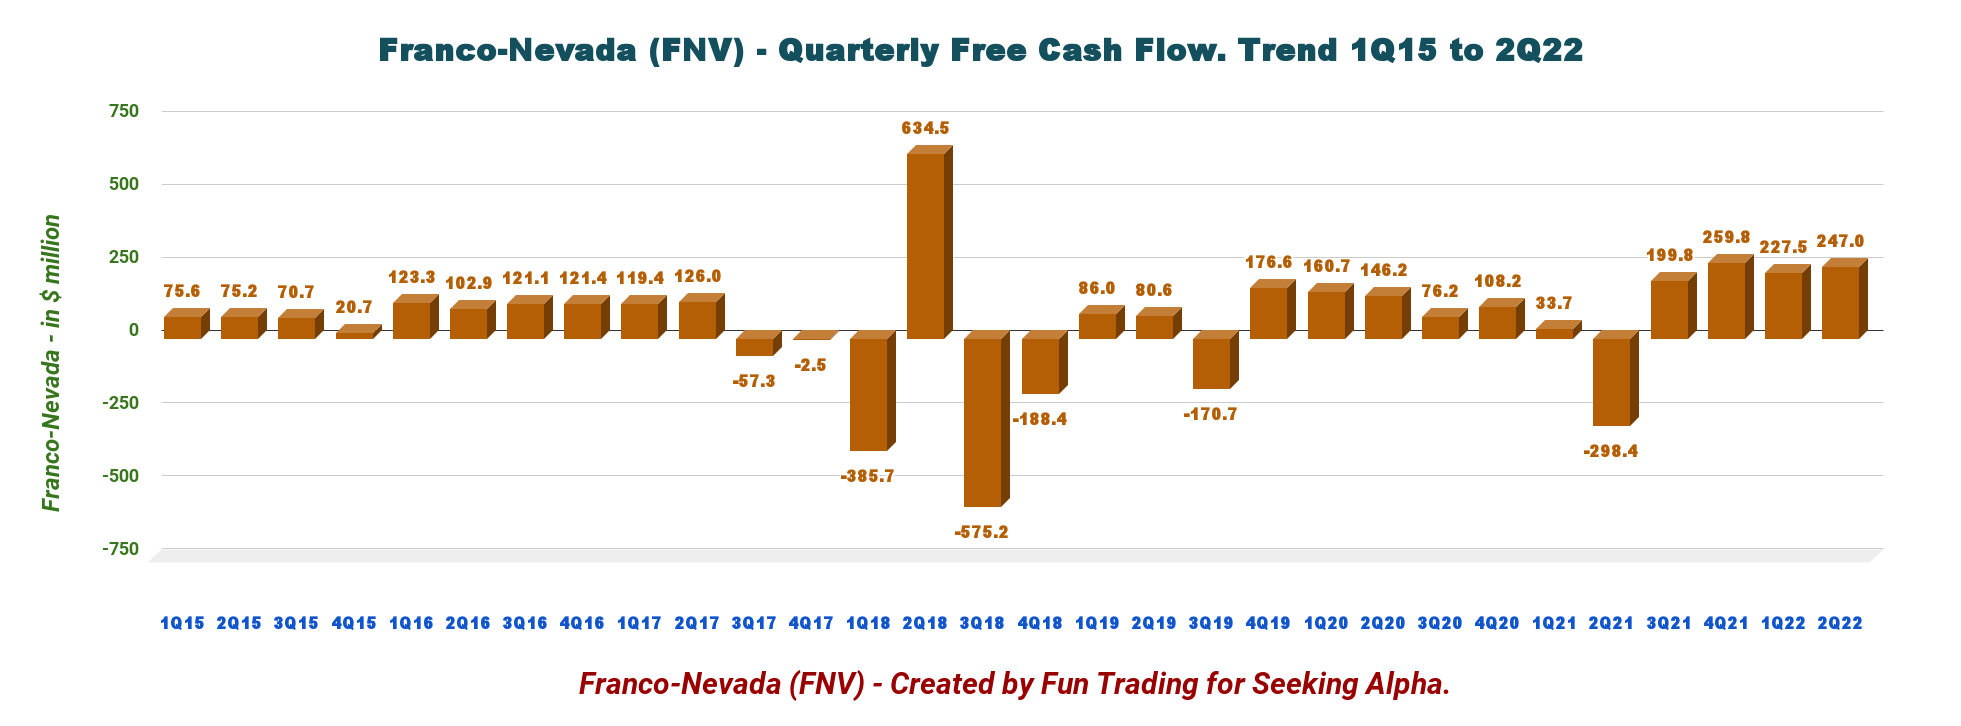
This quarter, the company earned $247.0 million in free cash flow and a trailing 12-month free cash flow of $934.1 million.
Franco-Nevada announced that its Board of Directors had declared a quarterly dividend of $0.32 per share in 2Q22.
3 – The Company Has No Debt And $1.9 billion In Available Capital As Of June 30, 2022
Franco-Nevada continues to deliver a perfect financial profile with cash and cash of hand of $910.6 million in 2Q22 and no debt.
Franco-Nevada has a credit facility of $1.1 billion and $1.9 billion in liquidity.
FNV Quarterly Cash versus Debt history (Fun Trading)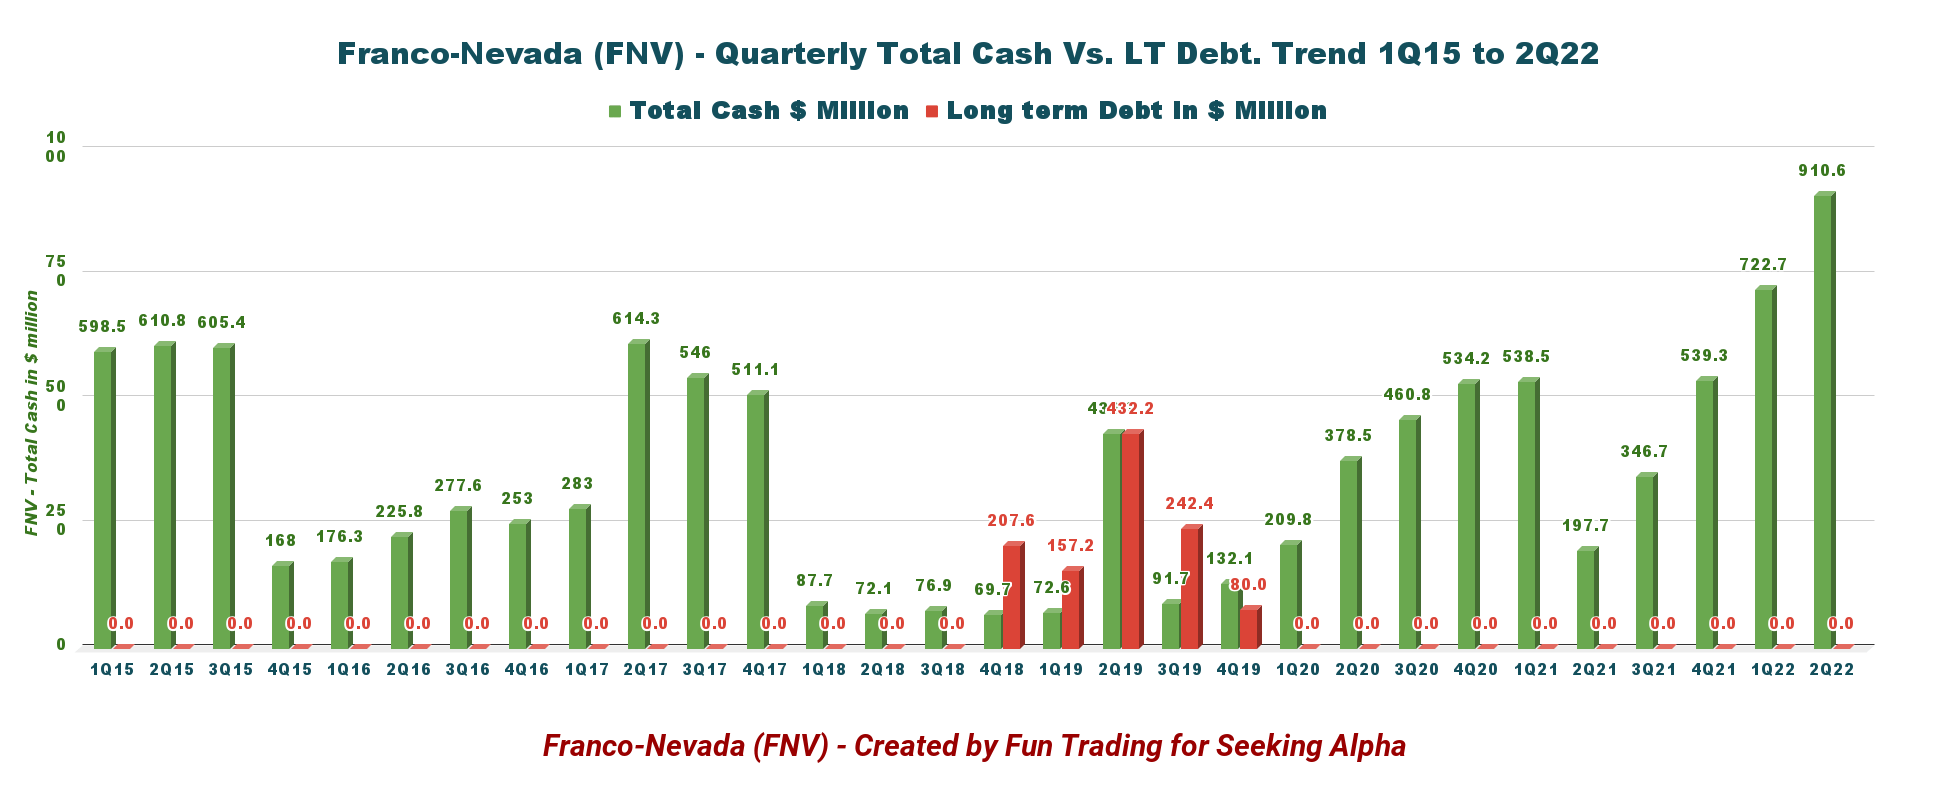
4 – Production in Gold Equivalent Ounces Was 131,574 GEOs in 2Q22 and 191,052 GEOs, Including The Energy Assets.
FNV Quarterly GEO production history (Fun Trading)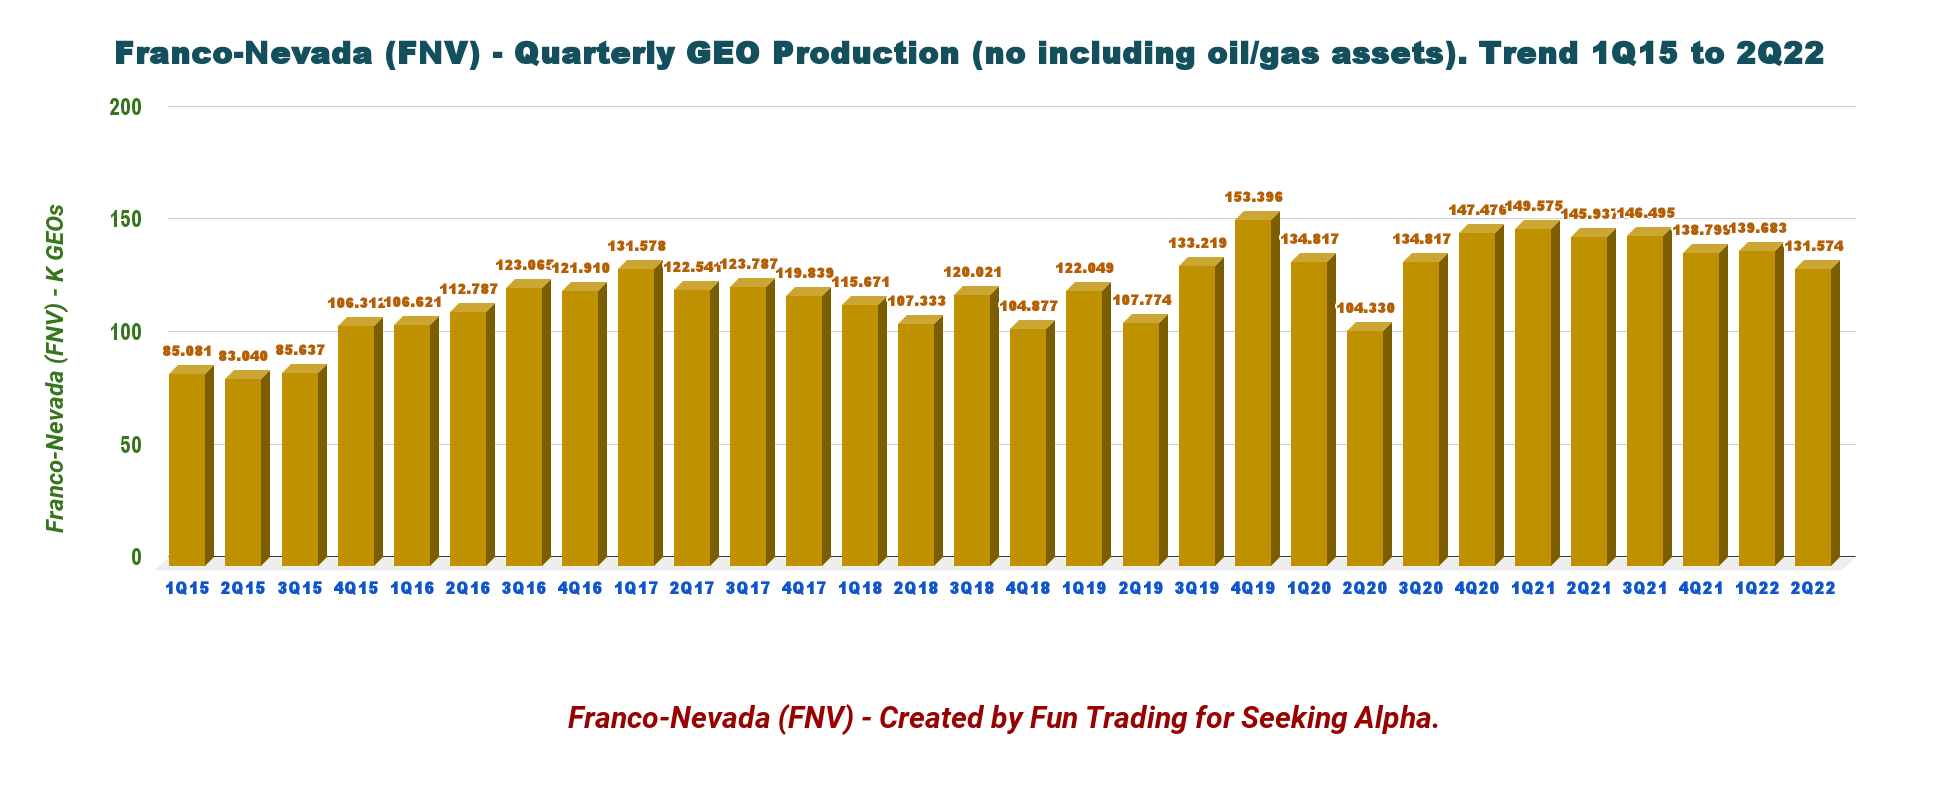
Franco-Nevada stated that it sold 131,574 gold equivalent ounces in 2Q22, significantly down from 145,937 GEOs in the same quarter a year ago.
The total production was 191,052 GEOs, down slightly from 192,379 GEOs in 2Q21.
Gold represented 53.8% of the total output in 2Q22, including energy.
Details per segment are presented below:
FNV Quarterly Production per segment in 2Q22 (Fun Trading)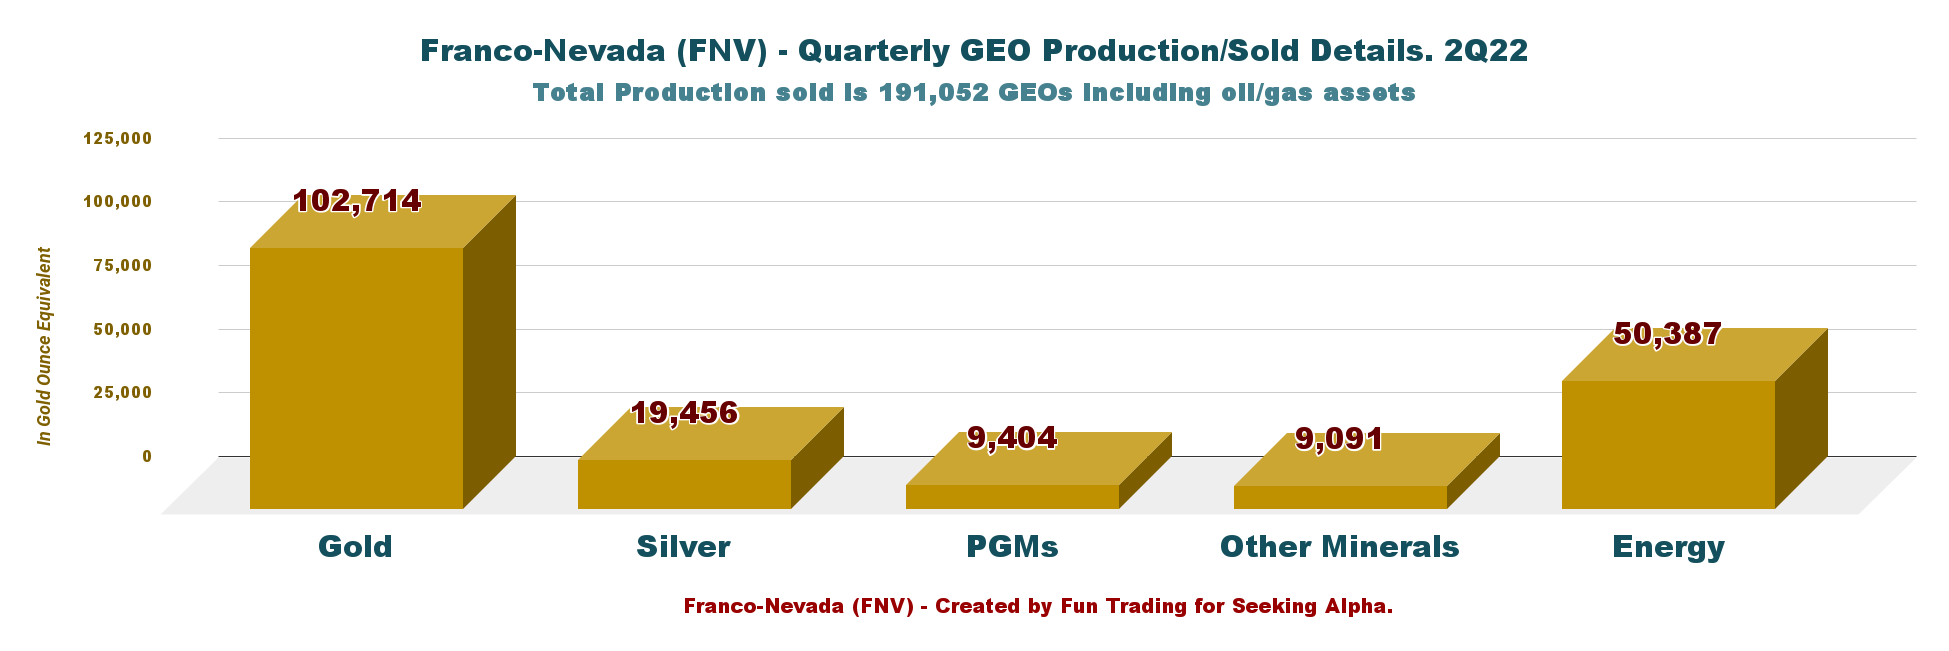
- the average gold price was $1,872/oz
- Silver prices averaged $22.64/oz.
- Finally, platinum prices averaged $957/oz, and palladium prices averaged $2,092/oz.
5 – Guidance 2022. Franco Nevada Remains On Track To Meet Its Previously Announced 2022 GEO Guidance
FNV 2022 Guidance (Franco Nevada Presentation)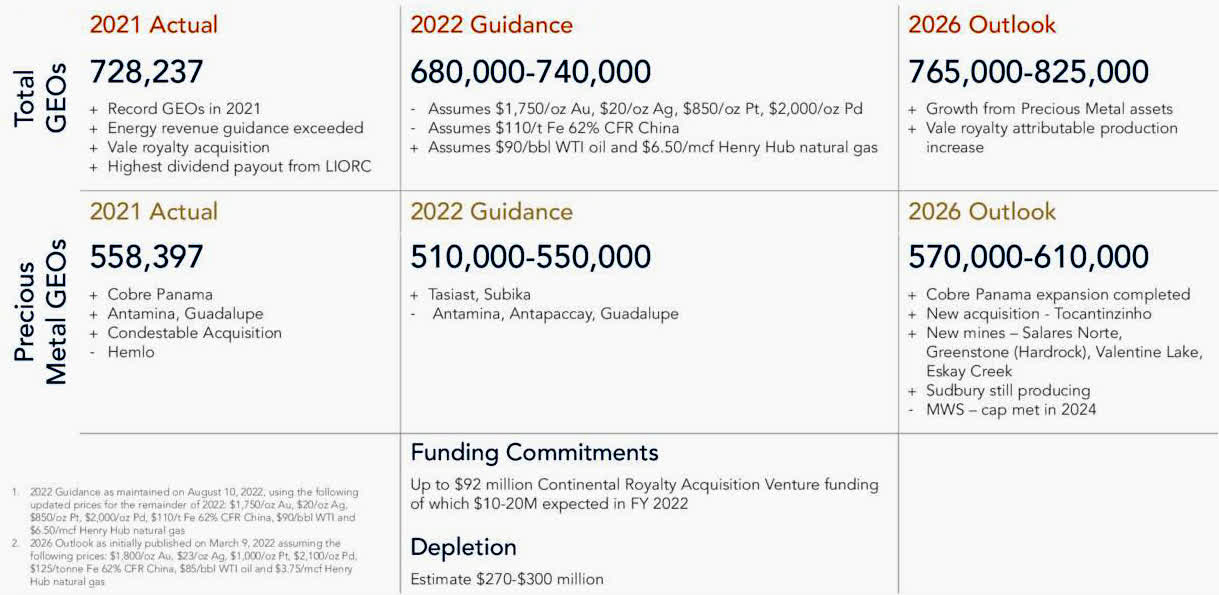
Technical Analysis And Commentary
FNV TA Chart short-term (Fun Trading StockCharts)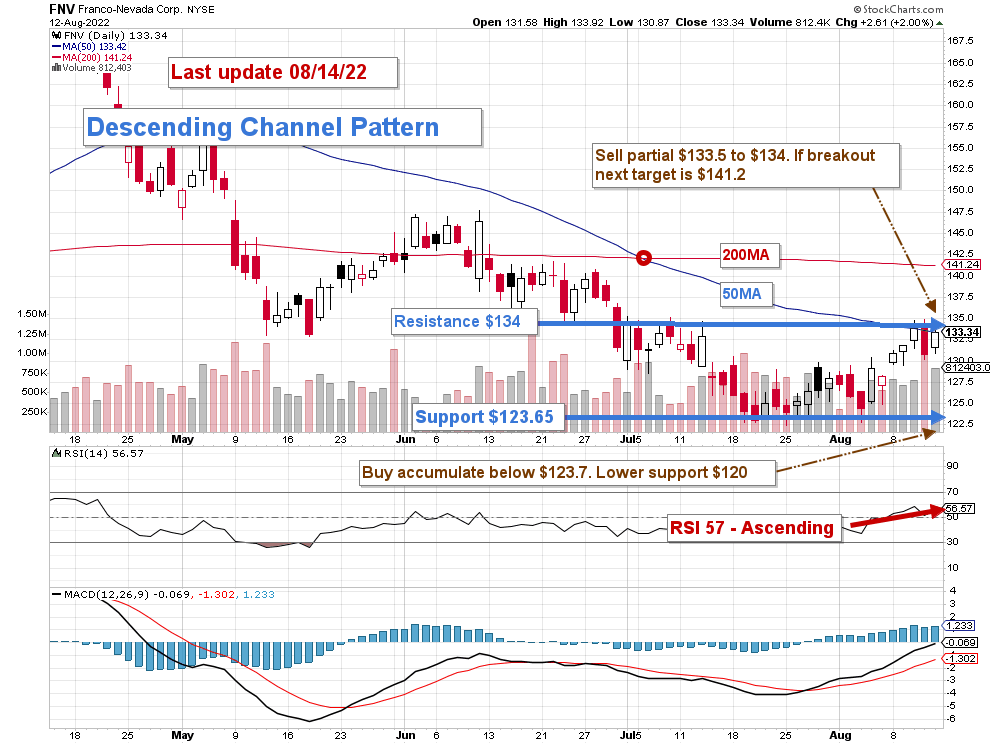
Note: The chart has been adjusted for the dividend.
FNV forms a descending channel pattern with resistance at $134.0 and support at $123.65.
The trading strategy for this quarter has not changed since my preceding article. The dominant strategy that I regularly encourage in my marketplace, “The gold and oil corner,” is to keep a core long-term position and use about 25%-35% to trade LIFO while waiting for a higher final price target for your core position.
Trading LIFO allows you to sell your most recent purchases with a profit while keeping your long-term position often underwater until the stock has appreciated enough to consider selling your core position.
I suggest buying FNV below $127.7 with potential lower support at $120. Conversely, it is reasonable to take profits between $133.5 and $134 with higher resistance at $141.2.
Note: The LIFO method is prohibited under International Financial Reporting Standards (IFRS), though it is permitted in the United States to generally accepted accounting principles (GAAP). Therefore, only US traders can apply this method. Those who cannot trade LIFO can use an alternative by setting two different accounts for the same stock, one for the long term and one for short-term trading.
Warning: The TA chart must be updated frequently to be relevant. It is what I am doing in my stock tracker. The chart above has a possible validity of about a week. Remember, the TA chart is a tool only to help you adopt the right strategy. It is not a way to foresee the future. No one and no..thing can.
Author’s note: If you find value in this article and would like to encourage such continued efforts, please click the “Like” button below as a vote of support. Thanks.
Be the first to comment