


MicroStockHub/iStock via Getty Images
Written by Nick Ackerman, co-produced by Stanford Chemist. This article was originally published to members of the CEF/ETF Income Laboratory on October 14th, 2022.
BlackRock Floating Rate Income Strategies Fund (NYSE:FRA) and BlackRock Floating Rate Income Trust (NYSE:BGT) were two of the latest changes in payouts from the BlackRock lineup of funds. Fortunately, these two funds were distribution boosts for their shareholders. Since they are funds with floating rate exposure, this was mostly expected.
In fact, as rates continue to get pushed higher by the Fed, we could probably see even more increases in the future. At the same time, both of these funds are quite attractively priced with deep discounts. These discounts have come from the fact that there are credit risks in the holdings. Since they are issued by below-investment-grade companies, there is a greater risk of defaults or bankruptcies during a tough economic period. Therefore, investors are selling the funds off faster than the actual underlying performance of the portfolios.
Here’s a look at the YTD total share price and total NAV return performance between these two funds. We can clearly see that the total NAV returns have been holding up significantly better relative to the share prices. Thus, the latest wide discounts we’ve seen appearing.
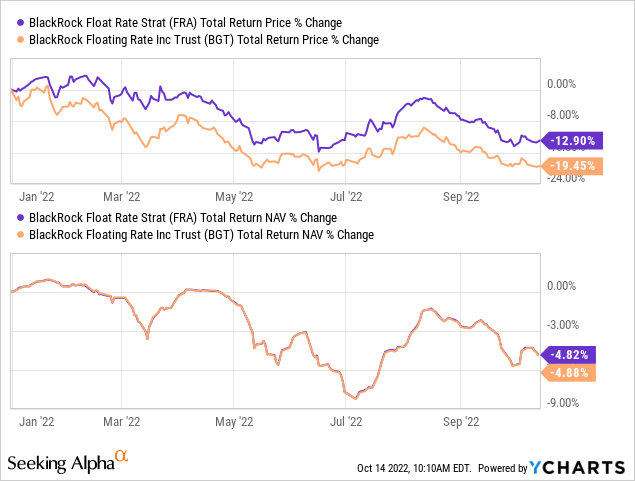
Ycharts
Rising rates are very likely to put the economy in a tough period as the Fed works to slow down the economy to combat inflation; hence, why the discounts have been opening up on the uncertainty of how bad of an economic slowdown there will be.
That being said, just because there is a default or bankruptcy doesn’t mean there is no recovery in some of the loans. Recoveries have actually been fairly strong, according to a report from Fitch. Of course, that’s only looking at historical data and doesn’t guarantee future results.
The latest UNII report showed that the distribution coverage ratio was topping out at over 100% for both FRA and BGT. That was for the end of August 2022. Then there was another 75 basis point increase from the Fed in September. With at least one, if not two, more 75 basis point increases coming through the end of this year.
That will only see even more net investment income from these funds. In turn, that will essentially mean that the new distributions are likely being or going to be covered by NII.

BlackRock UNII Report (BlackRock)
However, one might note that UNII is still negative. For distribution changes, the direction of NII seems to mean more than what UNII is showing. UNII is simply undistributed net investment income. So it only tells us where the payout has been, but not where the payout could go.
BlackRock Floating Rate Income Strategies Fund
- 1-Year Z-score: -1.67
- Discount: 11.85%
- Distribution Yield: 8.71%
- Expense Ratio: 1.17%
- Leverage: 28.69%
- Managed Assets: $613.7 million
- Structure: Perpetual
FRA’s investment objective is “to provide shareholders with high current income and such preservation of capital as is consistent with investments in a diversified, leveraged portfolio consisting of floating-rate debt securities and instruments.”
To achieve this investment objective, “at least 80% of its assets in floating rate debt securities, including floating or variable rate debt securities that pay interest at rates that adjust whenever a specified interest rate changes and/or which reset on predetermined dates.” As is typical with these sorts of funds – the portfolio “invests a substantial portion of its investments in floating rate debt securities consisting of secured or unsecured senior floating rate loans that are rated below investment grade.”
It hasn’t been too long since we last covered FRA. However, in this volatile market, a lot can happen. We’ve seen a distribution boost, but a lower price has also pushed up the distribution yield along with that boost. The volatility in the market has also pushed the fund to an even wider and what I’d consider an even more attractive discount.
The boost for FRA was good for a 20.5% raise, taking the monthly payout from $0.0667 to $0.0804. This was the first increase from this fund since rates have been rising. These funds tend to focus on more of a level payout to shareholders rather than adjusting more regularly. For floating rate funds, being so sensitive to interest rate changes means they tend to see fairly regular changes, relatively speaking.

FRA Distribution History (CEFConnect)
Looking at this another way, the fund is now paying well above its historical distribution level. That is due to the lower share price, but with strong coverage, I think it is attractive.
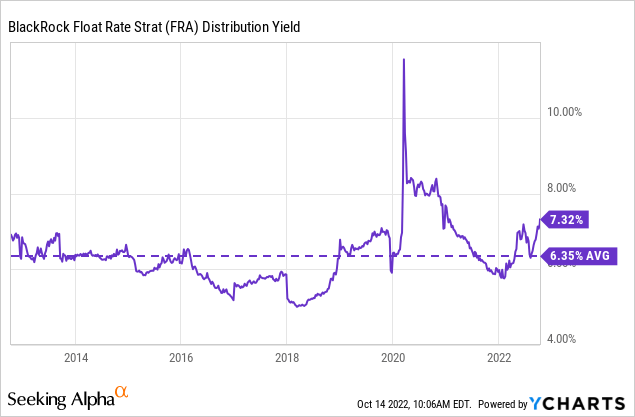
Ycharts
The fund’s effective duration is incredibly low at 0.33 years. That’s common for these floating-rate loan funds. That’s part of why they are a hedge relative to other debt that is fixed-rate in nature.
Despite this, we’ve seen the fund’s discount widen considerably. It’s wider than its historical range and bouncing near the lows we saw from 2019 through the COVID pandemic.
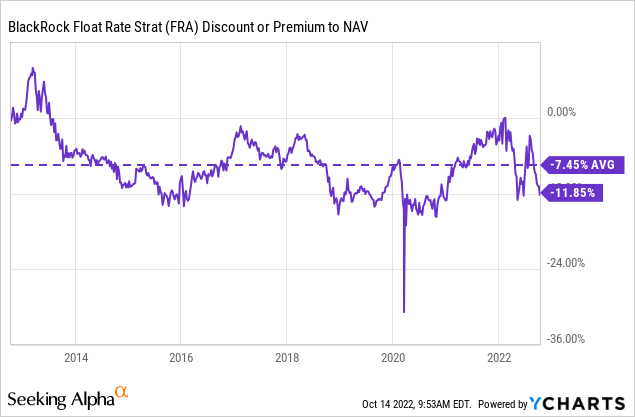
Ycharts
BlackRock Floating Rate Income Trust
- 1-Year Z-score: -1.39
- Discount: 12.30%
- Distribution Yield: 8.76%
- Expense Ratio: 1.18%
- Leverage: 28.92%
- Managed Assets: $378.8 million
- Structure: Perpetual
BGT’s investment objective is “to provide a high level of current income.” To achieve this, the fund will invest “at least 80% of its assets in floating and variable rate instruments of US and non-US issuers, including a substantial portion of its assets in global floating and variable rate securities including senior secured floating rate loans made to corporate and other business entities.”
For BGT, it has been quite some time since I’ve covered this fund specifically. It carries many similarities to FRA overall. Nearly the same expense ratio, even for being a smaller fund. The leverage utilized by the fund is fairly high, but it is typical of these types of funds. The effective duration for the portfolio also comes in at the exact same 0.33 years.
Even the distribution increase for BGT was quite similar to FRA’s at an increase of 20.7%. It went from a monthly payout of $0.0647 to $0.0781. That isn’t too surprising to see such similarities either, considering the distribution coverage was quite similar in the latest UNII report. BGT had a slightly better coverage ratio of half a percent. This was also BGT’s first increase in this latest rate hiking cycle.

BGT Distribution History (CEFConnect)
Looking at the distribution yield over the last decade, we can see almost a mirror image of what we saw from FRA above. Again, the higher distribution yield is a function of the prices declining. Since the distribution coverage is quite strong and likely to improve, this is a positive development.
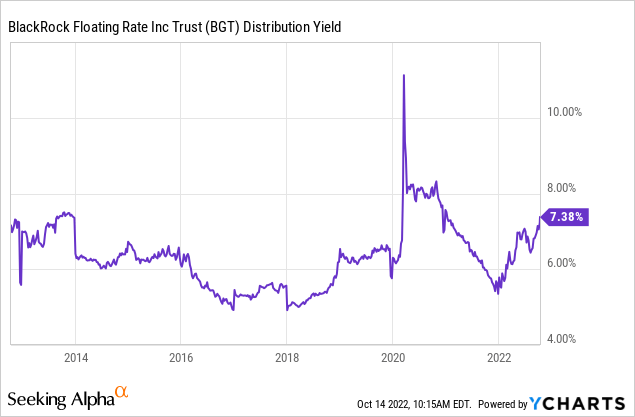
Ycharts
The fund’s discount also shows that BGT is trading above its longer-term average level. Both of these funds had surging valuations heading into the end of 2021. The credit risks have completely taken over, though, and pushed the discounts back to near the lows of the last decade – excluding the COVID crash period.
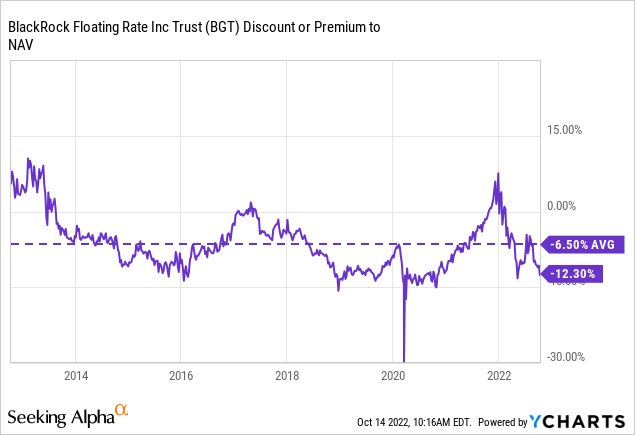
Ycharts
One interesting thing to note for BGT is that the fund typically trades at a narrower discount than FRA. Yet, at this time is sporting an even wider discount as of the latest closing on October 13th. I hold FRA but not BGT. I had at one time in the last rate hiking cycle. That being said, the difference in the valuation at this time isn’t necessarily significant enough to make a swap an obvious choice.
Conclusion
Both FRA and BGT recently raised their distributions. This seems like an obvious outcome as floating rate funds in a rising rate environment. However, despite the underlying portfolios doing quite well, the credit risks of their portfolios seem to be making investors nervous. That has punished the actual share price of these funds, opening up to the latest discounts. I feel that these are attractively valued at this time. But I concede that – at least for FRA – the market doesn’t agree with me.
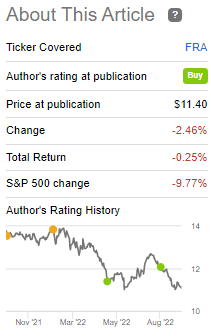
FRA Performance Since May Update (Seeking Alpha)
I originally went bullish on FRA in May. Then again, just at the end of August. In May, the discount stood at around 13%. It then narrowed in August to ~7%. Now it is pushing a nearly 12% discount once again. That has played at least one role in the losses generated since the August update.
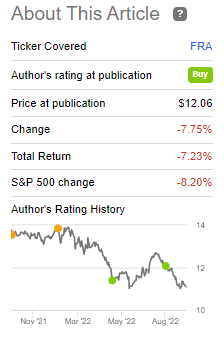
FRA Performance Since August Update (Seeking Alpha)
FRA has produced losses each of these times, holding up much better than the S&P 500, but that isn’t an appropriate benchmark. It can help provide some context. Over the long run, equities should be able to smoke loan investments. If one takes more risks, one should expect to be rewarded better. At least, that is the general idea.
At the end of the day, the higher income generated leading to higher distributions from the funds is a welcomed sign that things are still working on that front.
Be the first to comment