

kanawatvector
|
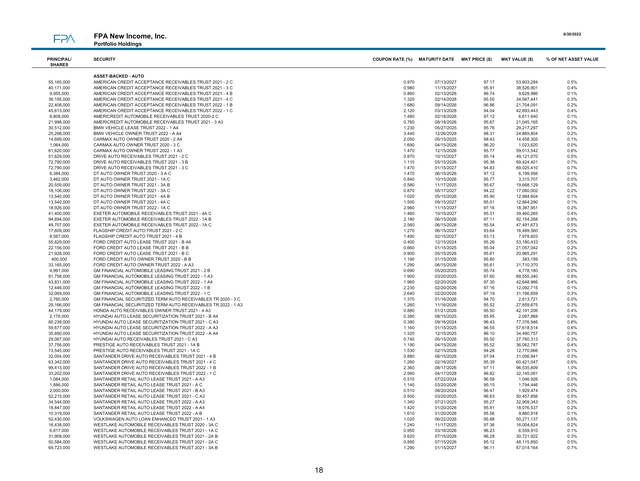
As of June 30, 2022 |
30 Years |
20 Years |
15 Years |
10 Years |
5 Years |
3 Years |
1 Year |
YTD |
QTR |
|
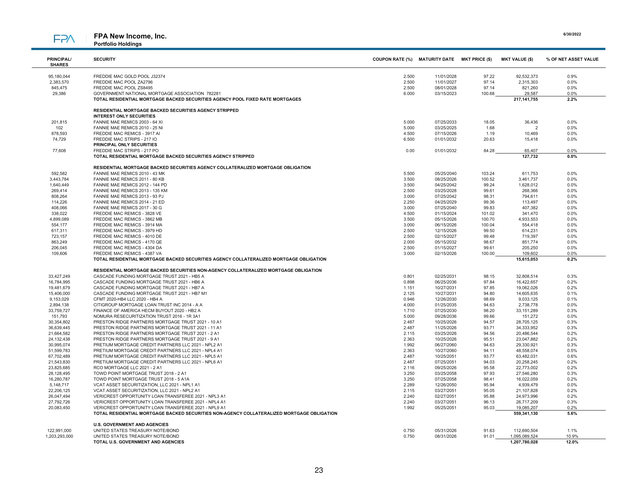
FPA New Income, Inc. |
4.36 |
2.52 |
2.16 |
1.50 |
1.60 |
0.60 |
-2.60 |
-2.75 |
-1.03 |
|
Bloomberg US Agg Bond |
4.81 |
3.57 |
3.26 |
1.54 |
0.88 |
-0.93 |
-10.29 |
-10.35 |
-4.69 |
|
CPI + 100 bps |
3.54 |
3.55 |
3.42 |
3.63 |
4.92 |
6.02 |
10.08 |
5.95 |
2.90 |
|
Bloomberg US Agg. 1-3 Yr |
NA |
2.23 |
1.92 |
0.99 |
1.02 |
0.21 |
-3.58 |
-3.13 |
-0.64 |
|
Past performance is no guarantee of future results and current performance may be higher or lower than the performance shown. This data represents past performance and investors should understand that investment returns and principal values fluctuate, so that when you redeem your investment it may be worth more or less than its original cost. Current month-end performance data, which may be higher or lower than the performance data quoted, may be obtained at www.fpa.com or by calling toll-free, 1-800-982-4372. As of its most recent prospectus, the Fund’s total expense ratio is 0.58% and net expense ratio is 0.45%. Periods greater than one year are annualized. FPA New Income, Inc. (“Fund”) performance is calculated on a total return basis which includes reinvestment of all distributions and is net of all fees and expenses. Fund returns do not reflect the deduction of taxes that a shareholder would pay on Fund distributions or the redemption of Fund shares, which would lower these figures. Comparison to any index is for illustrative purposes only. The Fund does not include outperformance of any index or benchmark in its investment objectives. An investor cannot invest directly in an index. The Total Annual Fund Operating Expenses before reimbursement is 0.58% (as of the most recent prospectus). Effective March 31, 2022, First Pacific Advisors, LP (“FPA” or the “Adviser”) has contractually agreed to reimburse expenses in excess of 0.45% of the average net assets of the Fund (excluding interest, taxes, brokerage fees and commissions payable by the Fund in connection with the purchase or sale of portfolio securities, and extraordinary expenses, including litigation expenses not incurred in the Fund’s ordinary course of business) through March 31, 2023. This agreement may only be terminated earlier by the Fund’s Board of Directors (the “Board”) or upon termination of the Advisory Agreement. You should consider the Fund’s investment objectives, risks, and charges and expenses carefully before you invest. The Prospectus details the Fund’s objective and policies, charges, and other matters of interest to a prospective investor. Please read the Prospectus carefully before investing. The Prospectus may be obtained by visiting the website at www.fpa.com, by email at crm@fpa.com, toll-free by calling 1-800-982-4372 or by contacting the Fund in writing. Please see important disclosures at the end of this update. |
Introduction
Dear Fellow Shareholders,
FPA New Income, Inc. (the “Fund”) returned -1.03% in the second quarter of 2022 and -2.75% year-todate.
As of June 30, 2022, the portfolio had a yield-to-worst[1] of 4.41% and an effective duration of 1.60 years. Risk-free rates continued to increase during the quarter as the Federal Reserve raised the Fed Funds rate, began reducing its bond holdings and guided the market toward additional monetary policy tightening in an attempt to bring down the highest inflation in over 40 years. Yields on 2- to 5-year maturity Treasury bonds increased by approximately 50-60 basis points (bps) during the second quarter while 10-year Treasury yields increased by 67 basis points.[2]
In addition, while still within historic norms, spreads on investment grade and high-yield rated debt increased during the quarter. Together, higher risk-free rates and higher spreads led to the worst bond market in generations, with lower prices across fixed income markets and more pronounced price declines in longer duration bonds and more credit-sensitive bonds.
We continue to take advantage of the higher yield environment to seek incrementally longer duration, high quality (rated single-A or higher) bonds since these bonds now offer what we believe is sufficient compensation for the duration risk (i.e., duration is cheaper). While higher spreads and yields have made credit (investments rated BBB or lower) more attractive, we are selectively investing in credit because we are concerned about credit risk and near-term mark-to-market risk. We proceed with caution, balancing near-term capital preservation and long-term returns.
The Fund’s credit exposure (investments rated BBB or lower) increased from 9.2% as of March 31, 2022 to 9.4% as of June 30, 2022. Floating rate[3] investments represented 31% of the Fund’s holdings at June 30, 2022. Cash and equivalents decreased from 2.3% of the portfolio as of March 31, 2022 to 1.0% on June 30, 2022. In addition, the Fund’s Treasury exposure was 12.0% at June 30, 2022.
Portfolio Attribution[4]
The largest contributors to performance during the quarter were Ginnie Mae project loan interest-only bonds. These bonds benefited from coupon payments and prepayment penalties offsetting price declines. There were no other meaningful contributors to performance at the sector level.
The largest detractors from performance during the quarter were the corporate holdings. Wider spreads led to lower bank loan and high-yield bond prices. High-yield bond prices were also negatively impacted by higher Treasury yields. Lastly, lower market-wide equity valuations negatively impacted the price of the Fund’s common stock holdings.
Common stock was 1.3% of the Fund’s holdings at June 30 and represents stocks received in exchange for corporate debt owned in the past. We intend to hold these common stock investments until they can be realized at a price that approximates our estimate of fair value while balancing the opportunity cost of that capital.
The second-largest detractors from performance during the quarter were collateralized loan obligations (CLOs), as wider spreads led to lower prices that were only partially offset by coupon payments. The third largest detractors from performance were asset-backed securities (ABS) backed by prime or subprime auto loans or leases. Prices of these ABS declined due to wider spreads and higher risk-free rates. Both CLOs and these ABS are relatively large exposures in the portfolio.
As a result, though these holdings were in the middle of the pack with respect to performance, both of these sectors are among the top detractors from the portfolio’s overall return during the quarter due to the combination of aggregate exposure and the total return on the investments themselves.
Despite the portfolio’s overall negative return during the quarter, the portfolio continues to perform well relative to the overall bond market and relevant indices.
Portfolio Activity
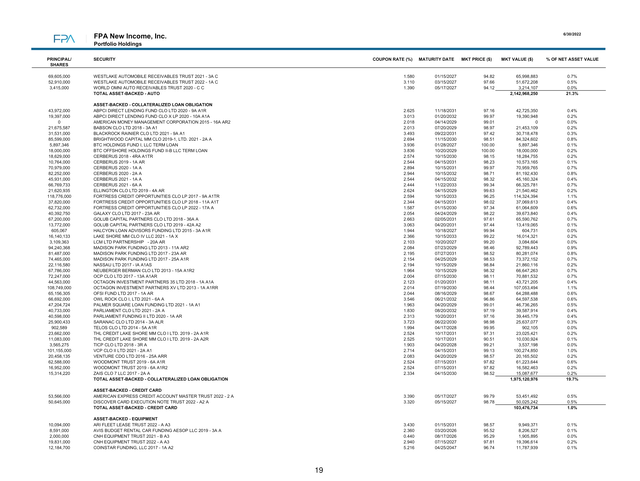
The table below shows the portfolio’s sector-level exposures of June 30, 2022 compared to March 31, 2022:
|
Sector |
% Portfolio 3/31/2022 |
% Portfolio 6/30/2022 |
|
ABS |
66.6 |
64.9 |
|
Mortgage Backed (CMO)5 |
6.6 |
5.7 |
|
Stripped Mortgage-backed |
0.4 |
0.4 |
|
Corporate |
5.0 |
5.4 |
|
CMBS5 |
7.3 |
8.4 |
|
Mortgage Pass-through |
2.2 |
2.2 |
|
U.S. Treasury |
9.6 |
12.0 |
|
Cash and equivalents |
2.3 |
1.0 |
|
Total |
100.0% |
100.0% |
|
Yield-to-worst6 |
2.90% |
4.41% |
|
Effective Duration (years) |
1.31 |
1.60 |
|
Average Life (years) |
2.02 |
2.29 |
Treasury yields and spreads on high-quality bonds (rated single-A or higher) increased during the quarter. Rather than adjusting the Fund’s duration to speculatively bet on the direction and timing of interest rates, we use price as our duration guide: when yields increase, duration is cheaper so we buy more duration; when yields decrease, duration is more expensive so we buy less duration. As yields on high-quality bonds have increased this year, we have been using our duration stress test to buy longer duration bonds.
That stress test seeks to identify the longest duration bonds that we expect will produce at least a breakeven return over the next 12 months, assuming the yield on a bond increases by 100 basis points during that time. As yields have increased, longer duration bonds have passed this test. Along those lines, during the second quarter we bought high-quality fixed rate bonds, excluding Treasuries with a weighted average duration and yield-to-worst of 2.9 years and 4.1%, respectively.
These investments included, but were not limited to ABS backed by equipment, ABS backed by prime quality credit card receivables, ABS backed by insurance premium loans, utility cost recovery bonds, and agency commercial mortgage-backed securities (CMBS). In addition, we bought Treasuries with a weighted average duration and yield of 3.9 years and, 3.1%, respectively. [7]
Our credit investments this quarter were limited to investment grade corporate bonds that we include within our credit holdings because they are rated BBB. Yields in credit (defined as investments rated BBB or lower) increased further during the second quarter, due mostly to an increase in spreads. In combination with higher risk-free rates, the resulting higher yields make credit generally more attractive, all things being equal, and seemingly attractive in comparison to historical data points.
However, as we discuss in more detail below, on a bottom-up basis – which is how we invest – we do not see a plethora of situations where we believe there is adequate compensation for the credit risk and near-term market-to-market risk. As credit markets inch toward attractiveness on an absolute value basis, we selectively deploy capital into credit when we see investments that we believe are priced appropriately for the risk. Otherwise, we are happy to wait patiently for more attractive prices.
During the quarter, investments were funded with a combination of cash and proceeds from selling existing shorter duration holdings and Treasuries.
Market Commentary
A historically poor start to the year for bonds continues. Below are second quarter and year-to-date returns for some broad measures of the bond market:
Q2 2022 YTD 2022
|
Bloomberg 1-3 yr. U.S. Aggregate Bond Index |
-0.64% |
-3.13% |
|
Bloomberg U.S. Aggregate Bond Index |
-4.69% |
-10.35% |
|
Bloomberg U.S. Corporate High Yield Index |
-9.83% |
-14.19% |
To put these returns in perspective, the year-to-date performance for the Aggregate and the 1-3 year Aggregate bond indices are the worst since their respective inceptions, while the return on the high-yield index is also historically bad (aside from the return during the Great Financial Crisis[8]). For a longer-term perspective, 10-year Treasuries (or their proxy) have not had a worse return since 1788![9] Finally, not even short maturity Treasury bonds have been immune from the mark-to-market pain.
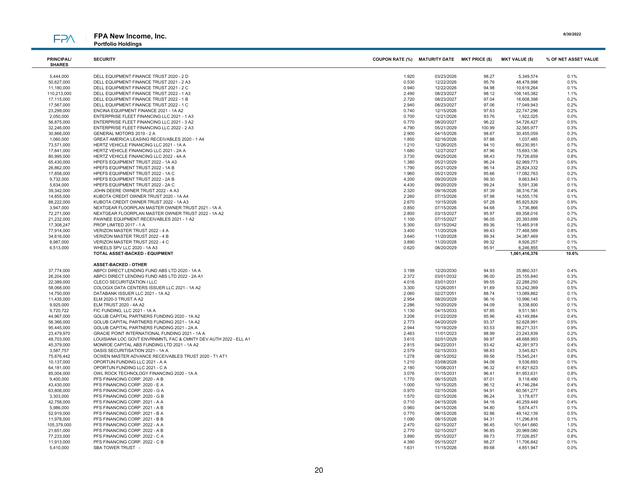
The following graph shows the rolling 12-month return on 2-year maturity Treasury bonds. As shown below, historically, 2-year Treasury bonds have rarely lost money over a 12-month period on a mark-to-market basis, and when there have been losses, they have not been meaningful. In contrast, the mark-to-market losses over the most recent 12 months have been significant and unseen in at least 40 years, if ever.
Source: Bloomberg. As of 6/30/2022.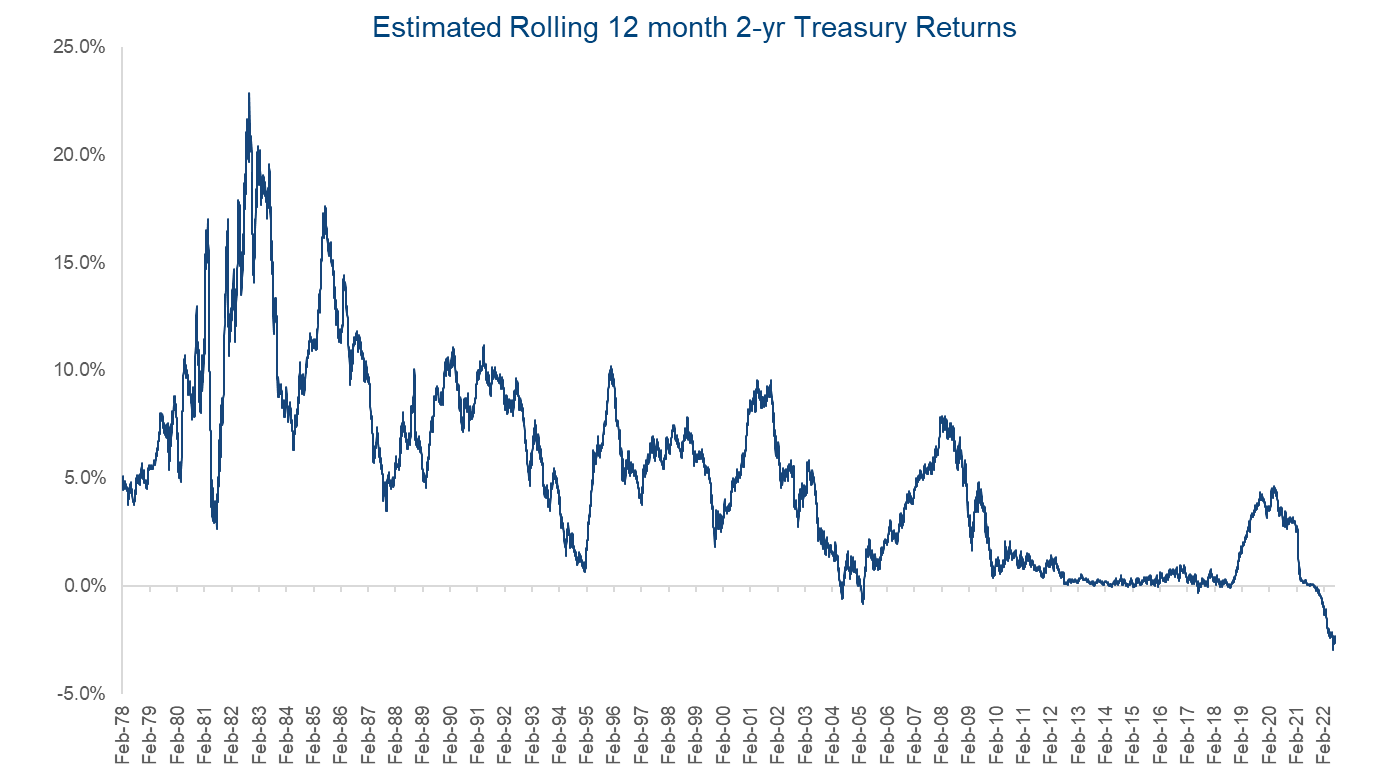
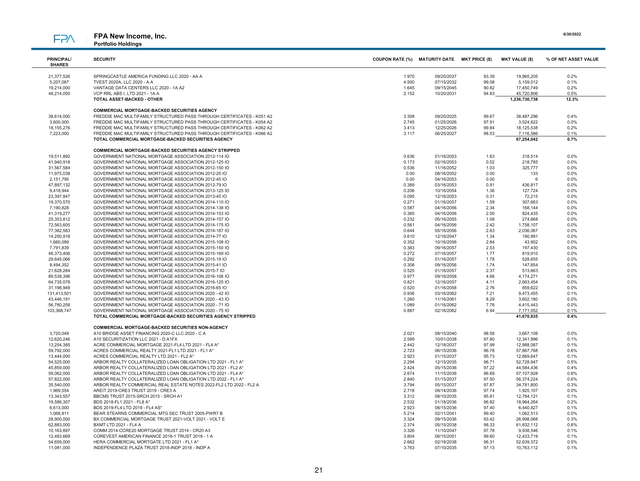
These poor returns are a function of valuation, but the story starts with inflation. As shown below, inflation remains elevated:
Source: Bureau of Labor Statistics. Chart data thru June 30, 2022. 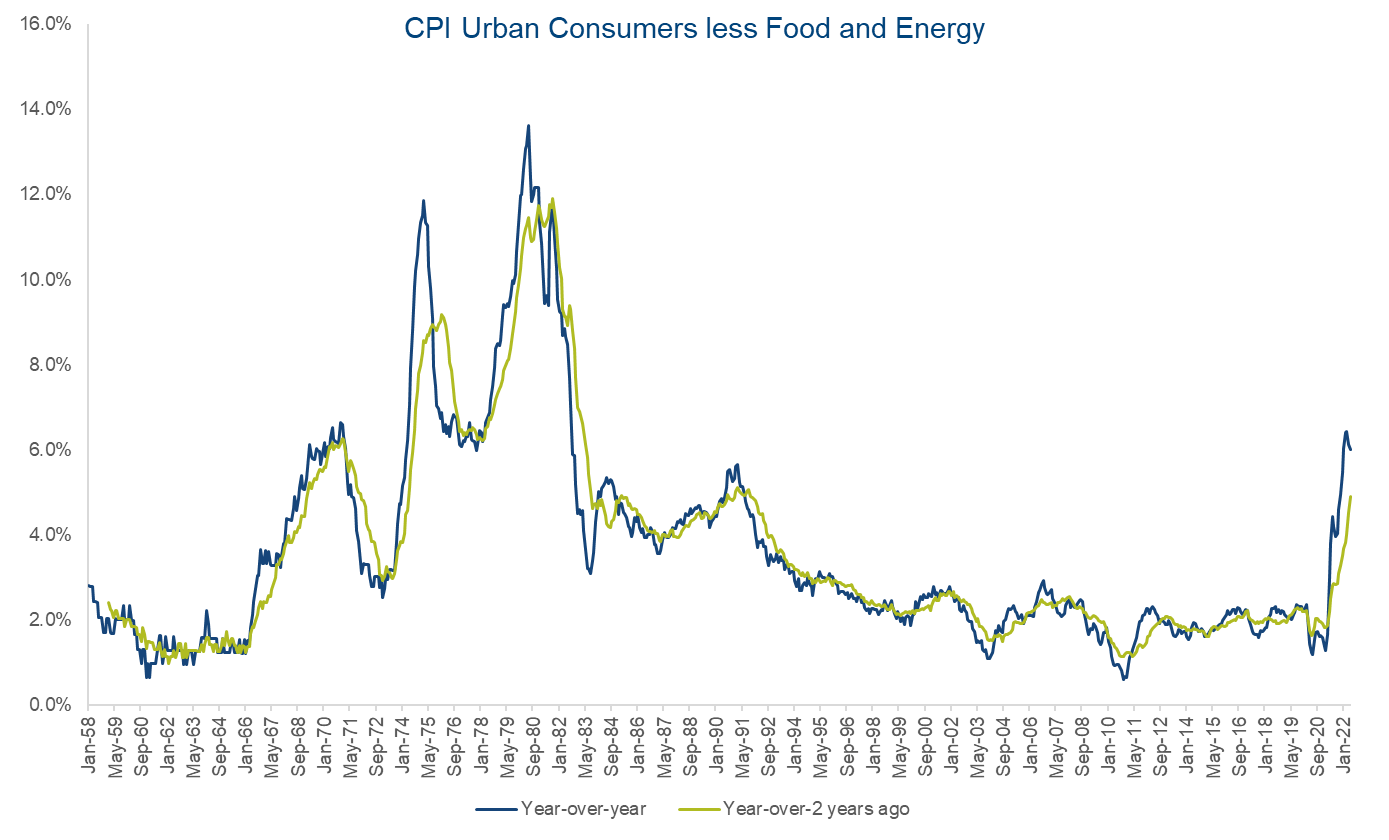
|
The “Consumer Price Index for All Urban Consumers: All Items Less Food & Energy” is an aggregate of prices paid by urban consumers for a typical basket of goods, excluding food and energy. This measurement, known as “Core CPI,” is widely used by economists because food and energy prices can be volatile. The all-urban consumer group represents about 93 percent of the total U.S. population. It is based on the expenditures of almost all residents of urban or metropolitan areas, including professionals, the self-employed, the unemployed, and retired people, as well as urban wage earners and clerical workers. Not included in the CPI are the spending patterns of people living in rural nonmetropolitan areas, those in farm households, people in the Armed Forces, and those in institutions, such as prisons and mental hospitals. |
In response to persistently high inflation, the Federal Reserve continues to tighten monetary policy via a combination of raising the Fed Funds rate, reducing the volume of bonds it purchases and guiding the market toward tighter monetary policy going forward. Specifically, after having already raised the Fed Funds rate by 25 basis points (bps) in March, the Federal Reserve raised it by an additional 50 bps and 75 bps on May 4 and June 15, respectively.
In addition, on May 4, the Federal Reserve announced the implementation of its plan to reduce the size of its balance sheet. Since the onset of the pandemic, the Federal Reserve had been buying Treasuries and agency mortgage-backed securities in an effort to lower yields, drive up asset values and spur wealth creation. Over the past several quarters, the Federal Reserve reduced its bond purchases so that it no longer added to its bond holdings, net of maturities, and, more recently further reduced its purchases to decrease the size of its bond holdings or balance sheet each month. [10]
Finally, through its public commentary, the Federal Reserve has been guiding the market toward additional increases in the Fed Funds rate, saying that it is “is strongly committed to returning inflation to its 2 percent objective.” In support of its plans to tighten monetary policy, the Federal Reserve noted that rising inflation expectations could make fighting inflation more costly and that elevated inflation could become entrenched if the public questions the Federal Reserve’s resolve to fight inflation.
The current Federal Reserve leadership is trying to preserve the Federal Reserve’s inflation fighting credibility.11
Taking a cue from the Federal Reserve, as of June 30, the market expected the Federal Reserve to raise the Fed Funds rate by approximately 180 bps through the end of 2022. The following chart shows the market’s cumulative expectations for the Fed Funds Rate going forward.
Source: Bloomberg. As of 6/30/2022.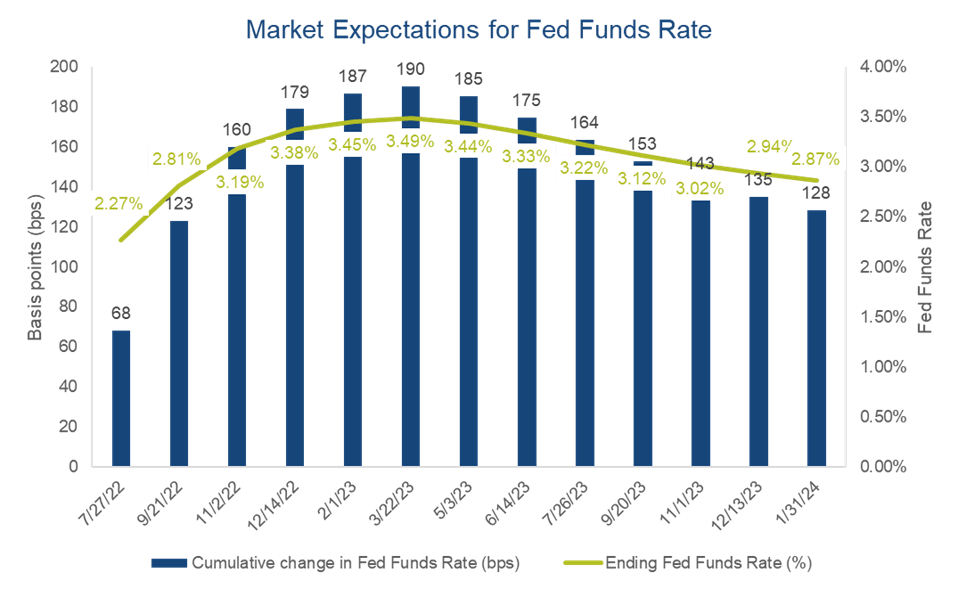
With tighter monetary policy (including forward guidance), Treasury yields have surged in 2022 and that increase continued in the second quarter, as shown in the yield curves below:
Source: Bloomberg. Chart data as of the dates shown.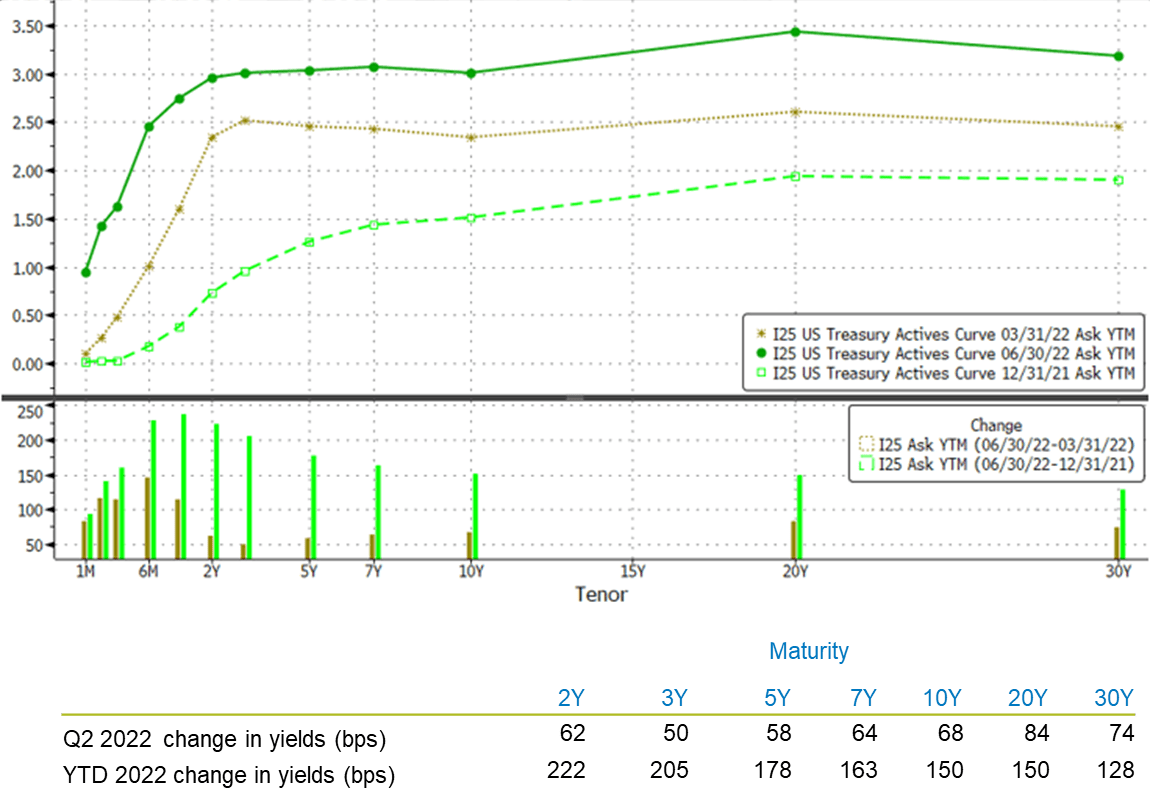
To put these yield changes into context, the chart below shows historical rolling 12-month changes in Treasury yields:
Source: Bloomberg. Data from 1/5/1962-6/30/2022.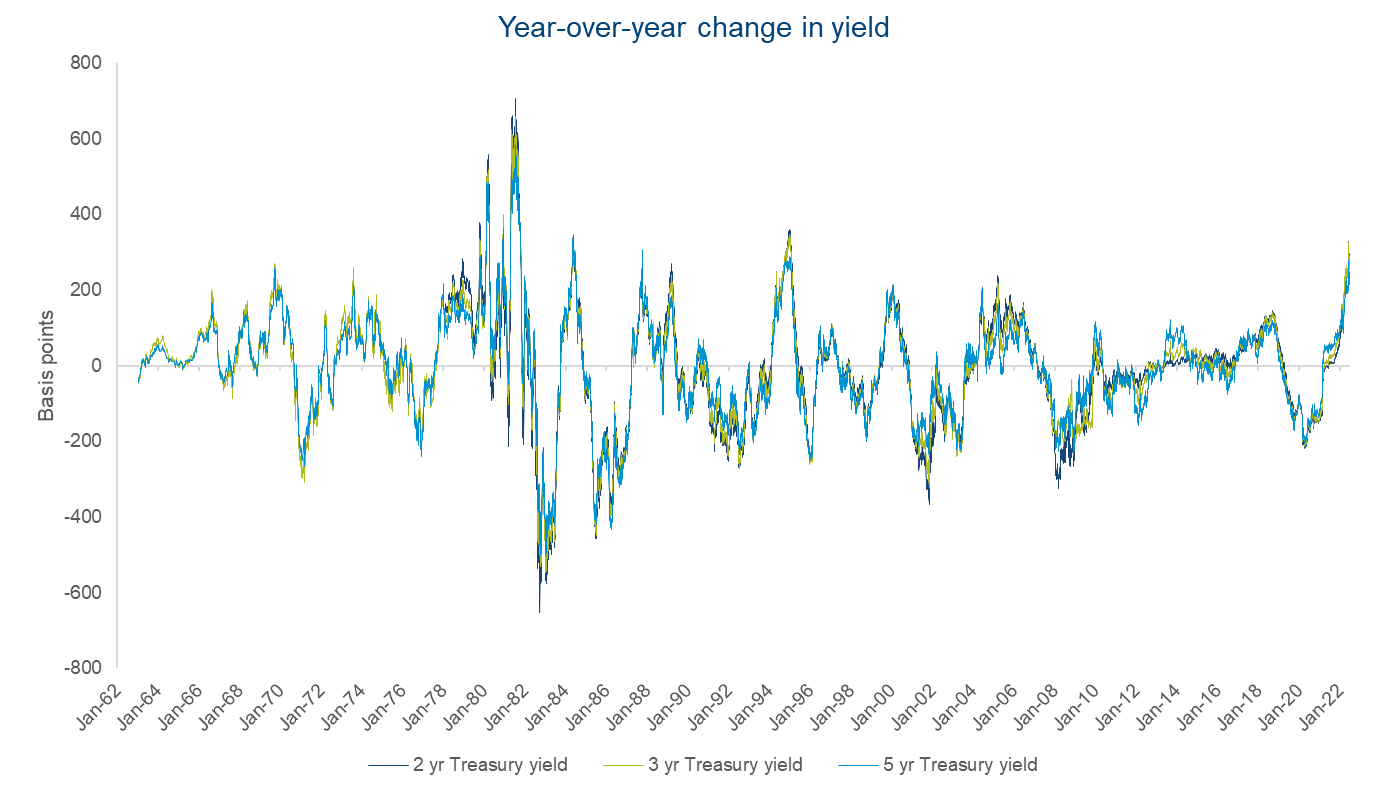
In the last 12 months, 3- to 5-year maturity Treasury yields have increased by approximately 280-330 basis points, the largest increase over a 12-month period since 1995. However, this recent increase occurred against the backdrop of Treasury yields of approximately 0.25-0.89% versus Treasury yields of 4-5% in the mid-1990s. The following chart shows this Treasury yield history and also shows that yields in 2020 and 2021 were historically low (i.e., Treasuries were historically expensive).
Source: Bloomberg. Data from 1/5/1962-6/30/2022.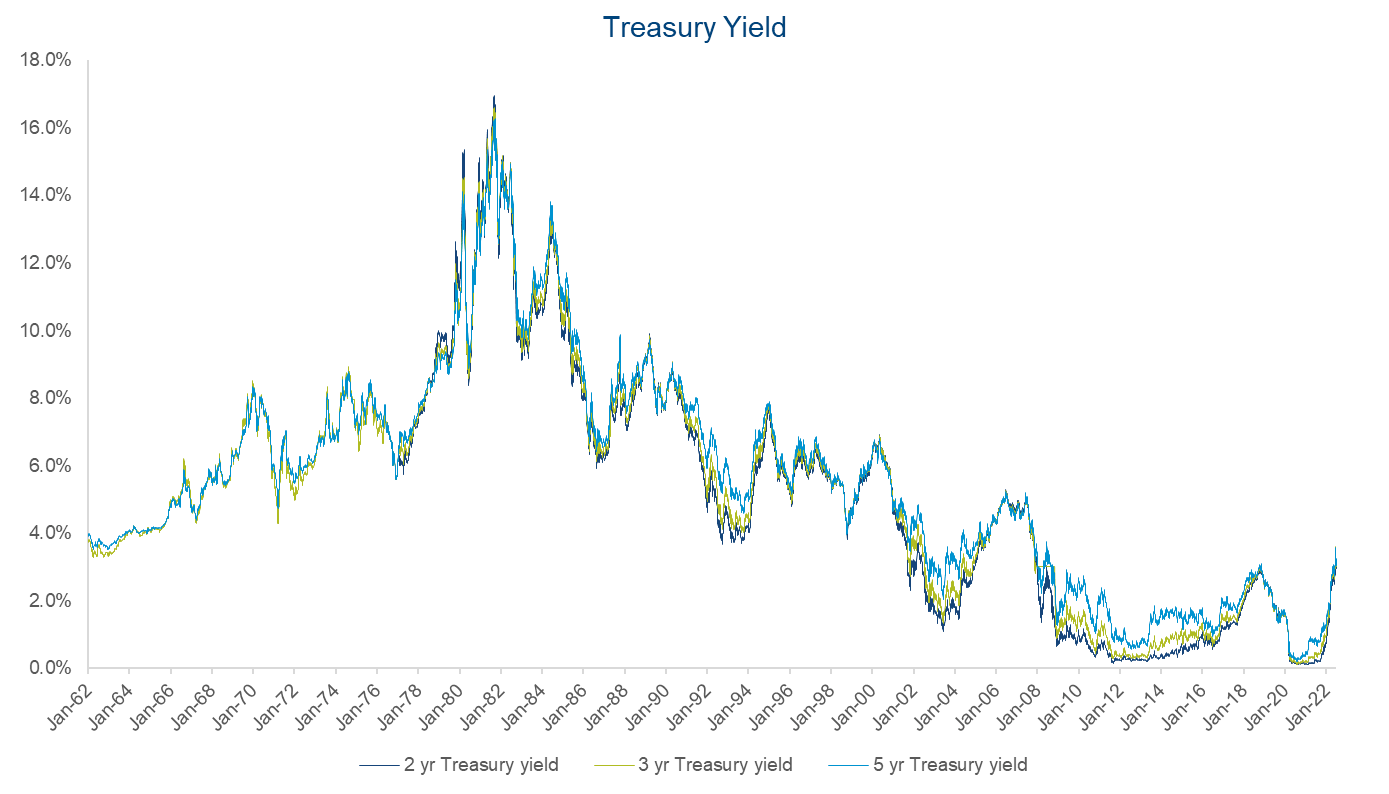
It is this combination of an extraordinarily large increase in yield and low starting yields that has pummeled bond prices this year. In short, the bond market has been a victim of historically expensive valuations. The duration math says that, when applied to historically low yields, the yield increase of the magnitude we have seen this year will lead to historically negative returns. The immutable laws of mathematics prevail once again.
The silver lining of the turmoil in the bond market is that bonds are now meaningfully more attractive, creating what we believe is an opportunity to enhance the Fund’s long-term return profile. Driven by the increase in Treasury yields described earlier and an increase in spreads, high-quality bonds now offer meaningfully more yield than they did 3 to 6 months ago:
Source: Bloomberg. As of 6/30/2022. 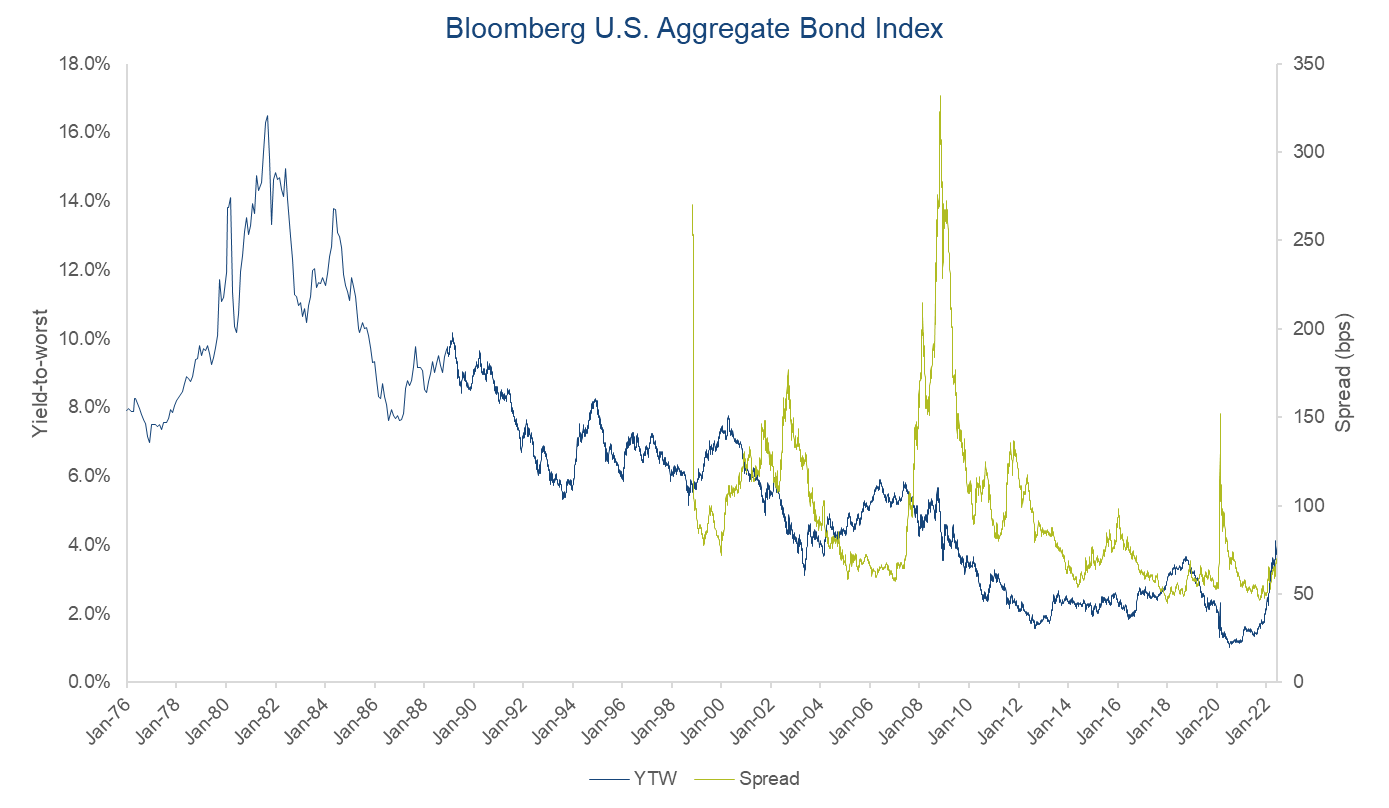
|
YTW is Yield-to-Worst. Spread reflects the quoted spread of a bond that is relative to the security off which it is priced, typically an on the-run treasury. Past performance is no guarantee, nor is it indicative, of future results. |
Source: Bloomberg. As of 6/30/2022. 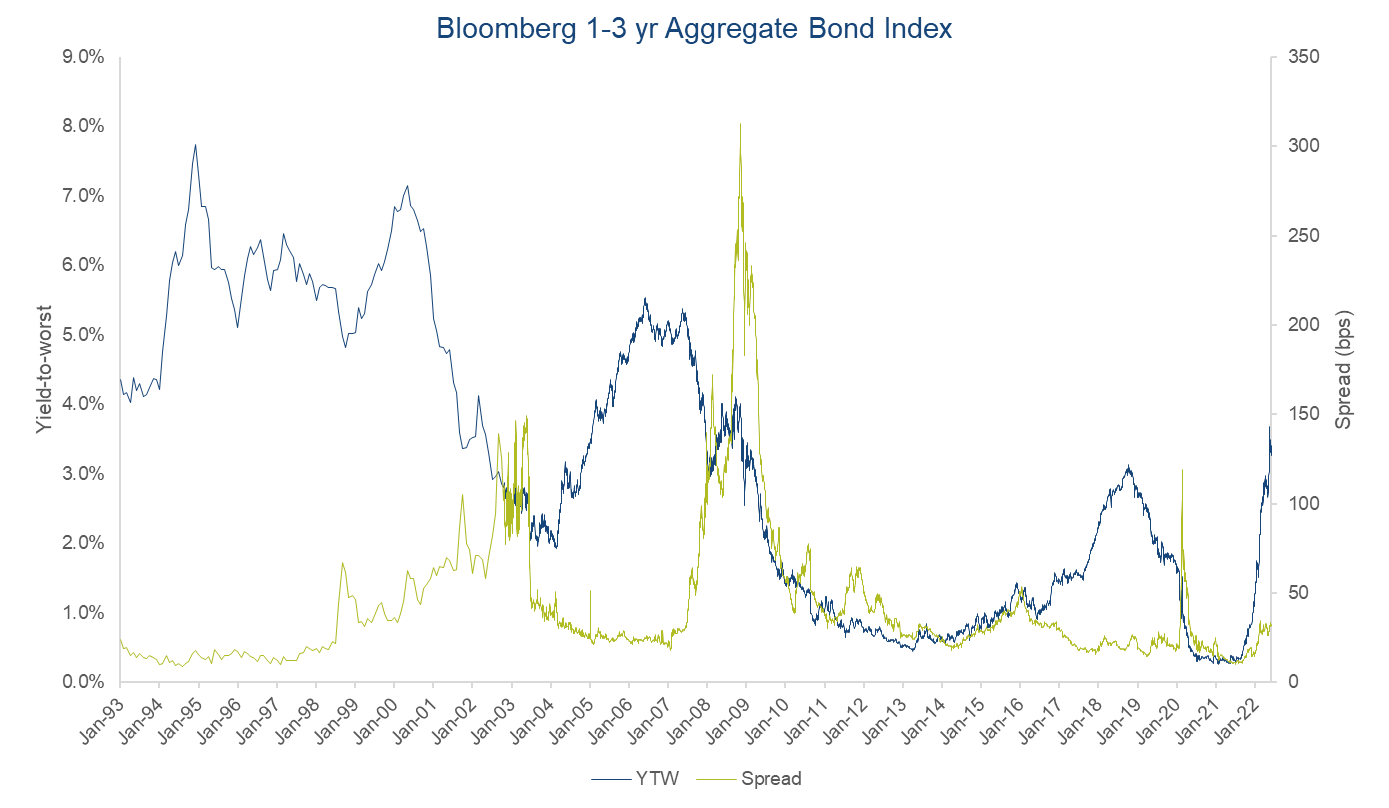
| YTW is Yield-to-Worst. Spread reflects the quoted spread of a bond that is relative to the security off which it is priced, typically an on the-run treasury. Past performance is no guarantee, nor is it indicative, of future results. |
Meanwhile, credit (investments rated BBB or lower) has become cheaper, but we would not call it cheap nor would we say that it is generally attractive. The following chart shows the history of the BB component of the high-yield index excluding energy. We often look at this measure of the market for a more consistent view of history because it is less burdened by changes in the index composition over time.
Source: Bloomberg. As of 6/30/2022.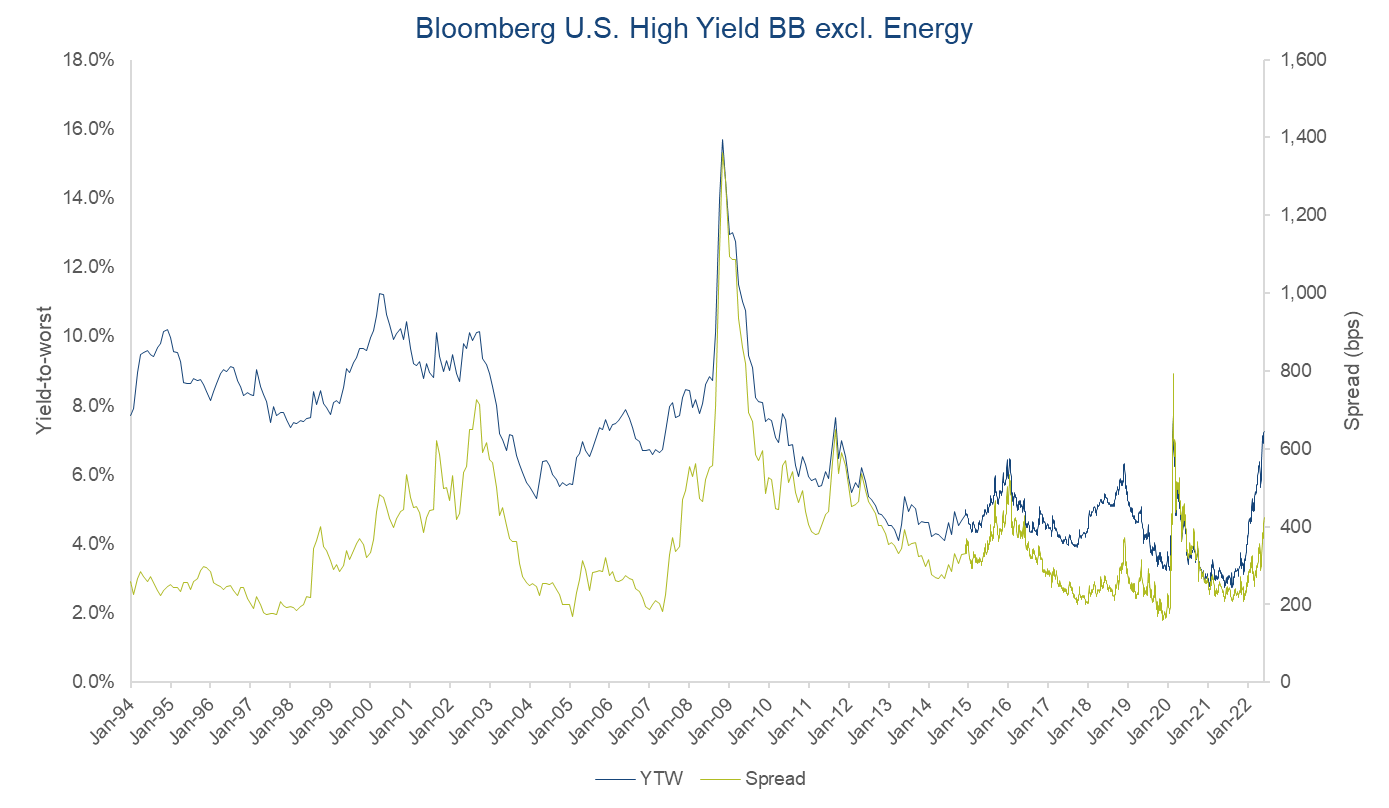
| YTW is Yield-to-Worst. Spread reflects the quoted spread of a bond that is relative to the security off which it is priced, typically an on the-run treasury. Past performance is no guarantee, nor is it indicative, of future results. |
It is tempting to look at charts like these, marvel at how much yields and spreads have increased recently and proclaim “the market is cheap!” Yes, the market is cheaper compared to a 2.7% yield, which is where the above index traded in September 2021. But is the market cheap or attractively priced on an absolute basis? We do not think so, and the reason is that not all markets are created equal. In our opinion, the high yield bond universe that exists today is the rotten fruit of seeds planted in the past couple of years, when easy monetary policy created an environment where investors clamored for return.
As a consequence of those times, today’s high-yield bond universe is marked by higher leverage, thinner tranches and weaker protections for investors. To take an example for illustrative purposes, the yield on the index above is comparable to 2011 but the universe of bonds that existed in 2011, created after the Great Financial Crisis, had lower leverage and better protections for investors. All things being equal, the risk versus reward in 2011 was much better than it is today, despite similar yields. Nevertheless, we never stop looking because we sometimes find select opportunities that are attractive.
Going forward, our investment approach has not changed from what we described last quarter. Specifically, we are leaning into higher yields by trying to extend the portfolio’s duration – subject to the confines of the previously described 100 bps duration test – with the goal of improving the Fund’s long-term risk-versus-reward profile.
As mentioned earlier, this past quarter we bought high-quality fixed rate bonds excluding Treasuries with a weighted average duration and yield-to-worst of 2.9 years and 4.1%, respectively, an increase from a year ago, when our high-quality fixed rate bond investments excluding Treasuries had a duration and yield-to-worst of 0.6% and 1.4 years, respectively.
Buying longer duration bonds that pass our duration stress test should allow us to maintain or improve a breakeven return over twelve months if yields increase by 100 bps, all things being equal, while improving the potential total return if yields decline at some point in the future. The longer the bonds, the greater the potential benefits from lower yields in the future.
In last quarter’s commentary, we noted some reasons why yields may decline, providing a total return benefit to a longer duration portfolio.[12] One of these reasons is the possibility of a recession – a scenario that has come to the fore in the past few months. The following chart shows the difference in yield between 10-year and 2-year Treasury bonds. An inverted yield curve where 10-year Treasury yields are less than 2-year Treasury yields has historically presaged a recession.[13] After inverting in the first quarter of this year, the yield curve inverted again in the second quarter, as shown below:
As of 6/30/2022. Source Bloomberg. Shaded areas reflect recessions.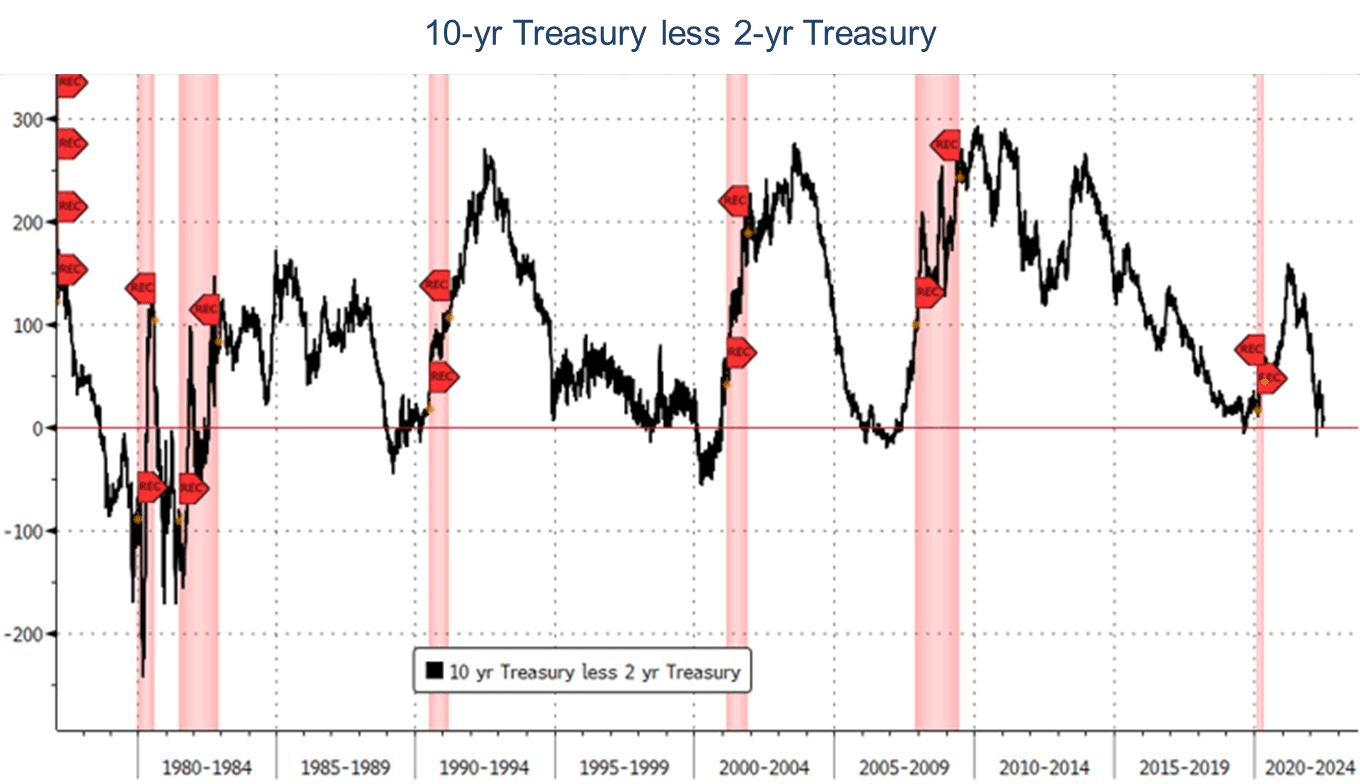
Given the Federal Reserve’s attempts to dampen aggregate demand in its battle against inflation, it’s not surprising that the bond market has recession concerns. In addition, inflation is taking a toll on demand, eroding real incomes and real spending. One anecdote to help understand this phenomenon is that the federal government’s infrastructure budget will not result in as much infrastructure getting built as originally planned. The government allotted a fixed number of nominal dollars to infrastructure spending.
Inflation has reduced the real spending power of those nominal dollars, affording fewer labor hours, less concrete, etc. A similar phenomenon is occurring across the economy, impacting consumers and resulting in lost real spending and output. Recent headlines already show announcements of companies announcing layoffs and curtailing hiring and spending. If a recession does arrive, future Federal Reserve efforts to mitigate the recession or stimulate the economy could lead to lower yields.
Amidst the turmoil in the bond market, we are pleased with the Fund’s performance thus far though we hesitate to say that we are pleased because we do not like to lose money, even over short periods of time. However, we must acknowledge that the Fund’s return, though negative in recent periods, has avoided a lot of the losses of the broader bond market. We have achieved these results by consistently executing on our absolute value investment philosophy. While other fixed income investors make speculative bets on the direction of the market, we have always preferred to let absolute value be our guide.
When we are not paid on an absolute return basis to take risk, we try not to take on too much risk, whether it’s duration risk (i.e., the risk of changes in interest rates or spreads creating short-term mark-to-market losses) or credit risk (i.e., the risk of permanent impairment of capital). When yields were historically low in 2020 and 2021, our absolute value philosophy led us to own shorter duration bonds because we believed the yields that were available at that time were not sufficient to compensate for short-term interest rate related mark-to-market risk.
Furthermore, when high-yield rated debt was trading at historically low yields in 2021, we did not see many opportunities to own such debt at yields that compensated for the risk of permanent impairment of capital, let alone short-term interest rate or spread-related mark-to-market risk. As such, coming into 2022, the portfolio was largely comprised of short duration, high-quality investments (rated single-A or higher).
This portfolio has not been as negatively impacted by the market-wide increase in risk-free rates and spreads, and that has led us to perform better than relevant indices year-to-date. The Fund also ranks in the top third or better in the Morningstar Short-Term Bond Category over the last one, three, five and 10 years, as shown below:
Source: Morningstar Direct. As of 6/30/2022. FPNIX Inception is July 11, 1984.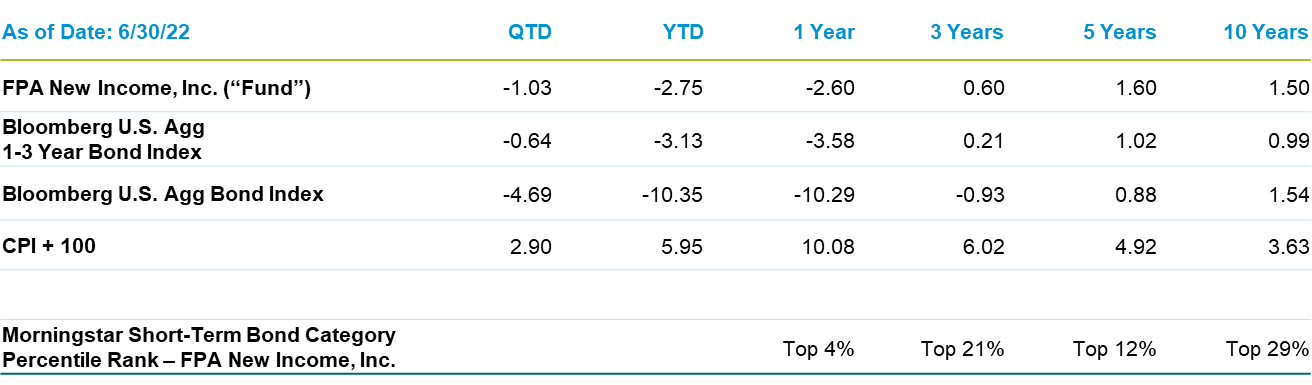
|
Morningstar Short-Term Bond Category Rankings are as of June 30, 2022 and are based on total returns. The Category returns for the periods noted through June 30, 2022 were: 1-year: -5.19%; 3-year: 0.18%; 5-year: 1.08%; and 10-year: 1.26%. Time periods greater than one-year are annualized. As of June 30, 2022, there were the following number of funds in the category: 1 year: 592; 3 year: 547; 5-year: 488, and 10 year: 333. Source: Morningstar. Past performance is no guarantee, nor is it indicative, of future results. |
The Fund’s attractive short and long-term performance has required disciplined flexibility. Discipline is paramount because one never knows when the market will turn. As such, it is critically important to consistently execute on our absolute value approach, regardless of what the market and others are doing. While the data in the table above show that we have performed better than the relevant indices over longer periods of time, what is not visible is that there were periods within those longer timeframes where our performance lagged.
Like any value investor, we have to be disciplined and stick with our convictions. That means there will be periods of time – sometimes long periods of time – where the markets carry others away to better returns. We have to be comfortable being “wrong” until we are “right,” however long that may take.
Flexibility is also important because disciplined investing doesn’t matter if one doesn’t have the capability to execute on it. We like to say that we only have to own some of the bonds in the market some of the time, whereas other fixed income investors feel the need (or are required) to own all of the bonds all of the time. Since the Fund does not track an index, we are free to focus on buying only the bonds that make sense to us. Prior to this year, we used that flexibility to own shorter duration bonds to avoid uncompensated duration risk.
The Fund also has the flexibility to own more high-quality investments when credit is expensive and has the capacity, but not the requirement, to own more credit when we believe credit adequately compensates for credit-related risks. Prior to this year, we used that flexibility to build a higher-quality portfolio with less exposure to credit-related risks. Finally, we have flexibility in the types of bonds that we own. We used this flexibility to invest 31% of the portfolio in floating rate bonds whereas the relevant indices do not own floating rate bonds.
Those floating rate bonds have shortened the Fund’s duration and mitigated the Fund’s exposure to lower bond prices resulting from higher risk-free rates this year. Because they are floating rate, they provided a source of additional income as the Federal Reserve has raised the Fed Funds rate, adding to the Fund’s return.
The benefits of discipline and flexibility are evident not only in the short- and long-term returns but also in the long-term risk-adjusted returns as the short-term benefits compound over the years. Below is the value of $10,000 invested in the Fund over the last 10 years. During this period, the Fund has made more money for its investors than the majority of its Morningstar peers, as shown in this chart, full stop. The generally smoother path of the Fund’s returns over time passes the eye test of less volatile, more consistent returns. The eye test is validated by the Fund’s superior sharpe and sortino ratios over this time period.
Source: Morningstar Direct. As of 6/30/2022. FPNIX Inception is July 11, 1984.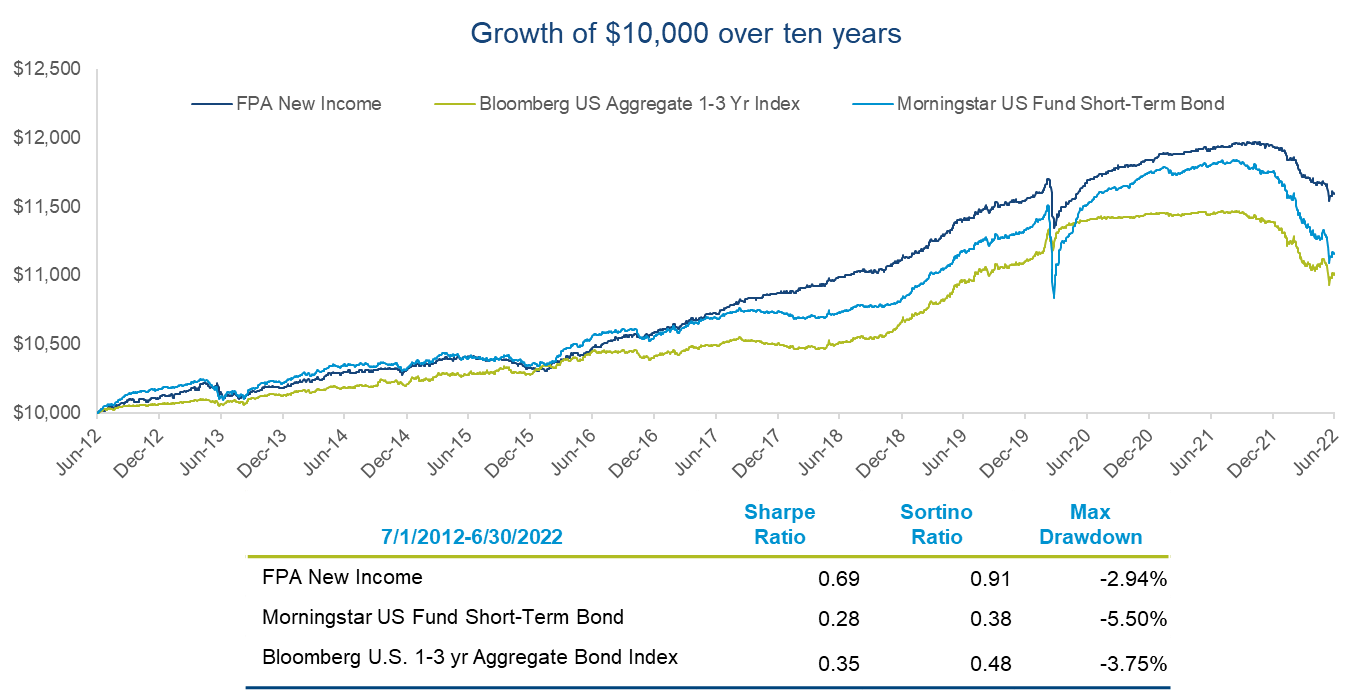
We conclude with a note on the recent re-opening of the Fund. On July 31, after having been soft-closed for two years, the Fund was re-opened to new investors. We closed the Fund in August 2020 when a collapse in bond yields greatly reduced the attractiveness of bonds and significantly narrowed our opportunity set relative to our assets. As referenced earlier, the market is significantly more attractive now, and we no longer have a dearth of opportunities relative to assets.
Now that the Fund is open, we expect questions about our capacity. Our capacity is a function of our assets relative to the opportunity set. Simply, when the market is cheaper, we are able to effectively manage more money; when the market is expensive, we are able to effectively manage less money. Fortunately, your investment team is focused on investing, not gathering assets. FPA’s logo says “investors first.” To us, it’s not just a logo, and it’s not just marketing; it’s foundational.
An investment strategy can only achieve success if the Fund strategy is aligned with its investors. We are personally invested in the Fund and we have been fortunate over the years to have like-minded investors who are as patient and long-term oriented as we are. We would not betray that trust by accepting more assets to our benefit and our investors’ detriment. We want to be known for our returns, not our AUM. Taking on more capital than we can ably manage is not supportive of these aspirations.
Even though the Fund’s assets were growing meaningfully at the time, we preemptively soft-closed the Fund in July 2020, demonstrating our willingness to put our investors’ interests first. We hope that these words and our actions give our investors comfort that, though we do not have a fixed capacity, we will limit the Fund’s assets based on market conditions.
Thank you for your confidence,
Abhijeet Patwardhan, Portfolio Manager
Footnotes
|
[1]Yield to Worst (“YTW”) is presented gross of fees and reflects the lowest possible yield on a callable bond without the issuer defaulting. It does not represent the yield an investor should expect to receive. As of June 30, 2022, the Fund’s subsidized/unsubsidized 30-day SEC standardized yield (“SEC Yield”) was 2.33%/2.17% respectively. The SEC Yield calculation is an annualized measure of the Fund’s dividend and interest payments for the last 30 days, less the Fund expenses. Subsidized yield reflects fee waivers and/or expense reimbursements during the period. Without waivers and/or reimbursements, yields would be reduced. Unsubsidized yield does not adjust for any fee waivers and/or expense reimbursements in effect. The SEC Yield calculation shows investors what they would earn in yield over the course of a 12-month period if the fund continued earning the same rate for the rest of the year. [2]Source: Bloomberg. [3]Floating Rate Bonds or Notes (FRNS) are fixed income securities that pay a coupon determined by a reference rate which resets periodically. As the reference rate resets, the payment received is not fixed and fluctuates overtime. FRNs are in demand among investors when it is expected that interest rates will increase. FRNs can be beneficial as they offer investors an opportunity to earn higher coupon payments should the reference rate rise. FRNs also offer lower duration than fixed rate notes which protects value in a rising rate environment. FRNs present risk if interest rates decrease, which would result in lower coupon payments. All payments on FRNs are subject to the creditworthiness of the issuer. (Source: RBC Capital Markets, An Overview of Floating Rate Notes, https://www.rbccm.com/assets/rbccm/docs/expertise/fixed–income/us/rbc–floating–rate–notes–fact–sheet.pdf) [4]This information is not a recommendation for a specific security or sector and these securities/sectors may not be in the Fund at the time you receive this report. The information provided does not reflect all positions or sectors purchased, sold or recommended by FPA during the quarter. The portfolio holdings as of the most recent quarter-end may be obtained at www.fpa.com. [5]Collateralized mortgage obligations (“CMO”) are mortgage-backed bonds that separate mortgage pools into different maturity classes. Commercial mortgage-backed securities (“CMBS”) are securities backed by commercial mortgages rather than residential mortgages. [6]Yield to Worst (“YTW”) is presented gross of fees and reflects the lowest possible yield on a callable bond without the issuer defaulting. It does not represent the yield an investor should expect to receive. As of June 30, 2022, the Fund’s subsidized/unsubsidized 30-day SEC standardized yield (“SEC Yield”) was 2.33%/2.17% respectively. The SEC Yield calculation is an annualized measure of the Fund’s dividend and interest payments for the last 30 days, less the Fund expenses. Subsidized yield reflects fee waivers and/or expense reimbursements during the period. Without waivers and/or reimbursements, yields would be reduced. Unsubsidized yield does not adjust for any fee waivers and/or expense reimbursements in effect. The SEC Yield calculation shows investors what they would earn in yield over the course of a 12-month period if the fund continued earning the same rate for the rest of the year. [7]Based on weights, prices, yields and duration as of 6/30/22. [8]The Great Financial Crisis is generally referred to as the period from 2007 through 2009. [9]As of 6/30/2022. Source: GFD, Deutsche Bank. [10]Source: The Federal Reserve (Plans for Reducing the Size of the Federal Reserve’s Balance Sheet) Beginning on June 1, 2022, Treasury, agency debt and agency mortgage-backed securities maturing each month will not be reinvested subject to a monthly cap. Any amounts in excess of the monthly cap will be reinvested. For Treasury securities, the cap will initially be set at $30 billion per month, increasing to $60 billion per month after three months. For agency debt and agency mortgage-backed securities, the cap will initially be set at $17.5 billion per month, increasing to $35 billion per month after three months. [11]Source: Federal Reserve issues FOMC statement [12]Historical Fund commentaries can be found at: https://fpa.com/funds/fpa–new–income–fund–quarterly–commentary–archive [13]Past performance is no guarantee, nor is it indicative, of future results. |
Editor’s Note: The summary bullets for this article were chosen by Seeking Alpha editors.
Be the first to comment