

PhoThoughts
Intro
If we take a look at a long-term chart of Fossil Group (Fashion Accessories), Inc. (NASDAQ:FOSL), it will be interesting to see if shares can actually push on from present levels and confirm the potential inverse head and shoulders pattern we see depicted below. Shares of Fossil remain heavily oversold, but it is encouraging to see bullish divergences on both the RSI momentum indicator as well as the MACD.
In saying the above, sentiment remains pretty bearish in Fossil Group, with the recent full-year guidance cut resulting from distinct challenges affecting top-line sales in a bearish manner. Despite the fact that there are plenty of moving parts in Fossil’s business and management was quick to point out areas of positivity within the firm. Q2 sales of $371 million came in down more than 10% compared to the same period of 12 months prior. Management is now guiding a contraction of up to 8% in top-line sales this year due to less available disposable income among customers as a result of elevated core inflation in the EU & the U.S. as well as ongoing associated Covid-19 headwinds in China.
Now, given Fossil’s present valuation, getting this guidance out of the way may be beneficial for investors in the long run. In effect, giving all the bad news to the market to potentially force a bottom in the share price is what we want as value investors. Shares are now trading well under book value (P/B of 0.81) and the sales multiple has dropped to a very attractive 0.17.
When growth is a significant issue, we like to go through the stock’s balance sheet trends to ascertain the financial condition of the company. Many times, in no-growth environments, it is a question of riding out the storm, but this can only be done when the financials are in order and more importantly can be protected.
Fossil Group Technical Chart (StockCharts.com)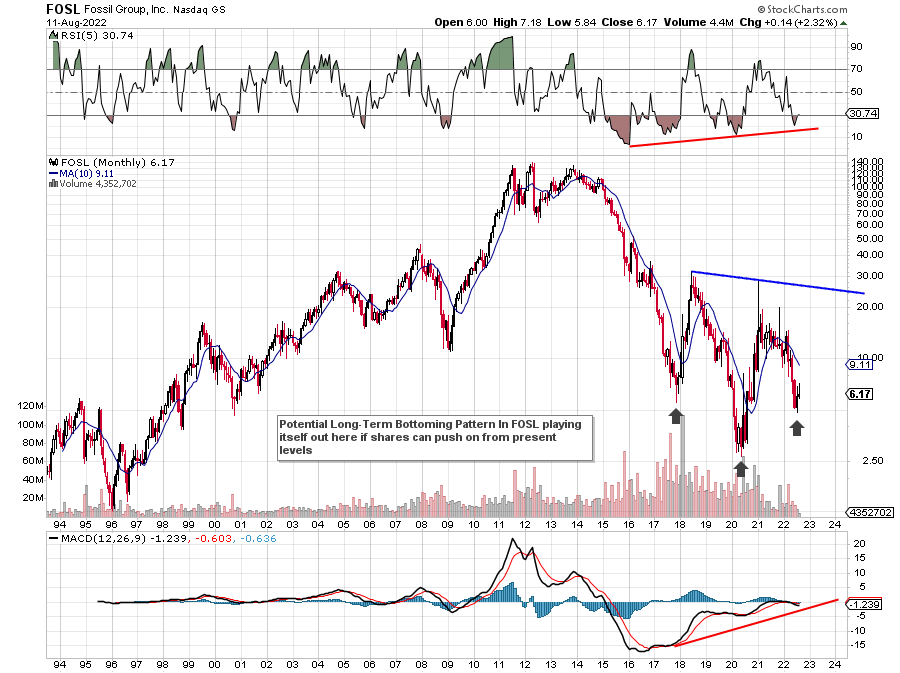
Cash & Cash Equivalents
At the end of Fossil’s fiscal second quarter, the company reported $167.1 million in cash & cash equivalents. This number increased by $4.5 million sequentially but is down $85.2 million compared to the second quarter of last year. Although cash and equivalents have dropped significantly in recent quarters, considering Fossil’s market cap comes in at approximately $320 million, shares are currently trading for under two times their cash position. However, given that the company failed to generate cash flow over the past 12 months and especially in Q2, investors will be keeping a close eye on this trend going forward.
Current Ratio
This ratio is crucial in a no-growth environment, as it demonstrates whether Fossil could indeed meet its short-term obligations if operations came to a standstill. Inventory ($437 million) is Fossil’s biggest current asset and is at its highest level for quite some time. The worrying trend here is that sales dropped by close to $40 million in Q2 of this year, but inventory rose by $86 million over the same 12-month timeframe. So basically, management has had to deal with less money on the front end and more capital tied up on the back end through its inventory. Although the current ratio came in at a sound 2.3 in Q2 of this year, this number is really based on demand going forward and how quickly that inventory can move.
Quick Ratio
This is why it is probably more prudent to take account of the company’s sizable inventory by taking it out of the current ratio calculation. Remember, these calculations are all about being able to convert assets into liquid cash quickly. Suffice it to say, when we strip out the inventory and divide the remainder of Fossil’s current assets ($526.9 million) by current liabilities of $421.3 million, we get a quick ratio of 1.25 which is still fine from an affordability standpoint.
Non-Current Assets
On the non-current asset side, Fossil’s assets are made up of Property, Plant, and Equipment ($249.20 million) & intangibles ($69.4 million). Again, we see a similar trend with Fossil’s assets shrinking for the most part when compared to the company’s sales curve in recent times.
Debt & Return To Equity Ratio
This key debt to equity ratio is calculated by dividing the company’s interest-bearing debt into the company’s equity. This ratio came in at 0.63 in Fossil’s second quarter. Whereas equity ($394 million) in the company may not be a problem, returns (net profits of $10.4 million over the past 12 months) on this equity only amount to 2.64%. This is a number that is going to be a problem for investors in the current climate for the following reason. Return on equity or ROE is a read on the rate shareholders can receive on their investment dollars. Suffice it to say, with inflation continuing up around the 10% mark and with Fossil’s sector returning 16% on average from its equity, 2.6% expected returns may simply not cut the mustard here irrespective of Fossil’s keen valuation at present.
Conclusion
To sum up, from working capital, debt, and equity standpoints, Fossil remains in sound shape even as the company is clearly getting smaller. The issue is whether the balance sheet can be protected going forward. For this to take place, the company simply has to generate higher returns to facilitate cash-flow generation once more. Fossil remains a hold at present for us for this reason. We look forward to continued coverage.
Be the first to comment