

yanadhorn bhukkanasuta/iStock via Getty Images
Fortune Brands Home & Security, Inc. (NYSE:FBHS) is a home and security company that offers industry-leading brands and innovative products for homes and outdoor living spaces. The Moen bathroom and kitchen faucets and the Master Lock product lines are two well-known brands within the company’s umbrella.
In 2021, sales, EPS, and operating income were all up by over 25%. Margins also gained during the year, despite inflationary headwinds. Strong margins were due in part to favorable pricing actions and the willingness of consumers to continue spending. Structural tailwinds in housing, such as record low supply and aged housing stock, should continue to benefit FBHS in 2022 and beyond. The company’s exposure to the new construction industry should also provide incremental tailwinds as new supply hits the market.
The favorable long-term outlook for housing has been overshadowed by the prospects of higher interest rates. Heightened focus on rates has pushed FBHS and other housing-related stocks to 52-week lows and have held them there on deeply bearish sentiment. This pullback has presented an opportunity for investors who are bullish on the continued strength in the repair and remodel market. At current pricing, shares in FBHS are a good lock for any diversified long-term portfolio.
Business
FBHS is a leading home and security products company that operates in three business segments: Plumbing; Outdoors & Security; and Cabinets. Each segment sells products through a wide variety of sales channels, including dealers, wholesalers, and DIY oriented home centers. Notable brands of FBHS include Moen, Master Lock, SentrySafe, and KitchenCraft Cabinetry, among a host of others.
In fiscal 2021, which ended December 31, the company reported +$7.7B in total net sales, which was up 25% from 2020 and over 30% from 2019. Sales within the three segments were spread out evenly, but the Outdoors & Security segment did experience the strongest growth and appears to be a promising growth segment for the company in future periods.
Sales Disaggregation – Form 10-K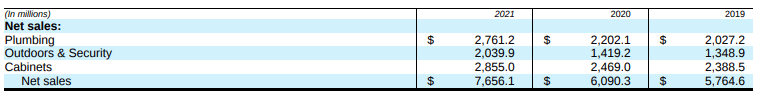
Wholesalers and home center retailers are the two largest sales channels for the company, with the two accounting for about 75% of total net sales in 2021. Additionally, sales to The Home Depot (HD) and Lowe’s (LOW) each accounted for 14% of the company’s total net sales in the current year.
Sales Channel Disaggregation – Form 10-K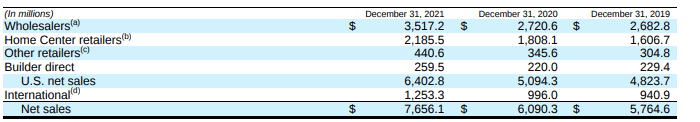
From a geographical perspective, over 80% of total net sales are derived within the U.S. While China is a growing factor in total net sales, having increased from +$355M in 2019 to +$510M in 2021, sales to the country still only account for less than 10% of total net sales.
Geographic Disaggregation – Form 10-K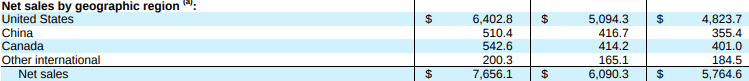
The products manufactured by the company are comprised of various raw materials that are sourced from a variety of sources. Their plumbing segment, for example, requires significant quantities of brass, zinc, resins, steel, and aluminum. In the other segments, hardwoods, plywood, and plastics are critical inputs. Volatility in the prices of these materials and/or fluctuations in the energy markets, therefore, have a significant impact on the company’s cost of manufacturing.
Competitors
FBHS competes against a large field of competitors in their three business segments. The competition includes a combination of publicly traded companies and privately held businesses. Competition in the segments is largely based on product quality, reputation, and ease of installation, among a vast array of other factors. In addition, price competition is especially important in the current inflationary environment. In this environment, FBHS faces fierce competition from private-label brands that are offered by larger competitors, such as HD and LOW, who both also happen to be major customers of the company.
Within the Plumbing segment, notable competitors include Masco Corporation (MAS) and Kohler, among others. In the Cabinets segment, competitors include Cabinetworks Group and American Woodmark. In addition to several other domestic competitors, FBHS also faces significant competition from many low-cost oversees competitors.
Below are the market caps of several publicly traded competitors, available from the Seeking Alpha Peer Comparison Tool. While some of these companies operate in different lines of business, they are alike in that they all operate within the same industry in the Industrials sector. Additionally, all trade at similar market caps with each having less than 50K employees.
Seeking Alpha Peer Comparison Tool – Market Cap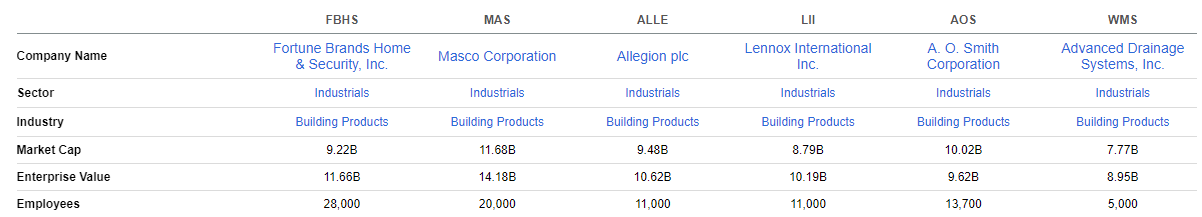
FBHS has lagged their peers in total returns over the past one year, despite performing strongly over a three-year time span. In addition, the company and the sector in general have performed significantly worse than the broader S&P, which is up about 5% over the past one year and down 8% YTD versus FBHS, who is down 30% over the past year and 35% YTD.
Seeking Alpha Peer Comparison Tool – Total Returns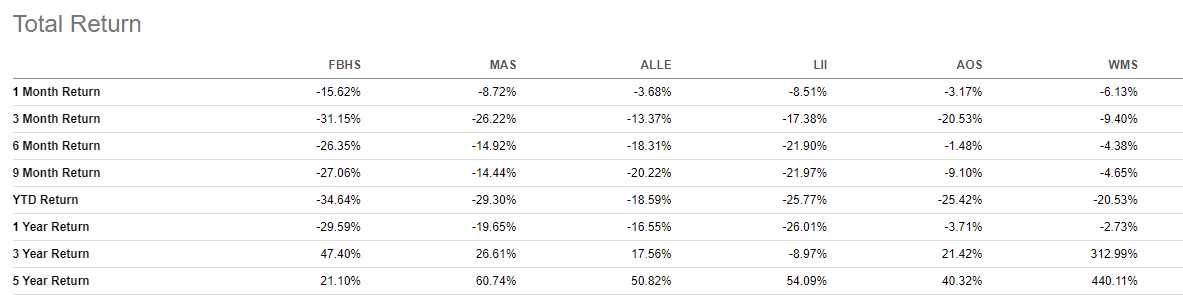
On valuation, FBHS appears to trade at a discount to their peers. For example, shares currently trade at a forward pricing multiple of 11x. This is at a slight discount to the 12x multiple for MAS but a much wider gap to the other peers. Additionally, the multiple is lower than their own five-year average of 16.7x. Likewise, their EV/EBITDA multiple is currently at 9x, which is lower than peers and their five-year average of 13x.
Seeking Alpha Peer Comparison Tool – Valuation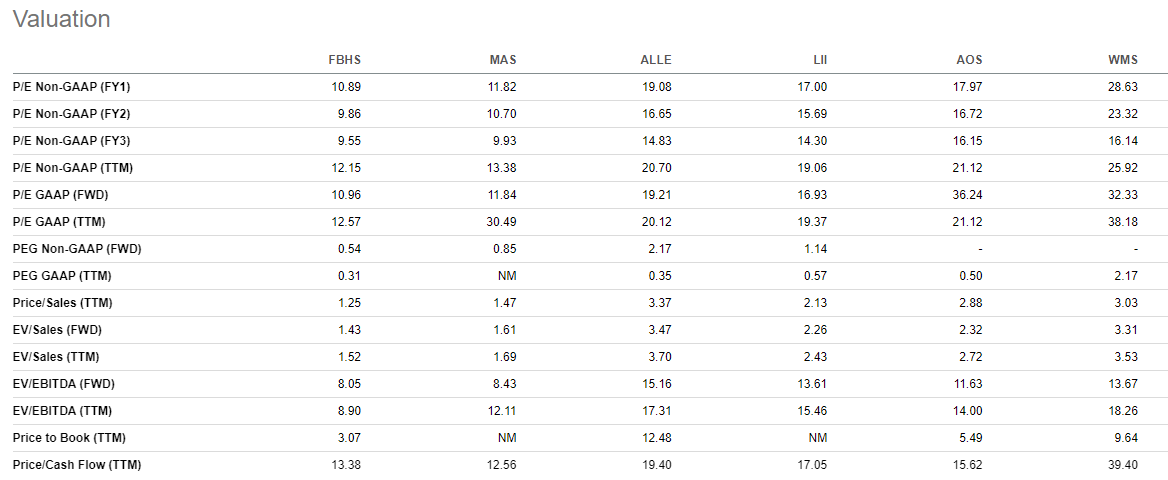
FBHS is currently lagging their peers and the broader S&P. Current uncertainties in the housing market may justify underperformance against the broader markets, but the decline of 30% experienced by FBHS YTD appears to be overdone. This is evidenced by their contraction in their valuation multiples compared to their historical averages. A value opportunity, therefore, appears to exist. For a stronger conviction, however, a deeper analysis of the company’s fundamentals is necessary.
Liquidity Analysis
Author’s Assessment of Liquidity Strength
For the year ended December 31, 2021, FBHS reported total current assets of +$2.7B and total current liabilities of +$2.0B. In the current year, inventories and A/R accounted for 75% of total current assets. This was an increase from the prior year due to increased purchases of inventory. Despite the inventory build-up, cash on hand still accounted for nearly 20% of total current assets.
Partial Balance Sheet – Form 10-K Partial Balance Sheet – Form 10-K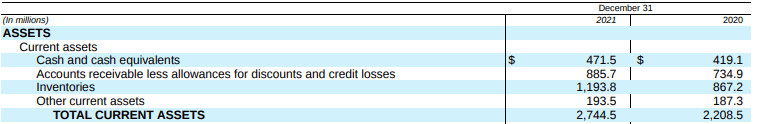

The ability of the company to meet its short-term obligations with their current assets appears adequate, as evidenced by the results of the seven liquidity ratios below for the past five years.
The current ratio and the quick ratio both measure the ability of the company to satisfy its current obligations with their current assets. While the current ratio includes all current assets, the quick ratio only includes the most liquid assets, such as cash and A/R. As a benchmark, a ratio of 1x is desirable for both calculations.
The current ratio is comfortably above 1x, which indicates the company has cash or potential sources of cash to cover their current liabilities. The quick ratio, on the other hand, is below. This is not concerning, however. Since a large portion of current assets are in the form of inventories, a lower quick ratio is expected. One may note that the ratio was higher in 2020. That is true, but collections on A/R were slower in 2020, as evidenced by the two extra days it took to collect. While the 2020 quick ratio appears better than 2021 at first glance, the delay in collection times resulted in an overall net negative in 2020.
Author’s Calculations of Various Short-Term Liquidity Ratios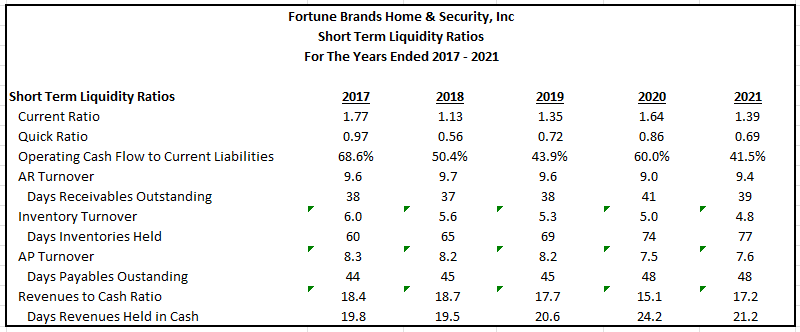
What is most important is FBHS’ ability to sell off their inventory. If inventories were to remain unsold for an unreasonable amount of time, the company would incur significant costs and may potentially have a negative liquidity event.
At present, the trend in inventory turnover is not desirable for FBHS. In 2017, it was taking the company about 60 days to sell their inventory. That has since increased to 77 days after having increased every year since 2017. The weakened turnover could be partly attributable to the supply-related disruptions over the past two years, but other operational inefficiencies are likely drivers as well. For example, it takes Masco between 65-70 days to sell their inventory. As a close competitor in the plumbing segment, the gap in performance is a concern for FBHS.
Collections and payments to suppliers have remained consistent, despite the decline in inventory turnover. Except for 2020, it takes the company between 35-40 days to collect on A/R and between 40-50 days to pay their suppliers. Their days of other financing required after accounting for short-term supplier provided financing is, therefore, about 65 days.
Author’s Calculations of Other Days of Required Financing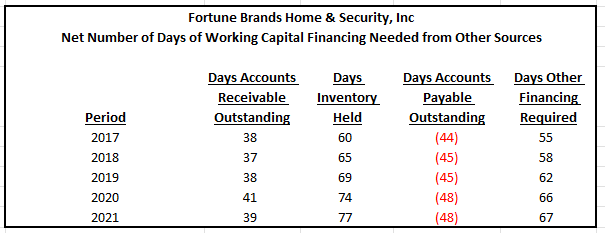
The declining rate of inventory turnover for FBHS is a concern, especially since there was a large build-up in the current year. Though the build was primarily in response to increased demand, there is an elevated risk that the company will face increased holding costs due to slower turnover times than their close competitor, Masco. The company does, however, have adequate cash on hand and does not appear to be having any issues collecting on A/R. This offsets some of the weakness in inventory management. Despite this, it’s best to remain neutral on liquidity strength until there are clear signs of improvement in inventory turnover.
Long-Term Solvency Analysis
Author’s Assessment of Long-Term Solvency Strength
FBHS had total liabilities of +$4.9B in 2021, 60% of which were long-term in nature. Additionally, EBITDA before charges/gains was +$1.3B for the year. Net debt to EBITDA, therefore, was about 1.7x for the current year. This indicates total leverage is on the low end with respect to the company’s earnings.
Further support of solvency is reflected in the various ratios below for the past five years. Total debt appears to be at a moderate level and the company appears to have no issues covering their interest obligations, as evidenced by the high interest coverage ratio. Additionally, bankruptcy risk is minimal, as reflected by the Z-Score.
Author’s Calculations of Various Long-Term Solvency Ratios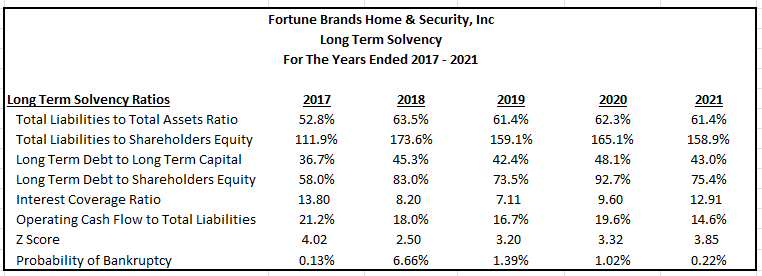
FBHS is generating sufficient earnings to maintain lower levels of leverage. As a percentage of assets and capital, total debt also appears manageable. Additionally, interest coverage is strong, and the risk of bankruptcy is negligible. For these reasons, it is appropriate to apply a strong rating to the company’s long-term viability.
Profitability Analysis
Author’s Assessment of Profitability Strength
FBHS reported strong revenue growth in 2021 due to surging consumer demand. Despite supply-related disruptions and significant input cost inflation, the company’s margins remained strong for the year. Favorable pricing-related actions and the willingness of consumers to continue spending contributed to the continued strength in margins.
Margins on FCFs, however, were lower, but that is primarily attributable to the build in inventory in the current year. In future periods, margins are expected to return to normalized levels. Though margins, overall, were up for the year, they did decline during the fourth quarter. Given additional inflationary pressures to start 2022, it’s likely margins will take a step back in Q1FY22.
Author’s Summary of Historical Profitability Margins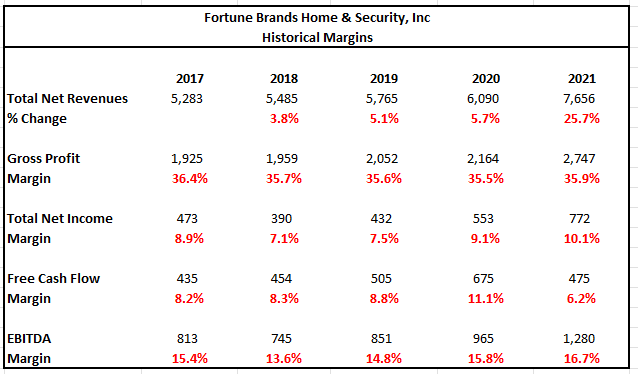
Compared to peers, FBHS’ performance is either mixed or on par. Compared just to MAS, FBHS does appear to be outperforming on most profitability metrics. For example, FBHS’ margins on EBITDA are 17% compared to the 14% reported for MAS. This is an indication of FBHS’ stronger pricing power.
MAS does have an advantage in other areas, however, such as on return on total assets and capital. Additionally, MAS is generating over $400K per employee versus $275K for FBHS. In periods with rising labor costs, a more productive workforce is a critical competitive advantage. For MAS, they certainly appear to have a leg-up on related peers within the industry.
Seeking Alpha Peer Comparison Tool – Profitability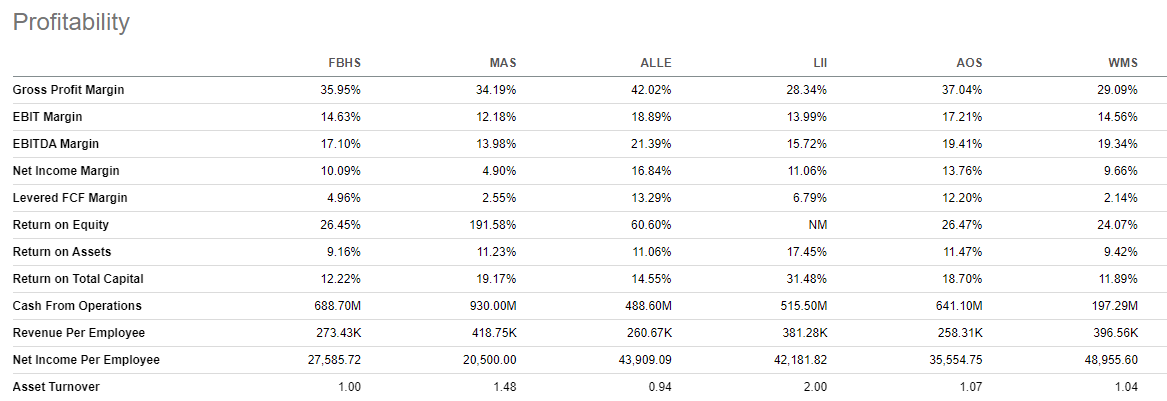
FBHS benefitted from favorable pricing-related actions that offset significant inflationary pressures incurred during the current year. Furthermore, the company is performing on par with the industry and has an advantage against their close peer, MAS, in certain profitability metrics. In other areas, however, such as employee productivity, FBHS is lagging. Given the acceleration in inflation to begin the current year, it’s likely FBHS will experience margin compression in Q1. For now, it’s reasonable to assess the company’s profitability strength as above average due to their pricing power. But this metric will likely need to be reassessed after the Q1 earnings release.
Cash Flow Analysis
Author’s Assessment of Cash Flow Strength
FBHS reported +$689M in operating cash flows in 2021. This was lower than in 2020, but higher than 2019. Importantly, net income was nearly 40% higher than in 2020 and 80% higher than in 2019. Operating cash flows were, therefore, affected by several adjustments that are expected to normalize in future periods. In the current year, for example, net inventory changes reduced operating cash flows by over +$300M. This was due to higher purchases and inventory in transit. At normalized levels, operating cash flow in 2021 would have been over +$200M higher than originally reported.
Partial Cash Flow Statement – Form 10-K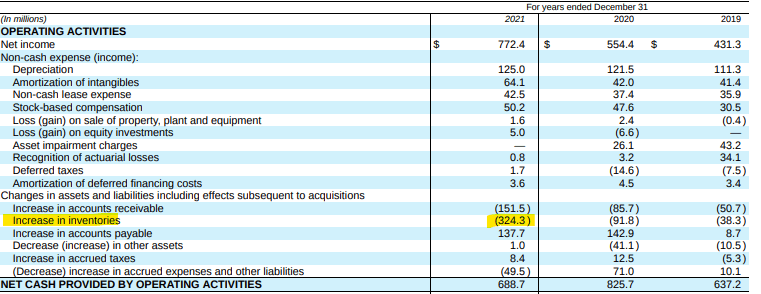
The summary below was obtained from the data within the cash flow statement. As can be seen, the company is generating strong FCFs, despite the challenging operating environment. As stated previously, FCF would have been even higher if inventory activity was at more normalized levels.
In the current year, FBHS returned nearly +$600M to shareholders in the form of dividends and buybacks. The dividend is well covered by both free cash flows and operating cash flows and the payouts are less than 30% of net income. When including share repurchases, coverage drops, but the payouts are still fully covered by net income and operating cash flows. Overall, the dividend is safe and is likely to continue growing in future periods.
Author’s Summary of Cash Flow Statement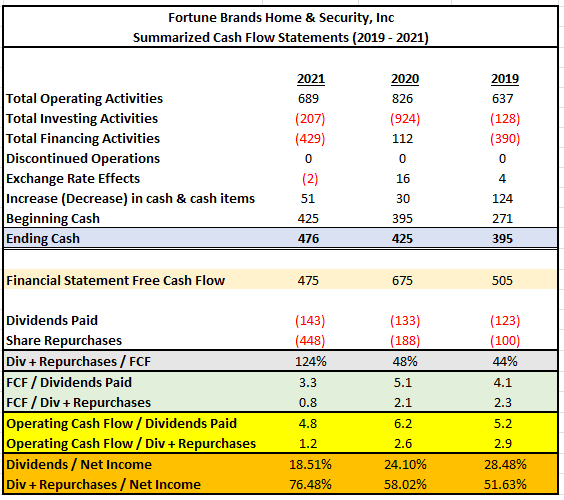
The cash flow strength of FBHS is strong. While FCFs decreased in the current year due to increased purchases of inventory, normalization is expected to occur in future periods. Additionally, the company’s payouts are fully covered and appear safe for the foreseeable future. Additionally, the dividend has been growing at a five-year CAGR of nearly 10% and is likely to continue growing in subsequent periods. As such, the company’s cash flow strength can safely be rated as strong.
Price Target
Various methodologies were utilized to obtain an indication of the intrinsic share price of FBHS. The results are provided in the chart below. The quickest methods involved simply applying the historical multiples to current pricing. Doing so yielded target prices with a low of $73 to a high of $108.
When applying models involving future cash flows, results came in at a low of $55 and a high of $74. With these models, the rate on the 10-YR U.S. Treasury is a critical variable in the computations. Since rates are projected to increase, the model incorporated the current rate, which was 2.9% at the time of analysis, as reported in The Wall Street Journal. For hypothetical purposes, the analysis also utilized a significantly higher rate of 5%.
When considering the results of all methods, the average target price is approximately $81.
Author’s Summary of Various Intrinsic Share Prices Using Multiples and FCF Valuation Methodologies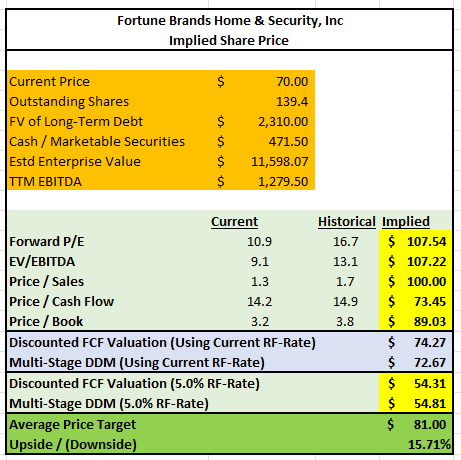
For illustrative purposes, what follows is an expansion of the results of the FCF valuation method.
The first step in the model was to input the historical data from the past five years. For simplicity, a fixed tax rate of 23% was used for all periods in arriving at NOPAT. This tax rate is consistent with current period rates. Furthermore, total operating capital was defined as the combination of total current assets and net PP&E, less total current liabilities. The net new operating capital was simply the year-over-year change. FCF, then, was the difference between NOPAT and net new operating capital.
Author’s Calculations of Historical FCFs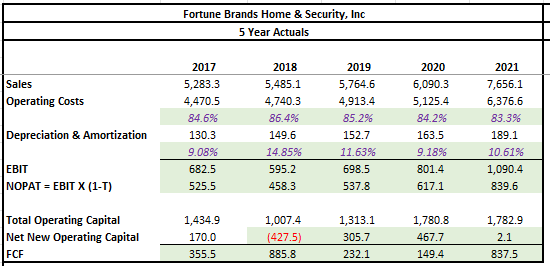
The next step in the model was to input the various assumptions required to calculate the future cash flows to the company. The growth rate of sales for this model was expected to be 6.5% in the current year with incremental decreases thereafter. Long run FCF growth was expected to settle in at 4%. The sales figures for the current year are generally in-line with management’s outlook. Long-run FCF growth, on the other hand, was meant to track long-run GDP growth, which is projected to be in the low-single digits.
Operating costs as a percentage of sales have historically been in the 80s, while depreciation and amortization as a percentage of operating capital has been around 10% over the past two years. For this model, higher percentages for operating costs were used for near-term periods before returning to more normal levels in the later years. Depreciation was kept at 10.50% for all periods.
Finally, the discount rate was obtained by applying the CAPM formula. This formula incorporates the stock beta, the risk-free rate, and an expected risk premium. The beta of FBHS is 1.59, as reported in Morningstar. The risk-free rate was 2.90%, as stated earlier. The historical risk premium is 5.5%. Thus, the expected return on market is 8.40%. The result of the CAPM upon inputting these variables is 11.65%
Author’s Assumptions For FCF Valuation Model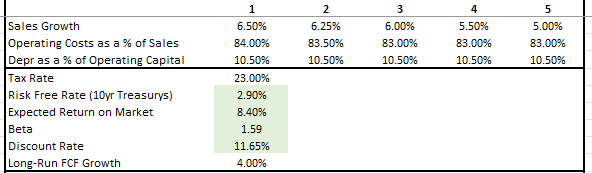
The summary below provides the projected FCFs over the next five years. The results of this model are on the conservative side to account for the risk of deviations and setbacks from management’s outlook.
Author’s Projections of Future FCFs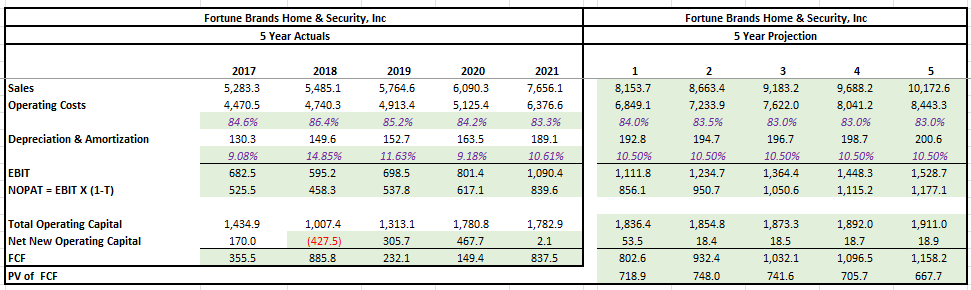
The final step in the model was to calculate the terminal value using the long-run FCF growth rate and combine that result with the sum of the present value of the future FCFs above. Additionally, the market value of debt needed to be deducted from the totals to arrive at the intrinsic value to common shareholders. In the notes to the financial statements, it was disclosed that the market value of debt was +$2.3B. Therefore, that is what was used in the calculation.
Author’s Final Calculation of Intrinsic Share Price Using FCF Methodology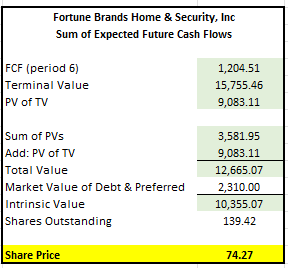
As seen above, the intrinsic share price using this model is $74.00. Taken together with the other methods, this further supports a target price of $81.
Risk Factors
The success of FBHS’ business is highly dependent upon home improvement and new home construction activity levels in North America and China. Significant and sustained declines in these markets would have a material adverse effect on FBHS’ results of operations. Additionally, since these markets are sensitive to changes in economic conditions and other factors, such as employment levels, consumer confidence and income, inflation, and interest rate levels, among others, adverse changes in these conditions could also negatively affect the broader housing market.
Prices of certain commodity products used in FBHS’ products, such as brass, zinc, steel, and wood, among others, are volatile and subject to fluctuations based on various external factors, such as supply and demand, inflationary pressures, competition, and market speculation. Significant increases in the cost of these inputs could have a negative impact on the company if they are unable to pass through the increases to their customers.
In addition to rising input costs, supply chain disruptions could adversely affect FBHS’ ability to receive and deliver their inventory in a timely manner. This can result in increased transportation costs if the company chooses to utilize expedited shipping or dissatisfied customers if they are not provided their goods in a timely manner or if the products they need are continually out of stock. This may result in the loss of future business with both existing and prospective customers.
FBHS maintains a global presence, principally in the U.S., Mexico, Europe, Africa, Canada, and Asia. Exposure to international markets subjects the company to the risk of potential economic/political instability in the host country. Additionally, the company may be negatively impacted by geopolitical conflicts that may arise between the U.S or their allies and any of the countries that the company operates in. Tariffs and counter-tariffs, increased regulation, boycotts, and long-winded lawsuits are potential complexities that could raise the cost of doing business for the company.
Conclusion
FBHS is significantly underperforming the broader S&P and is currently trading near their 52-week lows. Additionally, the company was recently downgraded by Bank of America on margin and demand-related concerns. Furthermore, the perceived impact of rising rates on housing demand is also contributing to bearish sentiment in the stock.
Despite the concerns, the company’s fundamentals are supportive of an impending rebound. In 2021, the company reported strong sales growth that was paired with higher margins due to favorable pricing-related actions and strong consumer demand, which is expected to remain supported in future periods by record levels of household net worth.
At year end, FBHS had +$472M in cash on hand and over +$700M available on their credit facility. Additionally, a low degree of total leverage enabled the company to invest modestly in growth and return excess cash to shareholders via a fully covered dividend that is likely to continue growing in subsequent periods. At current pricing, shares appear discounted to peers and their own historical averages. At a target price of about $80, this home and security company would be a good fit for any investor with a favorable outlook on the broader housing market.
Be the first to comment