

RHJ
Introduction
Fortuna Silver Mines (NYSE:FSM) released its fourth-quarter and full-year 2022 production results on January 17, 2022.
The company commented on the Séguéla Project and gave a 2023 production guidance.
Note: This article is an update of my article published on November 17, 2022.
Fortuna Silver Mines owns three production mines and is nearing completion of the Seguala Project in Ivory Coast.
FSM Assets location Map (FSM Presentation)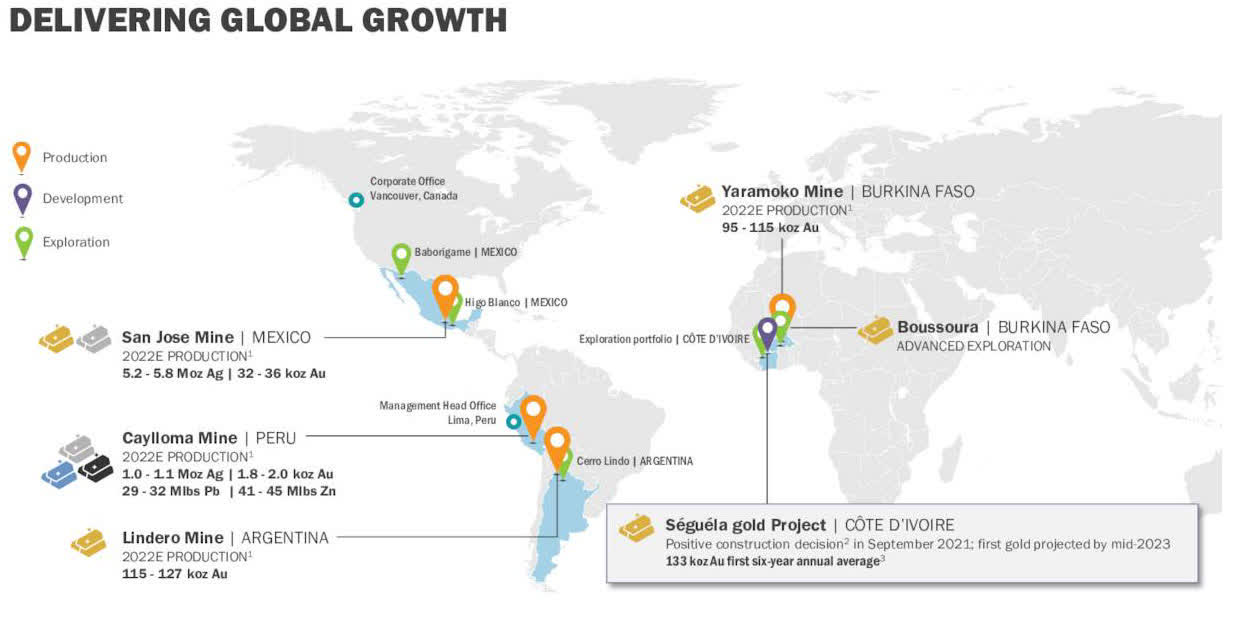
Fourth Quarter and Full-year Gold and Silver Production Commentary
Note: In the press release, the company reported the following:
Au Eq includes gold, silver, lead, and zinc and is calculated using the following metal prices: $1,802/oz Au, $21.75/oz Ag, $2,161/t Pb, and $3,468/t Zn or Au:Ag = 1:82.89, Au:Pb = 1:0.83, Au:Zn = 1:0.52
1 – 2022 Gold and Silver Production
Fortuna produced 259,427 Au ounces and 6,907,275 Ag ounces in 2022. Gold production was up 25.2% YoY, but silver production was down 7.9%. Production in gold equivalent for 2022 was 401,878 GEOs.
Silver production was slightly above guidance, and gold production was nearly at the mid-point of 2022 guidance. Good job.
Overall, it was a decent production.
FSM Year production of gold and silver history (Fun Trading)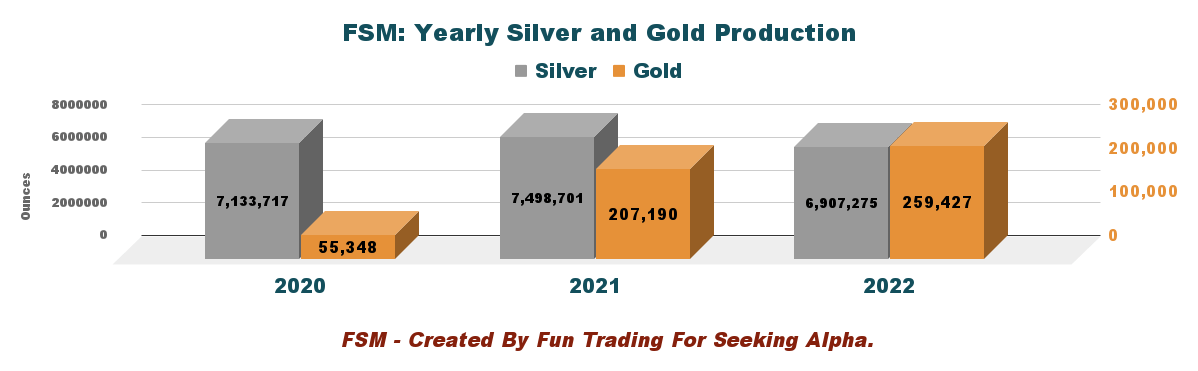
The company indicated its 2023 preliminary consolidated production guidance:
- Gold production of between 282K and 320K ounces; a projected increase of between 9% and 23% over 2022
- Silver production of between 6.3M and 6.9M ounces; a projected decrease of up to 9% over 2022
- Gold equivalent production is between 412K and 463K ounces, a projected increase of 3% to 15% over 2022
I am guessing that production of Séguéla Mine starting in 3Q23 has been factored in.
We can see that while silver production stays constant, 2023 gold production will show a substantial increase in 2023. To compare with 2022, I have indicated the 2022 guidance below:
FSM 2022 Guidance (FSM Presentation)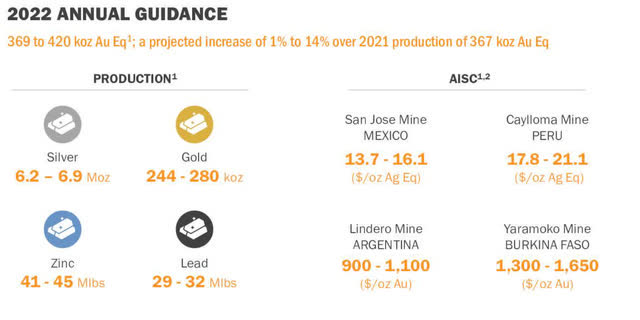
2 – Quarterly Gold and Silver Production
For 4Q22, Fortuna Silver Mines produced 1,746,746 ounces of silver and 64,112 ounces of gold. It translates to 100,229 GEOs using a ratio Au/Ag of 1:82.89.
FSM Quarterly gold and silver production history (Fun Trading)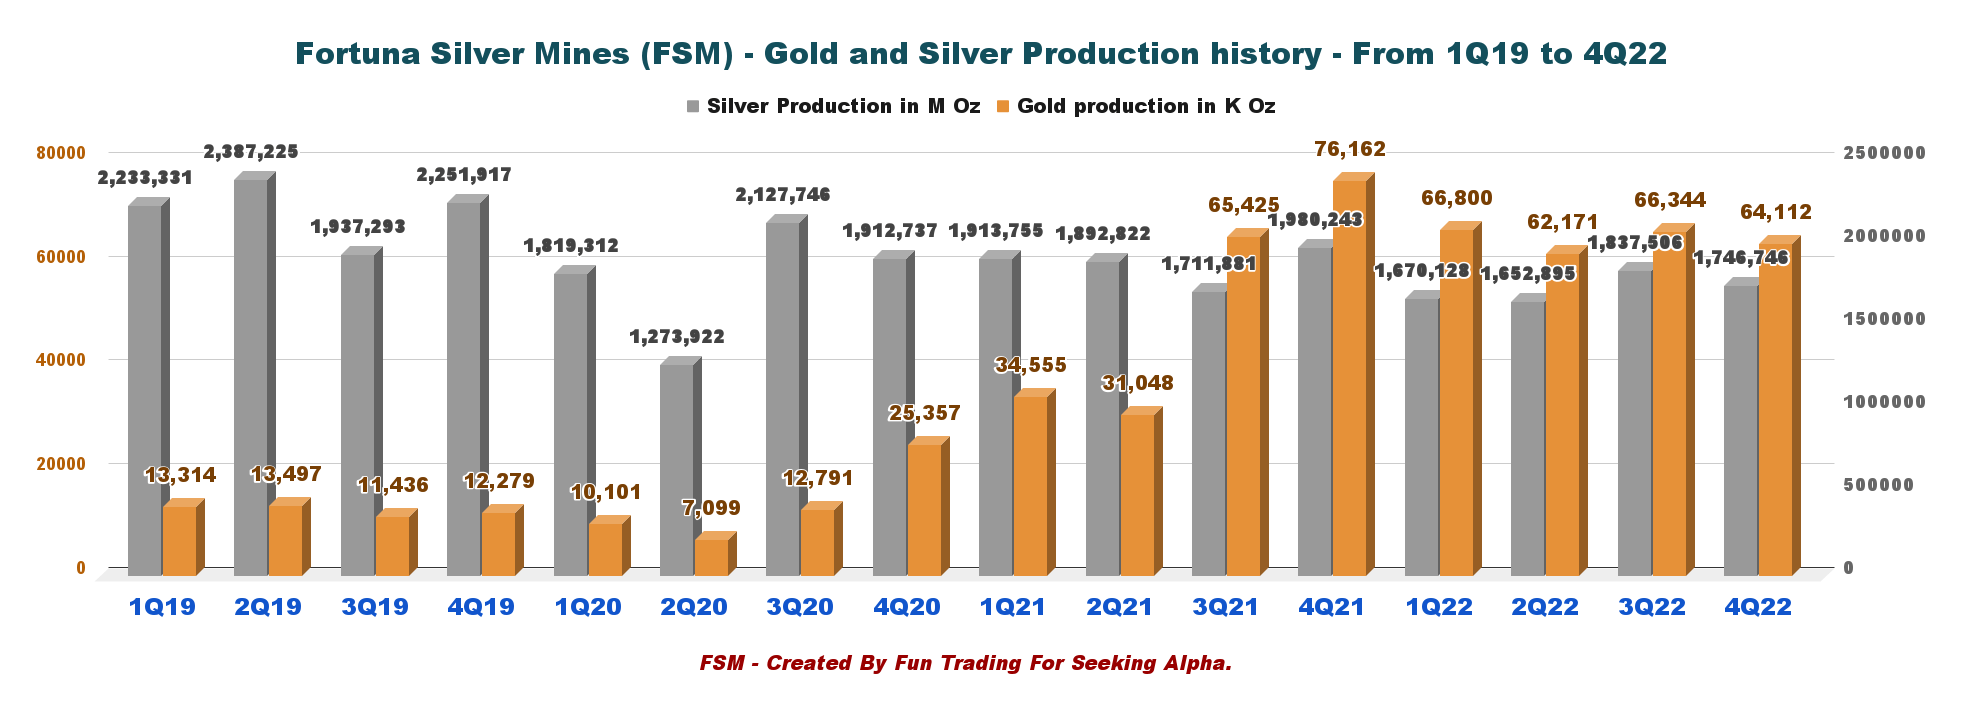
3 – Gold and Silver Prices History
The gold price was $1,802 per ounce, and the silver price was $21.75 per ounce.
FSM Quarterly gold and silver prices history (Fun Trading)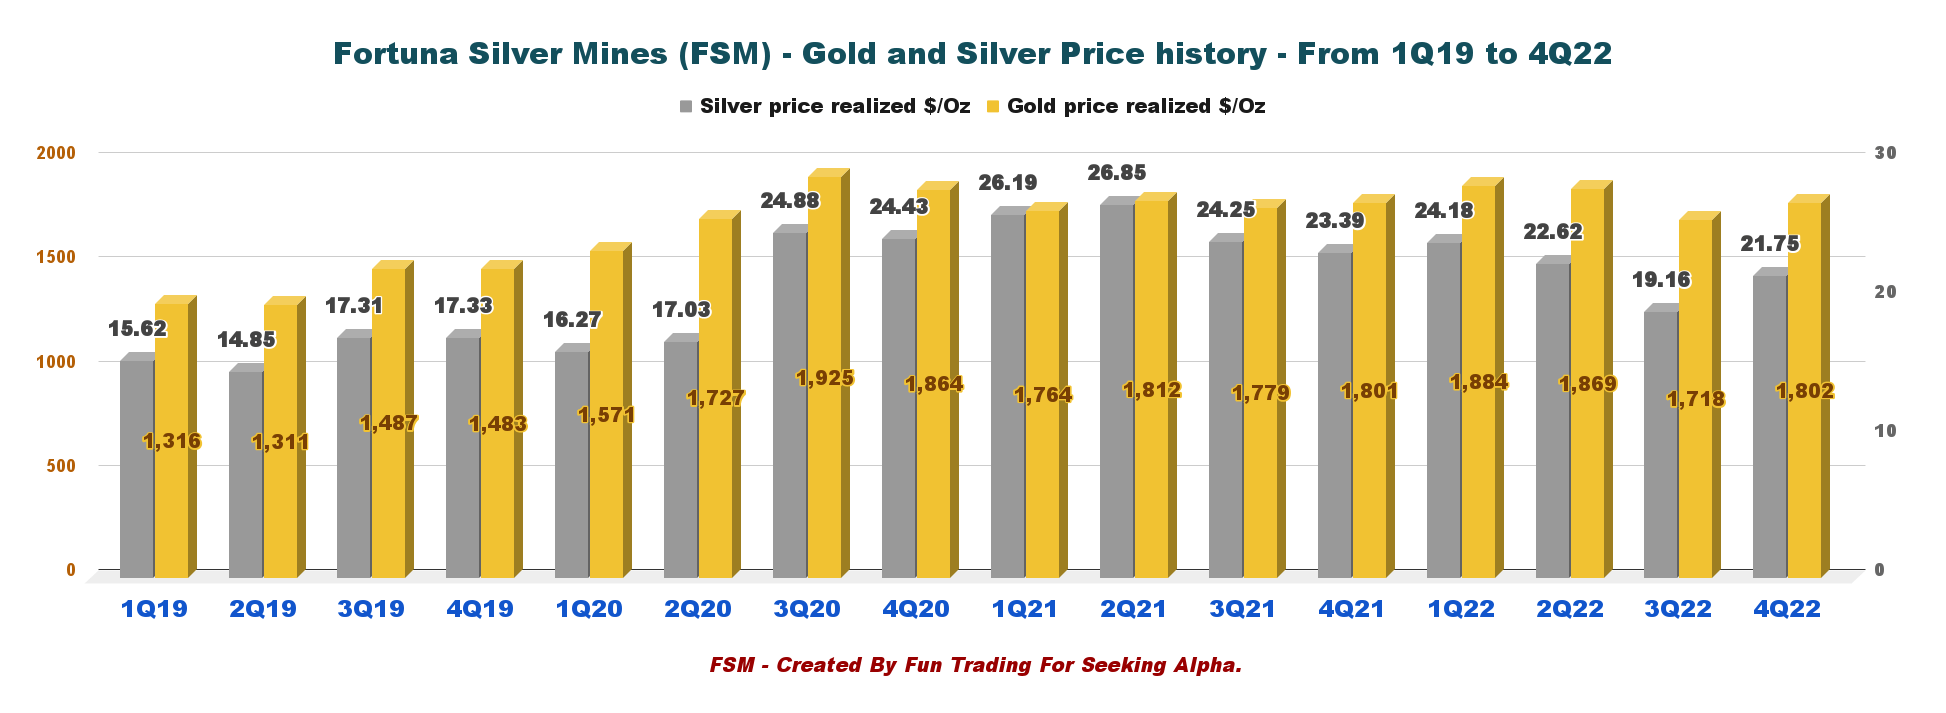
Silver is still underperforming gold, but gold and silver prices did quite well recently, as we can see below:
FSM Gold, Silver, and Copper one-year chart (Fun Trading StockCharts)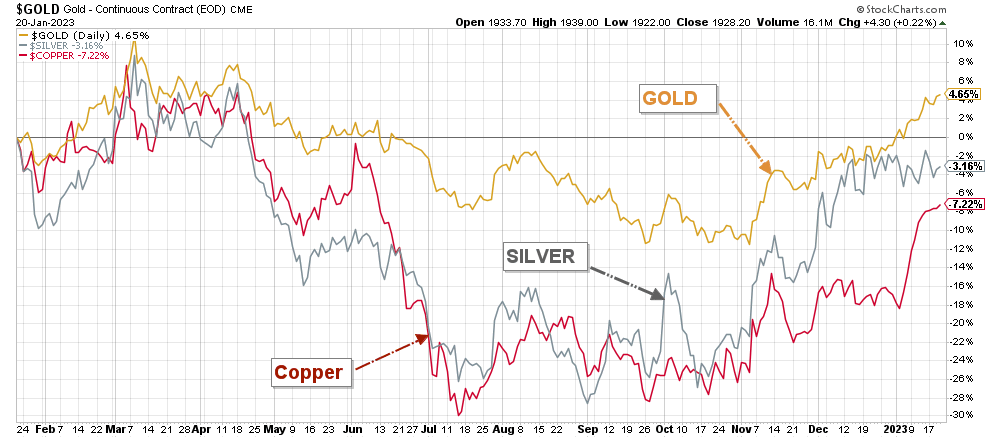
4 – Zinc and Lead Production History (Caylloma Mine)
Production in 4Q22 for lead was 8.735 Mlbs and 12.575 Mlbs for zinc; for the full-year 2022, production was 34.588 Mlbs of lead and 45.176 Mlbs of zinc.
FSM Quarterly Lead and Zinc production history (Fun Trading)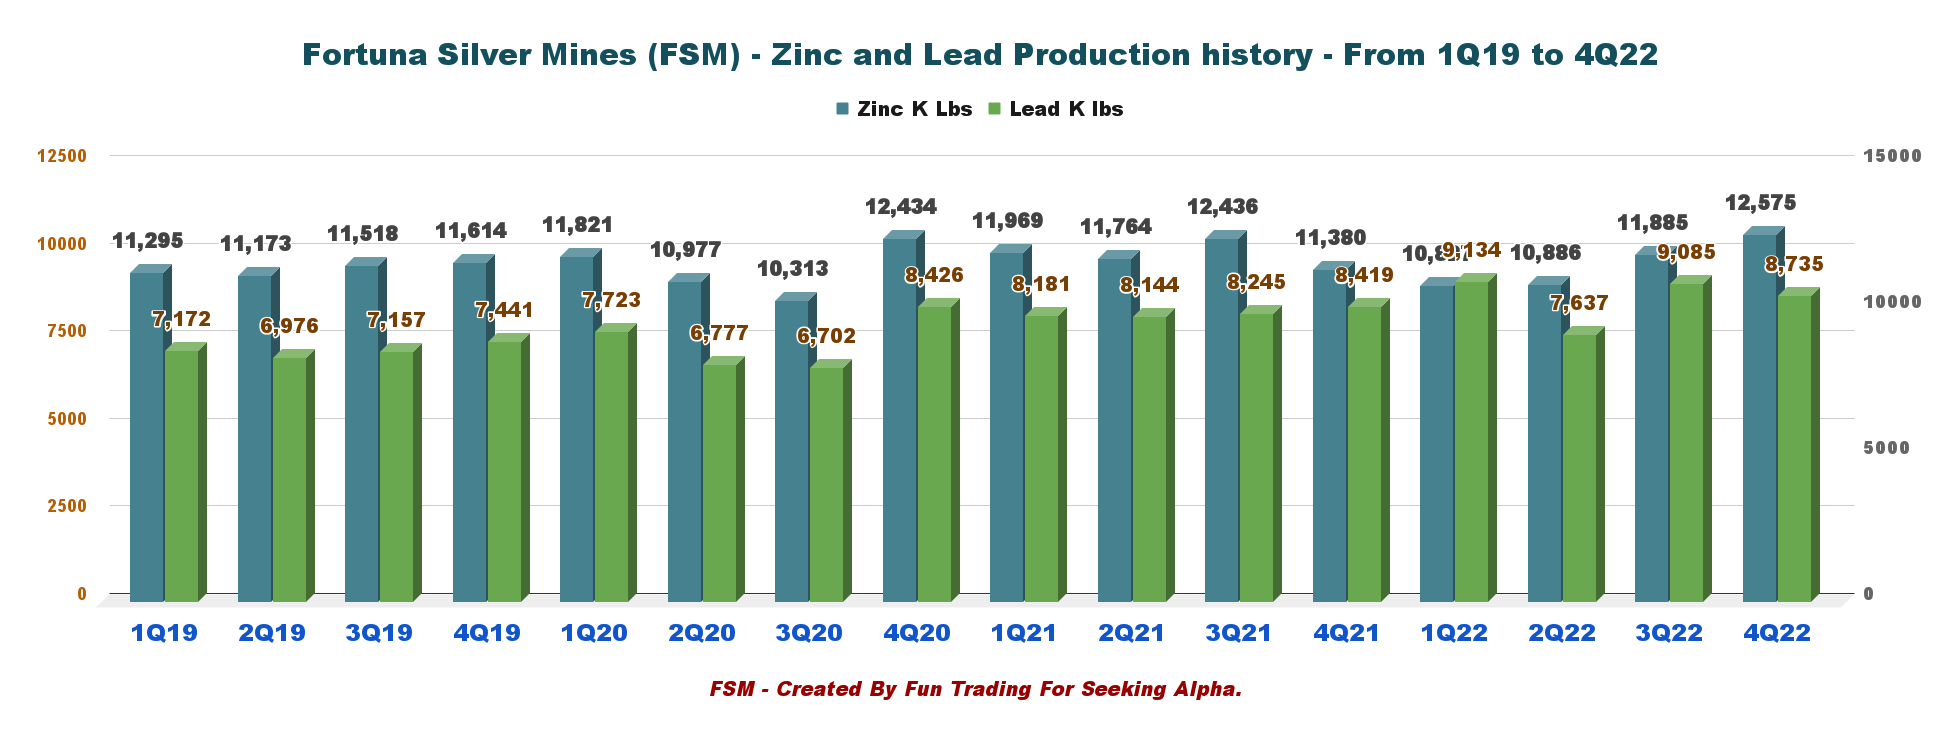
5 – Details Per Mine and Metal Produced
| Production per mine | Gold Oz | Silver Oz | Lead KLbs | Zinc KLbs |
| Lindero Mine, Argentina | 29,301 | 0 | 0 | 0 |
| Yaramoko Complex Burkina Faso | 26,190 | 0 | 0 | 0 |
| San Jose Mine Mexico | 8,499 | 1,473,627 | 0 | 0 |
| Caylloma Mine Peru | 122 | 273,119 | 8,736 | 12,575 |
| Total | 64,112 | 1,746,746 | 8,736 | 12,575 |
6 – Séguéla Project Near Completion
The company indicated that the project was 83% complete at the end of October, and I believe it should be completed soon, with commercial production commencing in 3Q23.
FSM Presentation (FSM Presentation)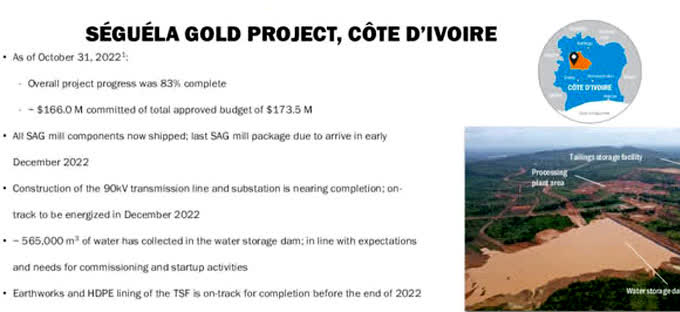
In the press release, Fortuna said that it still expects the first gold pour in 3Q23.
At the Séguéla Gold Project in Côte d’Ivoire, construction activities continued as planned. The mining contractor continued its mobilization and establishment activities with the establishment of key infrastructure and the arrival on site of mining equipment. All senior operational management roles were filled and commenced work on site, with recruitment now focusing on other operational roles. First gold pour is on track for mid-2023.
The proven and probable mineral reserves at the Seguela gold mine were estimated to be approximately 12.1 million tonnes grading 2.8 g/t gold with 1.1 million ounces (Moz) in contained gold as of March 2021. Yearly production is estimated at 120K Au ounces.
6 – Commentary
Fortuna Silver Mines delivered another gold and silver production in 4Q22.
- San Jose Mine produced 1.474 million ounces of silver and 8,499 ounces of gold, a 14% decrease for both metals compared to the equivalent period in 2021. The drop is mainly due to lower head grades, albeit in line with management’s expectations based on the mining sequence and Mineral Reserve estimate.
- Lindero’s gold production in 4Q22 was 29,301 Au ounces, down 19% compared to the fourth quarter of 2021. Lower gold production is attributed to an 8% decrease in tonnes and a 23% decrease in gold grade for ore placed on the pad compared to 4Q21.
- Caylloma produced 273,119 ounces of silver, a 4% increase year-over-year, primarily due to higher grades mined during the period. The mine also produced 122 ounces of gold.
- The Yaramoko Mine produced 26,190 ounces of gold in 4Q22, with an average head grade of 6.45 g/t Au, in line with the mining sequence and Mineral Reserve estimate, and an 8% decrease year-over-year. The decline in production YoY was due to lower head grades. However, grades for the full year were in line with planned estimates.
Technical Analysis (Short-Term) and Commentary
FSM TA Chart short-term (Fun Trading StockCharts)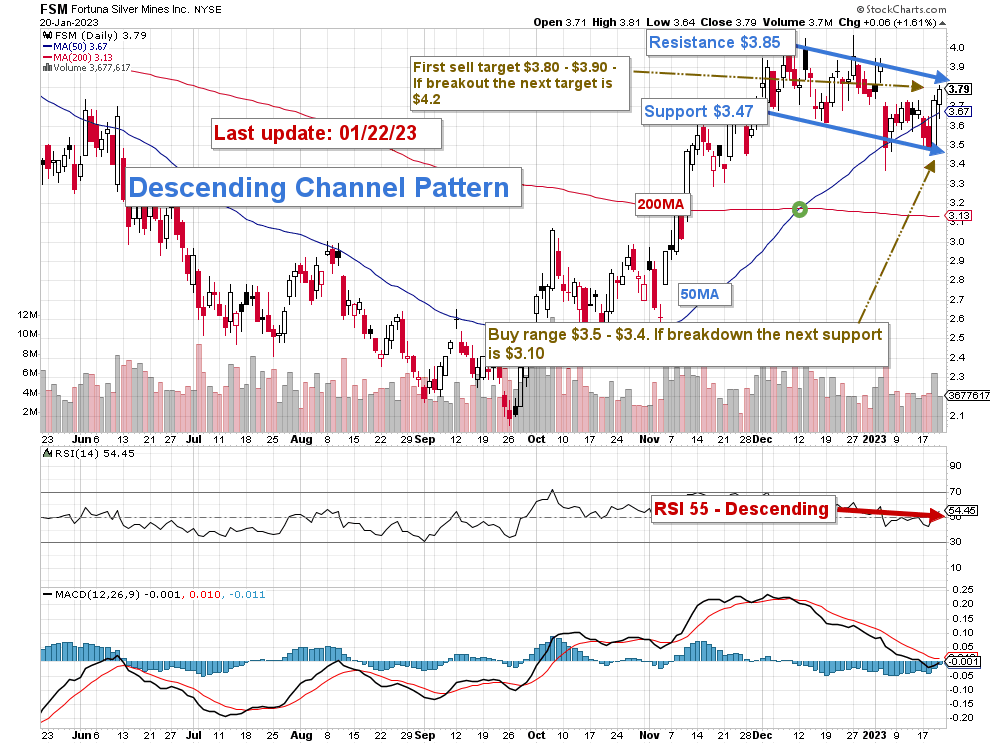
FSM forms a descending channel pattern, with resistance at $3.85 and support at $3.47. Generally, descending channel patterns are short-term bearish, with a stock moving lower within a descending channel, but they often originate within longer-term uptrends.
I regularly recommend keeping a core long-term position and using about 40% to trade FSM short-term LIFO. I promote this simple but working-fine strategy in my marketplace, “The Gold And Oil Corner.” it allows you to wait for a higher final price target for your core-long position, which I see between $4 and $5.
I suggest selling partially between $3.80 and $3.90, with possible upper resistance at $4.20 and waiting for a retracement between $3.5-$3.4, with likely lower support at $3.10 for the 200MA. There is no guarantee it will reach this target, but it is reasonable if the stock turns bearish.
The issue of gold and silver prices direction will be decided by the Fed next week. The gold price has jumped significantly since November, and to keep the momentum alive, the Fed will have to hike interest rates by no more than 25 points, which is not a done deal right now.
Thus, watch the gold and silver prices like a hawk.
Warning: The TA chart must be updated frequently to be relevant. It is what I am doing in my stock tracker. The chart above has a possible validity of about a week. Remember, the TA chart is a tool only to help you adopt the right strategy. It is not a way to foresee the future. No one and nothing can.
Author’s note: If you find value in this article and would like to encourage such continued efforts, please click the “Like” button below to vote of support. Thanks.
Be the first to comment