

Dalgic/iStock via Getty Images
Introduction
Fortuna Silver Mines (NYSE:FSM) released its third-quarter 2022 production results on October 6, 2022.
Note: This article is an update of my article published on August 31, 2022.
The Company delivered a solid production quarter, with all mines on target to achieve annual guidance for silver and gold. The company reported that it is in an excellent position to achieve the upper range of silver annual guidance of 6.2 to 6.9 Moz. For 2022 is expected to be between 369K and 420K GEOs.
FSM 2022 Guidance (FSM Presentation)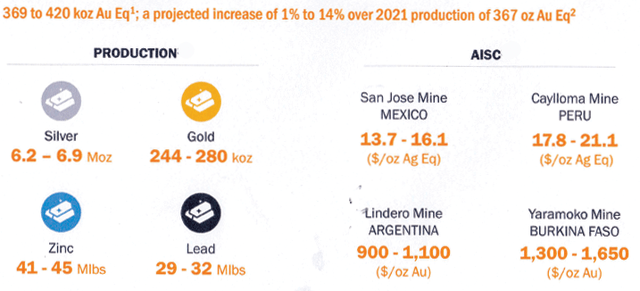
Second Quarter Gold and Silver Production commentary
Note: In the press release, the company reported the following:
Au Eq includes gold, silver, lead and zinc and is calculated using the following metal prices: $1,718/oz Au, $19.16/oz Ag, $1,989/t Pb and $3,268/t Zn or Au:Ag = 1:89.65, Au:Pb = 1:0.90, Au:Zn = 1:0.53 (For 3Q22)
2.1 – Gold and silver production history
FSM Quarterly Gold and silver production history (Fun Trading)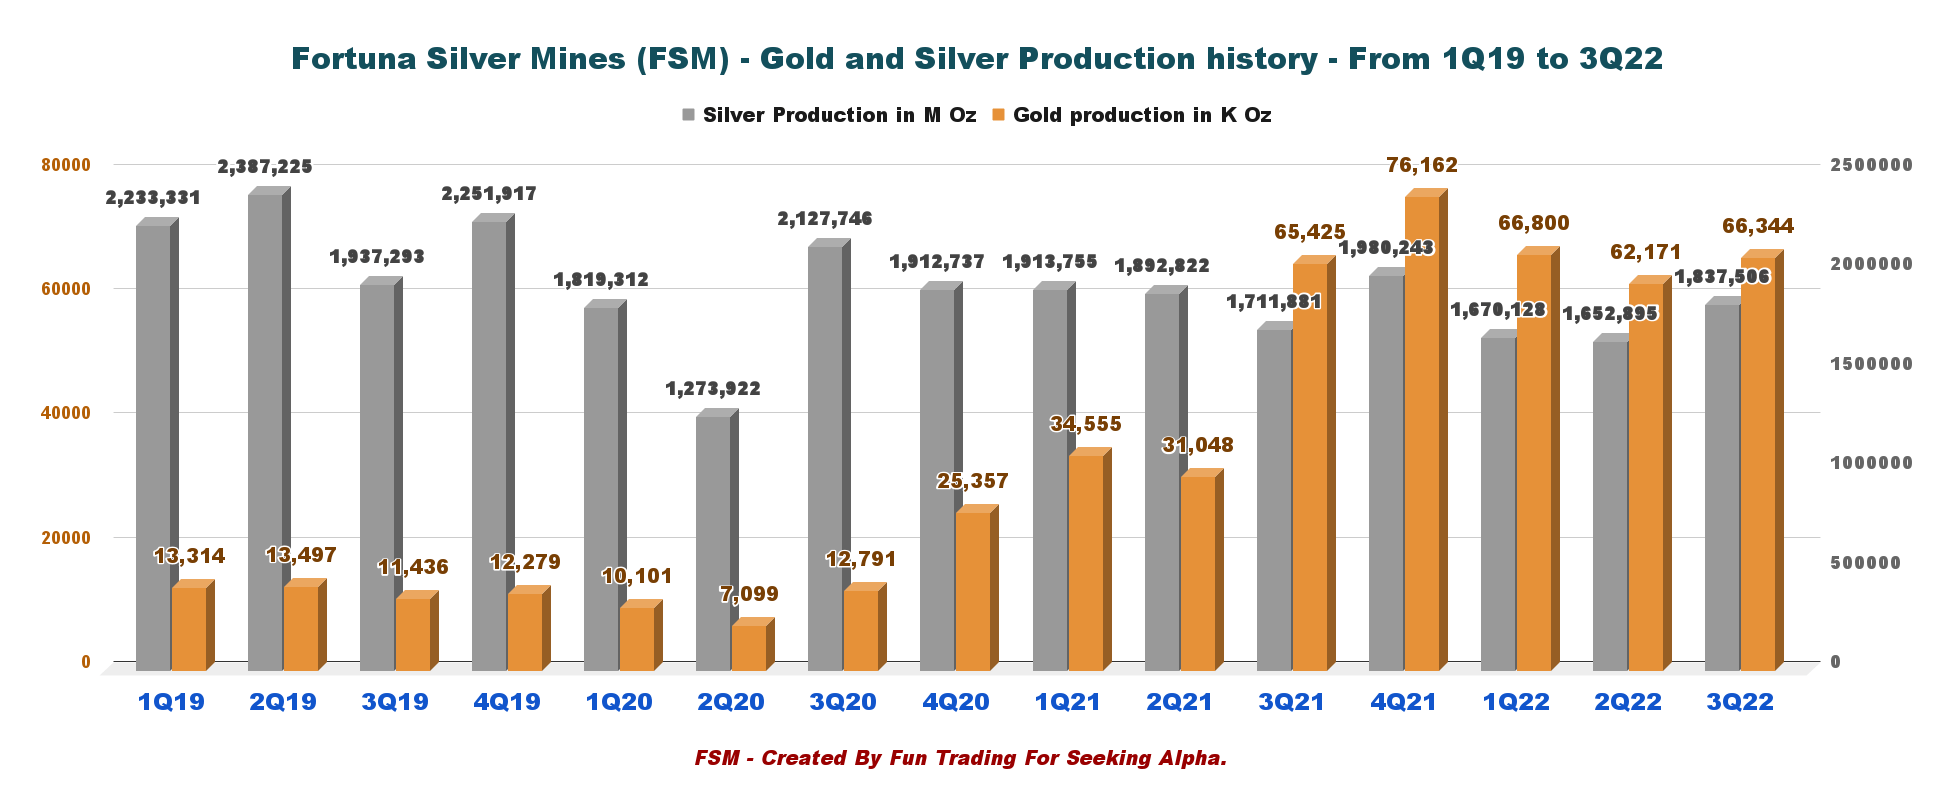
For 3Q22, Fortuna Silver Mines produced 1,837,506 ounces of silver and 66,344 ounces of Gold. Production was up sequentially and YoY, as shown in the graph above.
2.2 – Gold and silver prices history
The gold price was $1,718 per ounce, and the silver price was $19.16 per ounce. Both prices were mainly below the preceding quarter.
FSM Quarterly Gold and silver prices history (Fun Trading)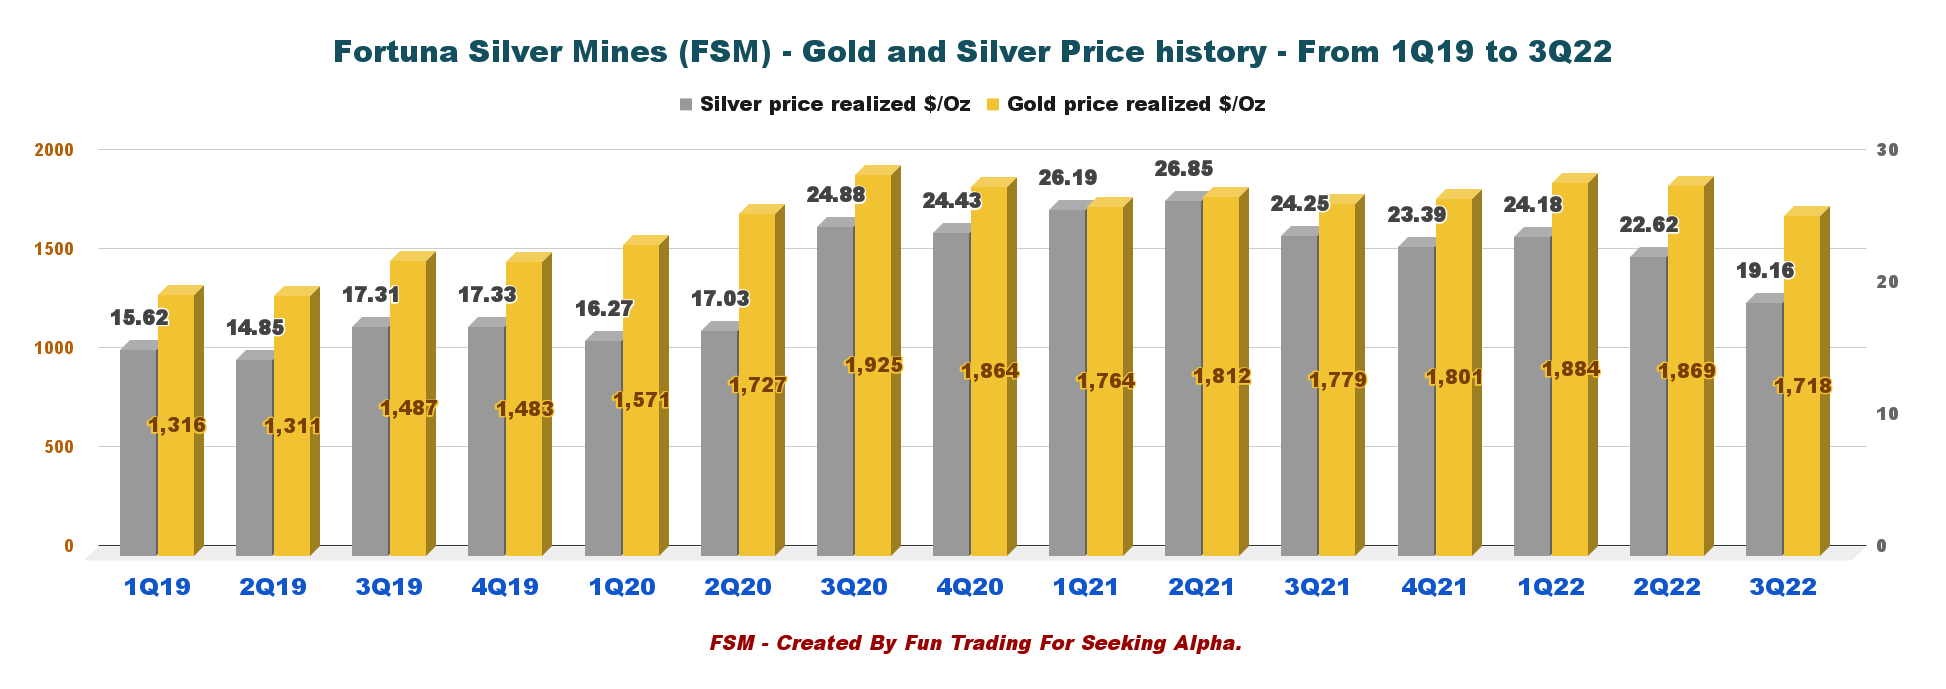
Silver is still underperforming Gold, but the metal did quite well recently, as we can see below:
FSM: Au Ag comparison 1 year (Fun Trading)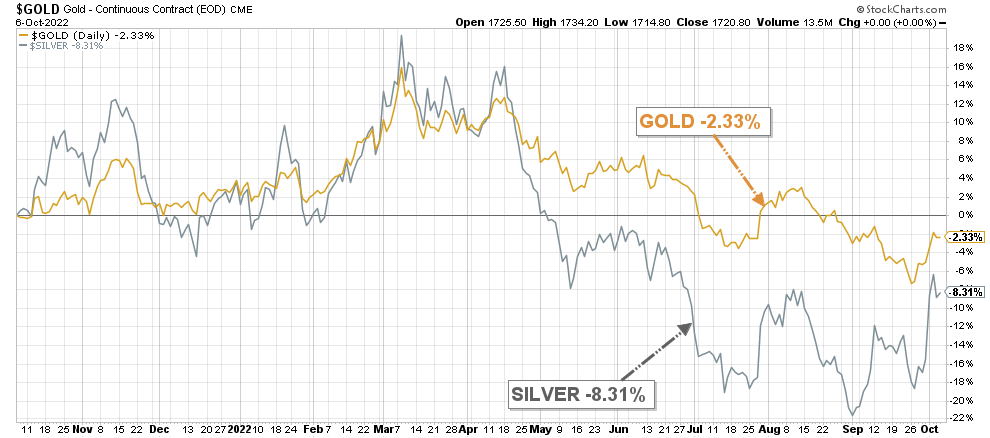
2.3 – Zinc and Lead production history (Caylloma Mine)
Production for Lead was 9.085 Mlbs and 11.885 Mlbs for Zinc.
FSM Quarterly production of Lead and Zinc history (Fun Trading)
2.4 – Details per mine and metal produced
| Production per mine | GOLD Oz | SILVER Oz | LEAD KLbs | ZINC KLbs |
| Lindero Mine, Argentina | 30,032 | 0 | 0 | 0 |
| Yaramoko Complex Burkina Faso | 27,130 | 0 | 0 | 0 |
| San Jose mine Mexico | 9,091 | 1,545,410 | 0 | 0 |
| Caylloma mine Peru | 91 | 292,096 | 9,085 | 11,885 |
| Total | 66,344 | 1,837,506 | 9,085 | 11,885 |
2.5 – Commentary
Fortuna Silver Mines delivered solid Gold and silver production in its three mines in South America and its mine in Burkina Faso, Africa.
- San Jose mine produced its highest silver production quarter in 2022, placing the operation in a solid position to achieve the upper range of annual guidance.
- Lindero’s stable gold production performance, a 14.5% production increase compared to the third quarter of 2021, is on track to meet the annual guidance range. The operation continues capturing higher productivity gains and showing a stable production performance.
- Caylloma continues to deliver strong production consistent with the upper range of annual guidance.
- The Yaramoko Mine produced 27,130 ounces of Gold in the third quarter of 2022 with an average gold head grade of 6.21 g/t, which is in line with the mining sequence and Mineral Reserve estimate. The mine benefitted from higher throughput and operating time during the quarter, offset by lower head grades compared to the third quarter in 2021.
- Also, the Company indicated that its Séguéla gold Project in Côte d’Ivoire is on time and budget despite challenges in the supply and logistics markets experienced in the preceding quarter.
FSM Seguela Project (FSM Presentation)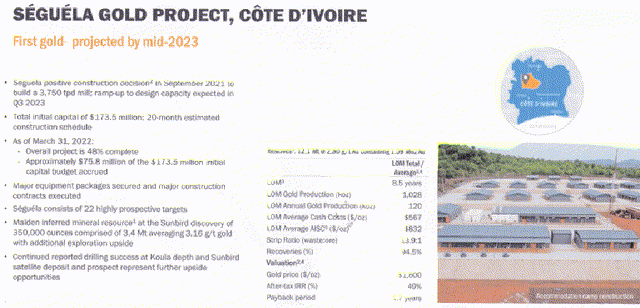
The overall project is now 78% completed as of September 30, 2022, up from 64% in April 2022. The first Gold is expected by the end of 2Q23.
At the Séguéla gold Project in Côte d’Ivoire, despite some delays incurred in the manufacture and delivery of certain SAG mill components, construction activities are progressing in line with schedule and budget. As of September 30th, overall project progress was 78 percent complete. Many equipment packages have arrived at site, earthworks and civil works are well advanced, and work has commenced on structural, mechanical and piping critical path activities at the processing plant. First gold pour continues to be projected for mid-2023.
Technical Analysis (Short-Term) and Commentary
FSM TA Chart short-term (Fun Trading StockCharts)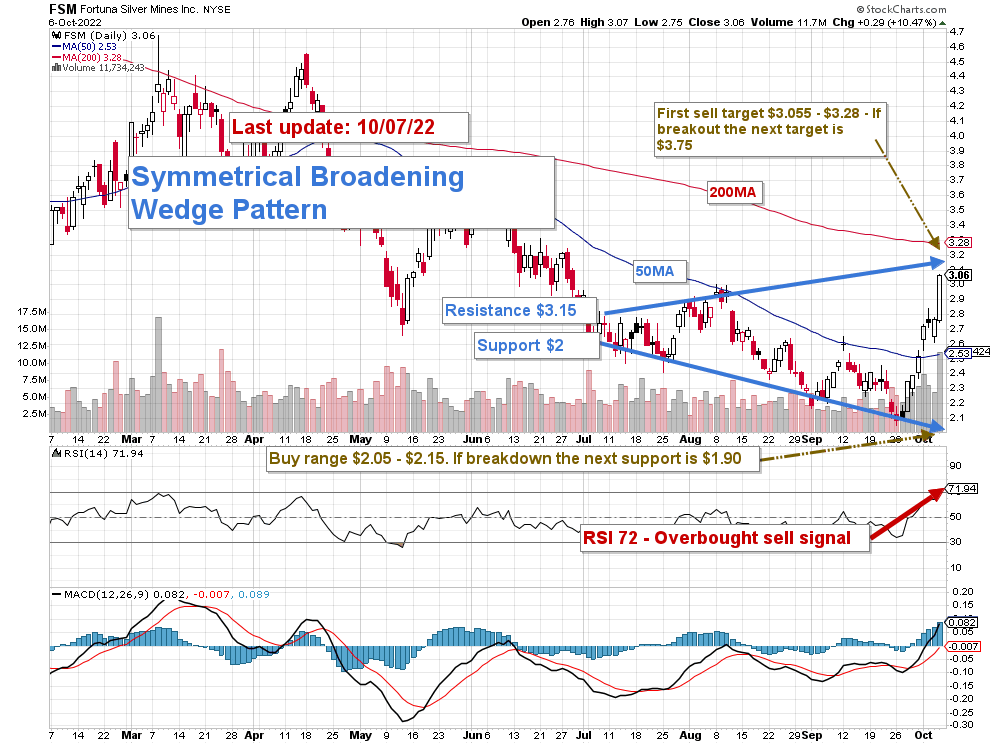
FSM forms a Symmetrical Broadening wedge pattern with resistance at $3.15 and support at $2. Generally, a broadening wedge pattern is considered bullish, meaning we should experience higher prices soon.
I regularly promote the general strategy in my marketplace, “The Gold And Oil Corner,” to keep a core long-term position and use about 40% to trade short-term LIFO. It allows you to wait for a higher final price target for your core position, which I see between $4 and $5.
I suggest selling partially between $3.05 and $3.28 (200MA) with possible upper resistance at $3.75 and waiting for a retracement between $2.25-$2, with likely lower support at $1.85. However, I believe it is reasonable to start accumulating at 50MA or $2.55.
The issue of Gold and silver price direction is what the Fed will decide in November. The gold price dropped significantly after the Fed hiked 75-point in early July, and we will probably get another 75-point hike in November if the CPI number stays elevated, which is likely.
However, the Fed may still hike 50-point instead to minimize the adverse effects of the move on the economy despite untamed inflation.
Thus, watch the gold and silver prices like a hawk.
Note: The LIFO method is prohibited under International Financial Reporting Standards (IFRS), though it is permitted in the United States by Generally Accepted Accounting Principles (GAAP). Therefore, only US traders can apply this method. Those who cannot trade LIFO can use an alternative by setting two different accounts for the same stock, one for the long term and one for short-term trading.
Warning: The TA chart must be updated frequently to be relevant. It is what I am doing in my stock tracker. The chart above has a possible validity of about a week. Remember, the TA chart is a tool only to help you adopt the right strategy. It is not a way to foresee the future. No one and nothing can.
Author’s note: If you find value in this article and would like to encourage such continued efforts, please click the “Like” button below to vote of support. Thanks.
Be the first to comment