

Oat_Phawat/iStock via Getty Images
Introduction
Fortuna Silver Mines (NYSE:FSM) released its second-quarter 2022 production results on July 11, 2022.
Note: This article is an update of my article published on May 24, 2022.
The company indicated that all four operating mines are on target to achieve annual guidance for silver and gold. Production of gold and silver was a little weaker than the preceding quarter but within expectations.
In the press release, the company said:
The Company delivered a steady production performance in the second quarter of 2022 with all mines on target to achieve annual guidance for silver and gold.
Fortuna reiterates its annual production guidance range of 6.2 to 6.9 million ounces of silver and 244 to 280 thousand ounces of gold; an annual production of between 369,000 to 420,000 ounces gold equivalent in 2022, including lead and zinc by-products
FSM 2022 Guidance Presentation (Fortuna Silver Mines)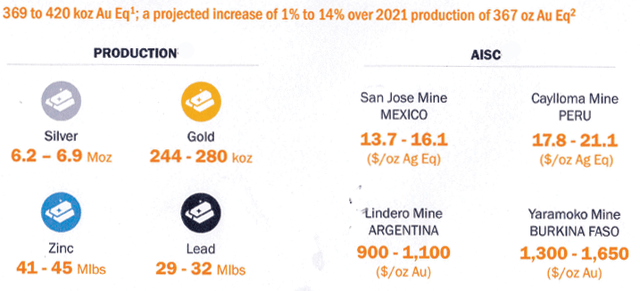
Second Quarter Gold and Silver Production
2.1 – Gold and silver production history
FSM Quarterly gold and silver production history (Fun Trading)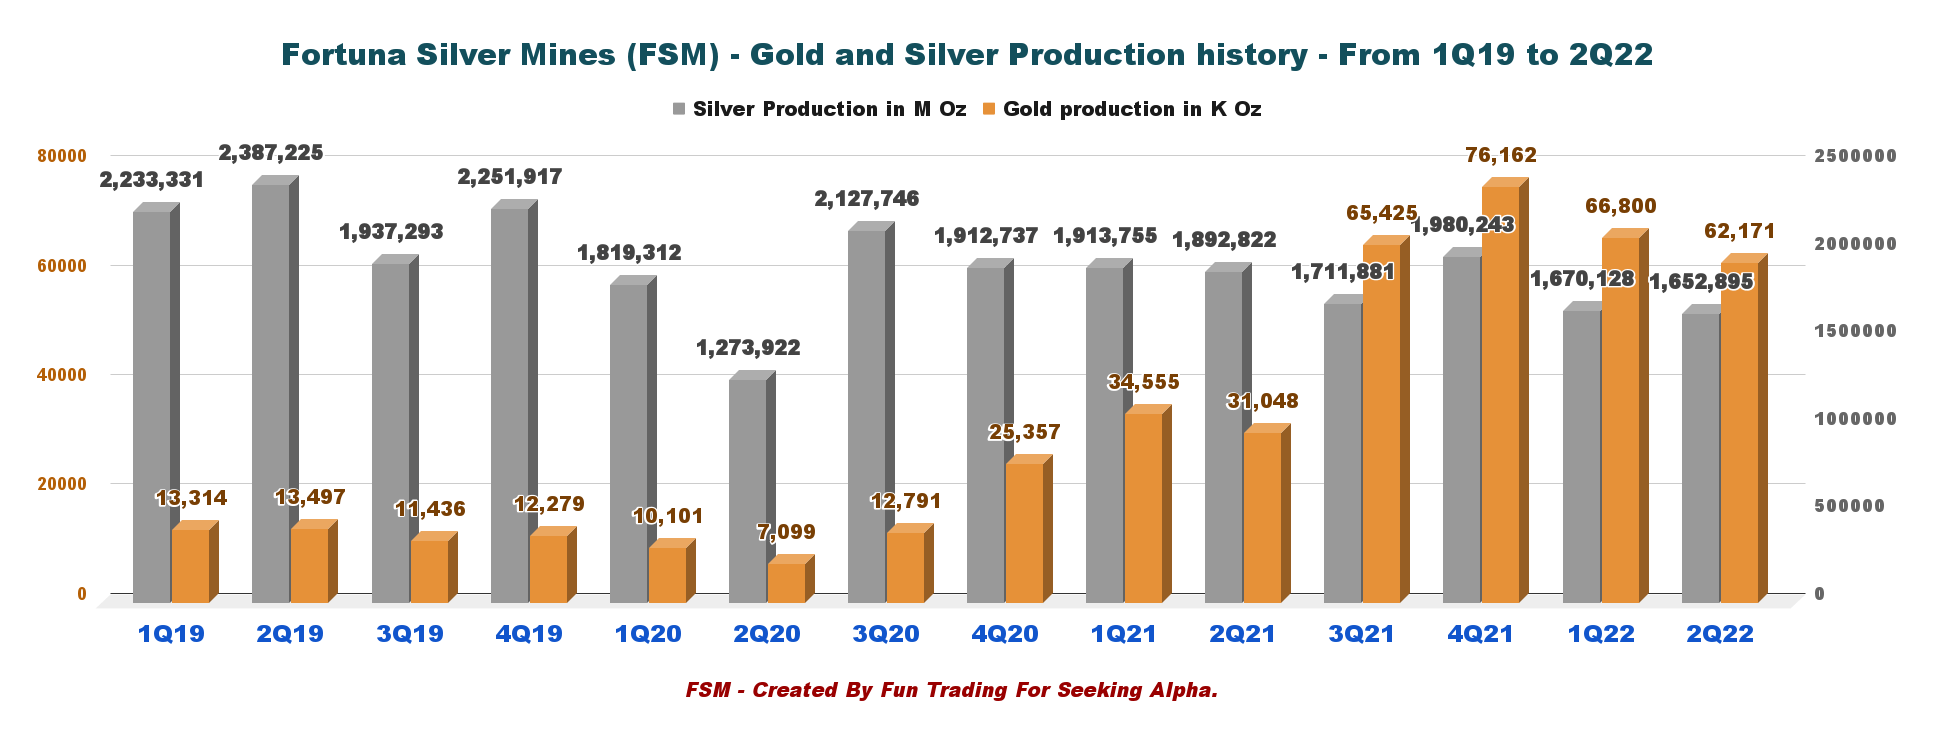
For 2Q22, Fortuna Silver Mines produced 1,652,895 ounces of silver and 62,171 ounces of gold. Production was down sequentially, as shown in the graph above.
2.2 – Gold and silver prices history
The gold price was $1,869, and the silver price was $22.62 per ounce.
FSM Quarterly Gold price and silver price history (Fun Trading )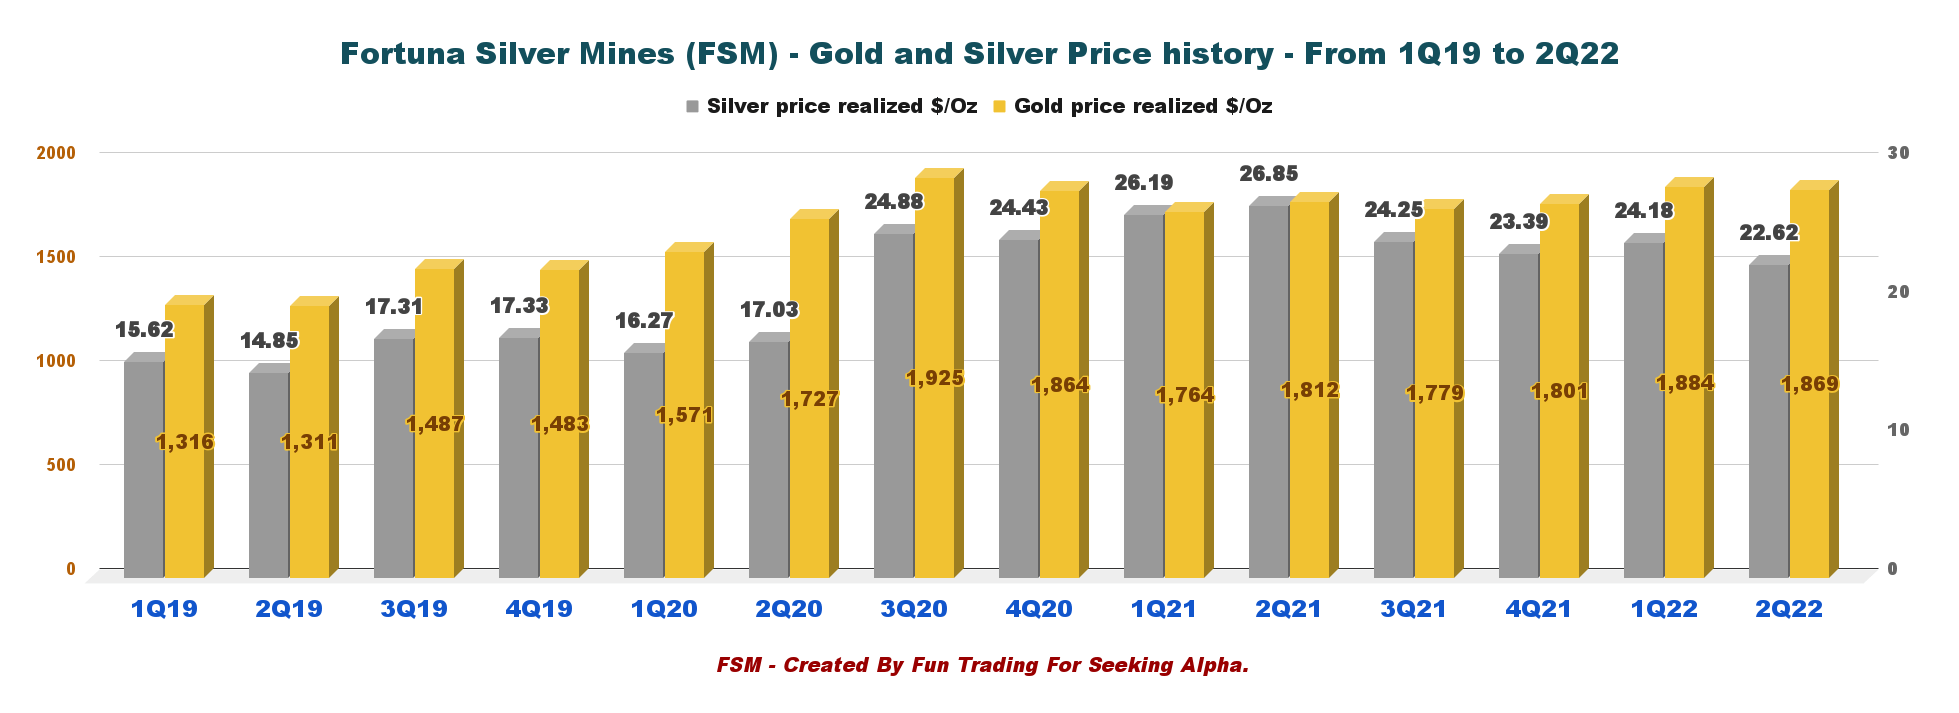
2.3 – Zinc and Lead production history (Caylloma Mine)
Production for Lead was 7,637 Mlbs and 10,886 Mlbs for Zinc.
FSM Quarterly production of Lead and Zinc history (Fun Trading)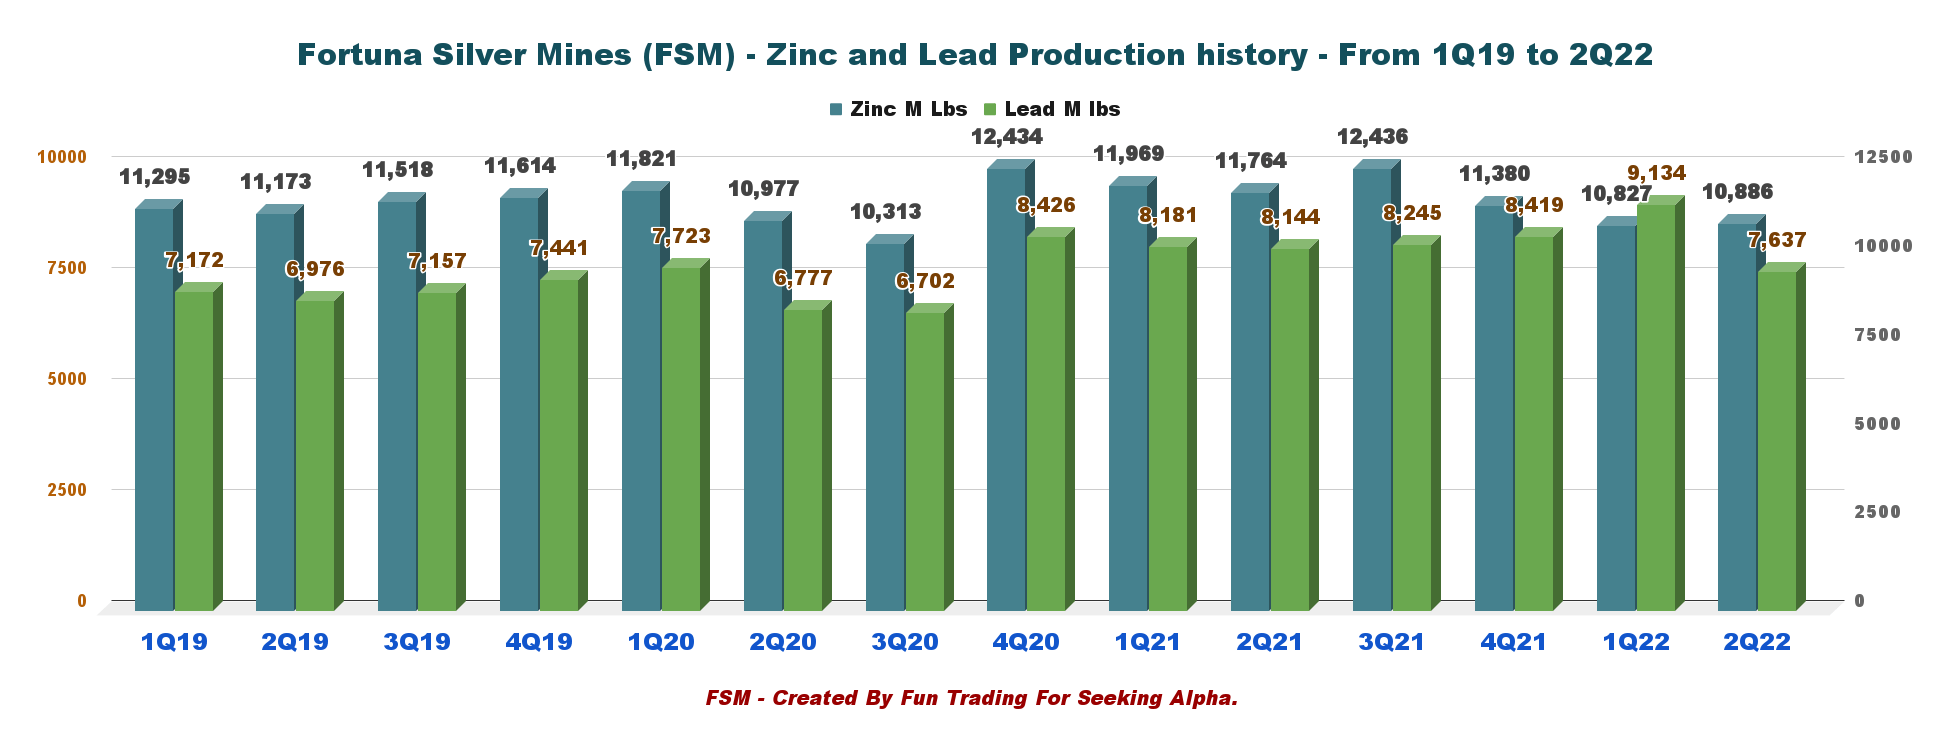
2.4 – Details per mine and metal produced
| Production per mine | GOLD Oz | SILVER Oz | LEAD K lbs | ZINC K Lbs |
| Lindero Mine, Argentina | 29,016 | 0 | 0 | 0 |
| Yaramoko Complex Burkina Faso | 24,553 | 0 | 0 | 0 |
| San Jose mine Mexico | 8,295 | 1,385,336 | 0 | 0 |
| Caylloma mine Peru | 307 | 267,559 | 7,637 | 10,886 |
| Total | 62,171 | 1,652,895 | 7,637 | 10,886 |
2.5 – Commentary
Fortuna Silver Mines delivered solid gold and silver production in its three mines in South America and its mine in Burkina Faso, Africa.
The company indicated that the COVID-19 absenteeism, which impacted production earlier this year, has been significantly reduced and allowed steady output on track to meet the 2022 guidance.
However, it is challenging to compare gold production with the 2Q21 because the company added the production of the Yaramoko complex in Burkina Faso starting in 3Q21.
At the Lindero mine, the grade of ore sent to the leach pad was 17% higher than estimated from the reserve model.
At the San Jose mine, the decrease in YoY results from a combination of 7% lower mill throughput and lower average head grades of 9% for silver and 13% for gold, which are in line with the mining sequence and Mineral Reserve estimates.
At the Caylloma Mine, good overall production is expected to reach the upper range of the guidance.
One minor issue is that the gold and silver production has been dropping since the record high achieved in 4Q21, and hopefully, this downtrend will end soon.
Also, the company indicated that its Séguéla gold Project in Côte d’Ivoire is on time and budget despite challenges in the supply and logistics markets.
FSM Seguela Project Presentation (Fortuna Silver Mines)
The overall project is now 64% completed as of June 30, 2022, up from 55% in April 2022. First gold is expected by the end of 2Q23.
Major equipment packages have started to arrive at site and first gold pour is projected for mid-2023. Fortuna is advancing its organizational infrastructure in Côte d’Ivoire to prepare for the start of operations at Séguéla, as well as establishing a regional office to service both Séguéla and the Yaramoko Mine.
Based on the production of Gold equivalent ounces at 96,512 GEOs, I have estimated the 2Q22 revenues to be between $180 million and $186 million.
Technical Analysis (Short-Term) and Commentary
FSM TA Chart Short-term (Fun Trading)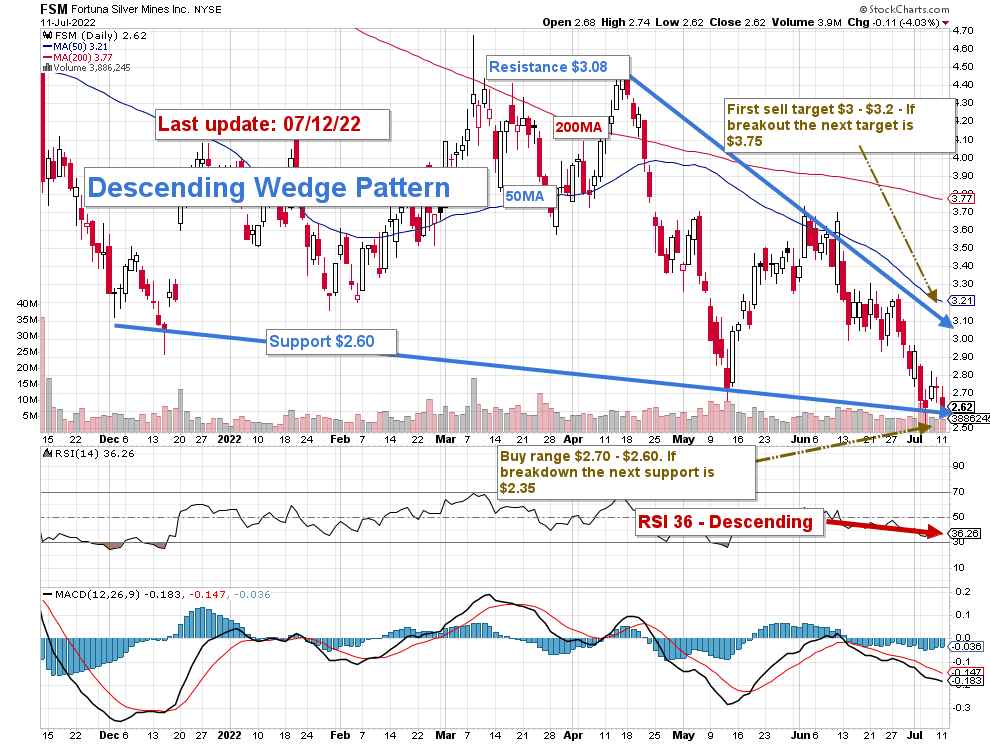
FSM forms a descending wedge pattern with resistance at $3.08 and support at $2.60. Generally, a falling or descending wedge pattern is considered bullish, meaning we should experience a rebound soon.
I regularly promote the general strategy in my marketplace, “The Gold And Oil Corner,” to keep a core long-term position and use about 40% to trade short-term LIFO. It allows you to wait for a higher final price target for your core position, which I see between $6 and $6.75.
I suggest selling partially between $3 and $3.2 and waiting for a retracement between $2.60-$2.70 with possible lower support at $2.35.
The issue of gold and silver price direction is what the Fed will decide in July. The gold price dropped significantly after the Fed hiked 75-point in early June, and we will get probably another 75-point hike soon.
However, the Fed may still hike 50-point instead to minimize the adverse effects of the move on the economy despite inflation being out of control.
Watch the gold and silver prices like a hawk.
Note: The LIFO method is prohibited under International Financial Reporting Standards (IFRS), though it is permitted in the United States by Generally Accepted Accounting Principles (GAAP). Therefore, only US traders can apply this method. Those who cannot trade LIFO can use an alternative by setting two different accounts for the same stock, one for the long term and one for short-term trading.
Warning: The TA chart must be updated frequently to be relevant. It is what I am doing in my stock tracker. The chart above has a possible validity of about a week. Remember, the TA chart is a tool only to help you adopt the right strategy. It is not a way to foresee the future. No one and nothing can.
Author’s note: If you find value in this article and would like to encourage such continued efforts, please click the “Like” button below as a vote of support. Thanks.
Be the first to comment