

naphtalina/iStock via Getty Images
Many in the financial markets have referred to the current pandemic as a war, which has been used to justify creating “war time” fiscal and monetary policy solutions. The recent surge of inflation has led the media and market pundits to fall back on comparisons to the 1970s, resulting in shrill cries of inflationary panic. America has suffered through bouts of inflation before, but most “experts” are only looking back at the precedent from their lifetime: the inflation of the late 1970s and 1980s that was conquered by the draconian policy measures of the Paul Volcker-led Federal Reserve (FED). While the rise in inflation during that time may invite comparisons to today, its root causes-including funding the Vietnam War and the Great Society, delinking the dollar from gold, and an energy crisis-were a decidedly different set of circumstances.
A more appropriate corollary from history may be 1946-1948, the post-World War II inflationary episode resulting from supply shortages due to manufacturing disruptions during peace-time retooling, rebounding demand for consumer goods, high levels of savings, soaring money growth, and the cessation of price controls. With the exception of price controls, this sounds a lot like the scenario playing out today. As for how the 1940s inflation episode ended, supply and demand ultimately came back into balance, and a more primitive version of the Fed-which did not have fed funds rate targeting in its toolkit-slowed the economy by curbing money and credit growth and shrinking its balance sheet. Price increases slowed in 1948 and actually declined in 1949. A brief and mild recession ensued. Equity prices generally remained stable throughout the period. This would be a welcome outcome today, but the execution of monetary policy over the coming months will determine whether inflation ends gently or with a serious recession and further market instability.
The pent-up demand of post-war America was extraordinary: Between 1945 and 1949-a period when the U.S. population was approximately 140 million-Americans purchased 20 million refrigerators, 21.4 million cars, and 5.5 million stoves. This was quite a turnaround from wartime America, when durable goods were so hard to come by that certain items like refrigerators and radios were dropped from the Consumer Price Index (CPI) basket.
At the same time, excess savings generated during the war led to the inevitable growth in liquid assets, a situation that resembles today’s post-COVID surge in savings.
Savings Soared in Wartime and Pandemic
Personal Saving Rate (Guggenheim Investments, Haver Analytics. Data as of 12.31.2021.)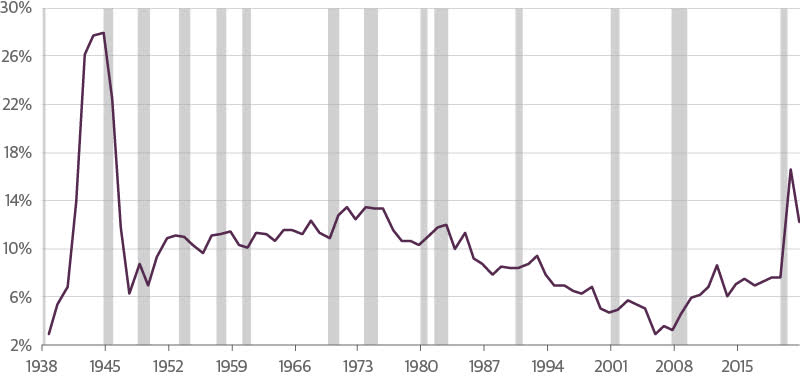
The credit demand by borrowers across the peacetime economy – to farms, homeowners, real estate investors, industry, and even speculators – increased sharply in 1946 and 1947, which further stoked inflationary pressures.
Curbing Credit Growth Was Key to Turning Inflationary Pressure
Private Debt, YoY% Change (Guggenheim Investments, Haver Analytics. Data as of 12.31.2021.)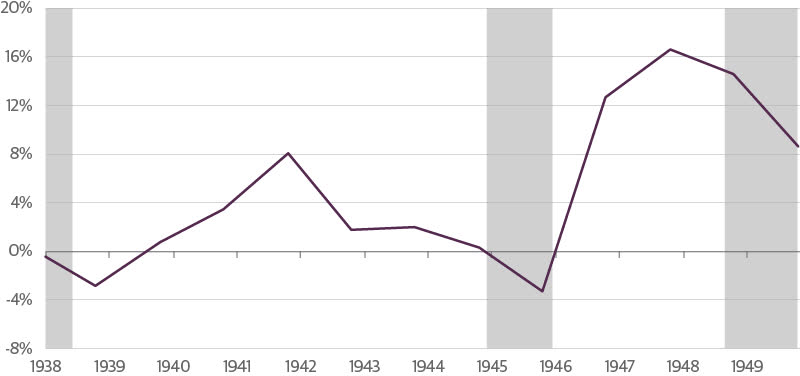
Prices of goods in the CPI Index, which spiked in 1940 and 1941 due to increased wartime manufacturing, were held down during the war by price controls established by the Emergency Price Control Act of Jan. 30, 1942 and maintained by the Office of Price Administration. Most price controls were lifted in 1946, which led to a spike higher in commodities and other products that was sharper than in any period of similar length since 1918 (which also was associated with the end of a war).
In its 1947 Annual Report, the Fed reported that “inflationary developments, which had begun because of wartime shortages of goods in relation to income, were carried forward through 1947 by a rising spiral of costs, prices, and incomes, supported by use of past savings and by substantial credit expansion.” The combination of a surge in demand, reduced supplies of goods, excess liquidity and credit, and the abolishment of price controls allowed CPI to skyrocket. Inflation, which was 3.1 percent year over year in June 1946 almost one year after the end of the hostilities, peaked nine months later at 20.1 percent in March 1947.
Wartime Inflation Proved to Be Transitory
All-Items Consumer Price Index, 12-Month % Change, 1941-1951 (Guggenheim Investments, St. Louis Fed. Data as of 2.25.2022.)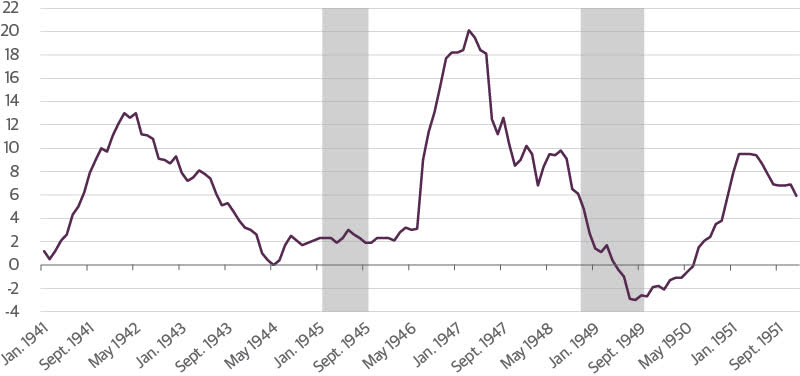
The spike in inflation followed a period of explosive growth in the monetary base-essentially all currency in circulation and reserves on bank balance sheets, which is the foundation of money supply. Mirroring the growth in the monetary base was the growth in securities held on the Fed’s balance sheet, which grew 300 percent from $6.2 billion in 1942 to $24.5 billion in 1945, a much larger increase than the 100 percent jump from pre-pandemic 2020 to today. (To extend the comparison even further, from pre-financial crisis in 2007 to 2022 the Fed’s balance sheet increased almost 900 percent, compared to 1,260 percent from pre-Depression 1928 to 1945.)
Fed Typically Grows Its Balance Sheet in Times of Economic Distress
Growth Rates 1928-1945 vs. 2007-2021 (Guggenheim Investments, Bloomberg, St. Louis Fed. Data as of 12.31.2021.)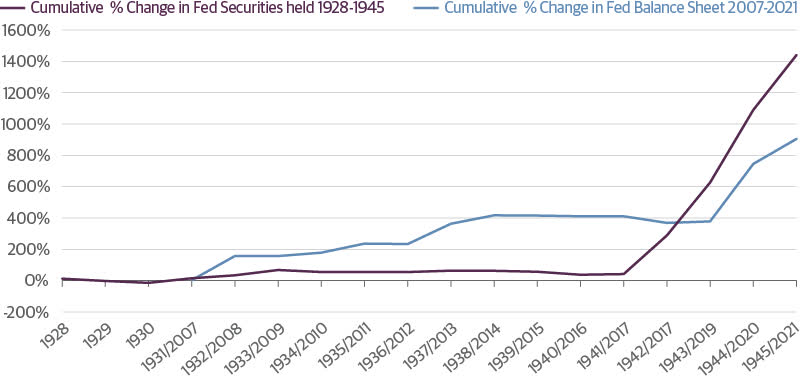
The rise in the monetary base and the Fed’s balance sheet during wartime was to be expected, not unlike the growth in money supply and quantitative easing during the present-day pandemic response.
Fed Slowed Monetary Base Growth After Wartime Spike
Monetary Base 1936-1953 (Guggenheim Investments, St. Louis Fed. Data as of 2.25.2022.)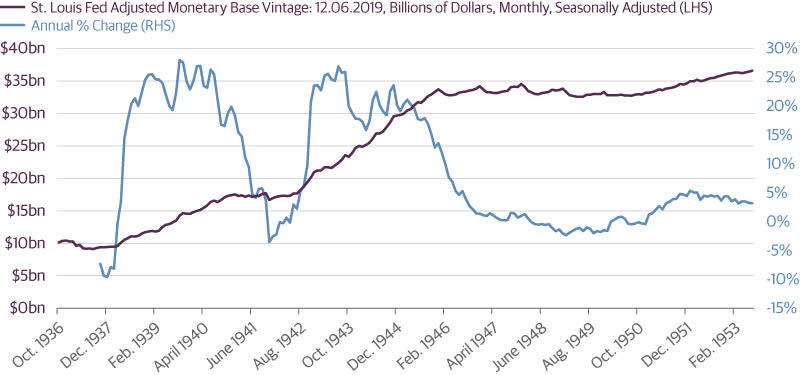
The inflationary period subsided rapidly after the March 1947 peak, with disinflation giving way to outright deflation from May 1949 to June 1950. How did the inflationary period end? First, pent-up demand subsided, supply came on board as prices rose, and production and manufacturing capacity transitioned from wartime to peacetime activity. In other words, the market’s “invisible hand” worked as expected.
High Prices Are Weighing on Demand, Unlike the 1970s
Consumer Sentiment Survey: Buying Conditions for Vehicles, Houses, and Household Durable Goods (Guggenheim Investments, University of Michigan. Data as of 12.31.2021.)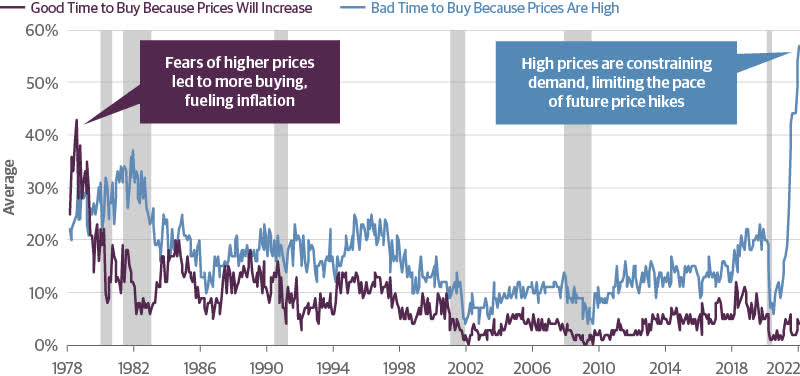
Second, monetary policy tightened, but using a few different elements than what we are used to seeing. As explained in the 1948 Fed Annual Report: “Federal Reserve policies during most of 1948…were directed toward exerting restraint on inflationary credit expansion while at the same time maintaining stability in the market for government securities.” The problem of restraining (or expanding) credit growth, as explained in the Fed’s 1948 Annual Report, was solved through managing the supply of bank reserves, which were essential for bank liquidity and controlled through the Fed’s balance sheet. “The exceptional and assured liquidity of the banking system, which is an element of strength in a period of recession, can be a source of danger in a period of boom.”
The Inflation Policy Cycle
Throughout economic history, inflation has proven to be a condition that is caused by, and addressed with, the same dynamics-rising and falling demand as a result of price movement, the market’s adjustment of interest rates, and monetary policy rate-setting. A rational and disciplined approach to inflation recognizes that each of these dynamics plays a vital role.
Guggenheim Investments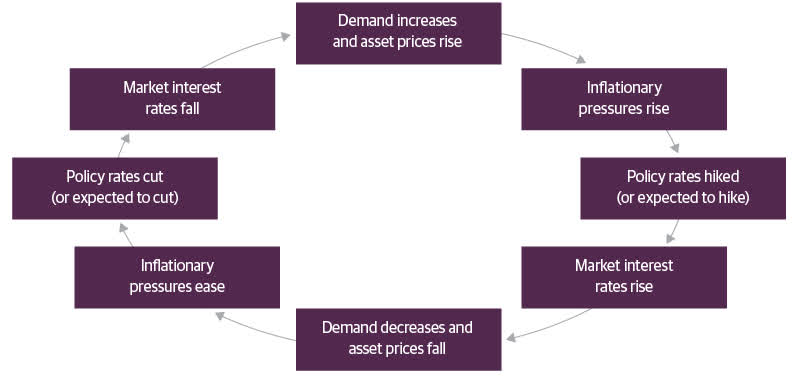
Notably missing in all of the discussion of Fed policy during this period is a discussion of interest rate management. During the war, the Fed was an active purchaser of Treasury debt to help fund expanded deficit financing. With the encouragement of the Treasury to help keep borrowing costs down, in April 1942 the Fed formally pegged the T-bill rate at 0.0375 percent. The Fed also informally pegged long-term rates as well. As post-war inflationary pressures grew, the Fed was limited in its ability to slow money and credit growth by these interest rate pegs, and in 1947 the Treasury finally agreed to let market forces determine short-term rates of Treasury bills. As a result, the yield curve flattened, monetary aggregates fell, and credit conditions tightened. A brief and mild recession followed, from November 1948 to October 1949.
Yield Curve Flattened After Removal of T-Bill Target
3-mo T-Bill yield and the 3-mo/10 yr curve (Guggenheim Investments, St. Louis Fed, Haver Analytics. Data as of 2.25.2022.)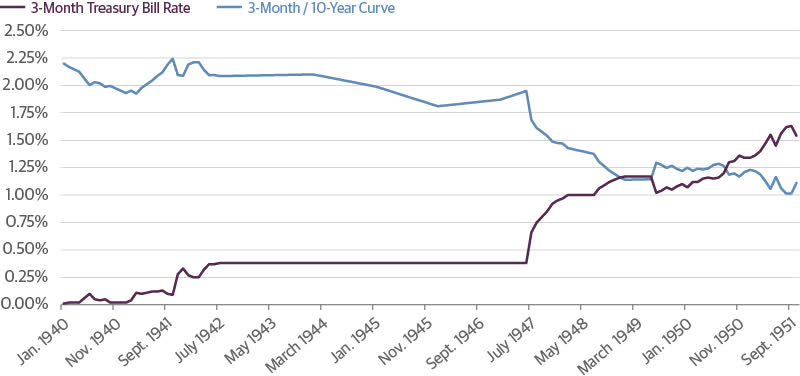
Interestingly, while short-term rates rose significantly, real rates remained in negative territory until November 1948 when a mild recession resulted in price deflation. While equities entered a brief bear market, stocks generally stabilized, resuming their rise in mid-1949.1
After a Brief Bear Market, Equities Stabilized and Resumed Rising
S&P 500 Index (Guggenheim Investments, Haver Analytics. Monthly averages shown.)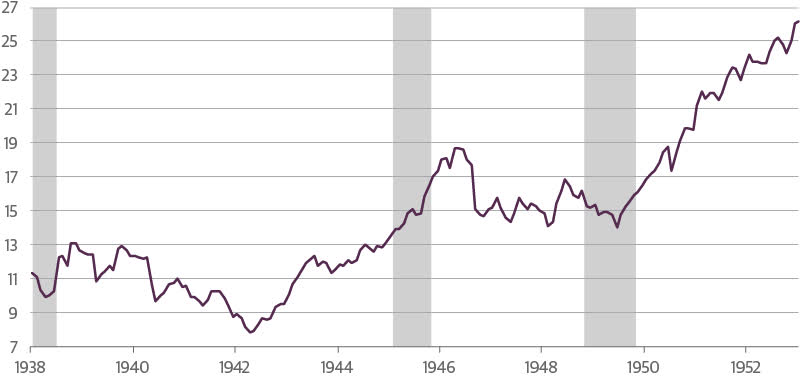
The monetary policy takeaway from the 1946-1948 post-war period is that a significant variable in that inflationary episode was the supply-demand imbalances caused by the virtual cessation of production of consumer durables to build an “arsenal for democracy.” In post-war America these imbalances ultimately were resolved with the normalization of monetary policy allowing free market forces to balance supply and demand for consumer goods and stabilize market prices. As in the 1940s, the market’s invisible hand will ultimately do the same today if free market forces are allowed to signal production adjustments as long as policymakers do not interfere.
Importantly, the monetary policy prescriptions of the post-war Fed were focused on the supply of money and credit, not the price of money and credit. As I wrote recently, by managing money supply to control inflation, the Fed could allow market forces to determine the appropriate overnight rate while monitoring inflation. You cannot control both the supply and price of any commodity, including credit. Market feedback, if allowed, would guide the Fed on how to manage the money supply by adjusting reserve balances through changes in the size of its balance sheet.
After the Fed removed controls on short-term interest rates in 1947, the market was able to do its job and naturally stabilize output and establish a new price equilibrium. As the chart below shows, the Fed successfully brought down the growth rate of money supply in the post-war era to below zero, without controlling short-term rates.
Monetary History: Post-WWII Is Closest Comparison to Today
M2 Money Supply, YoY% Change (Guggenheim Investments, Haver Analytics. Data as of 1.31.2022.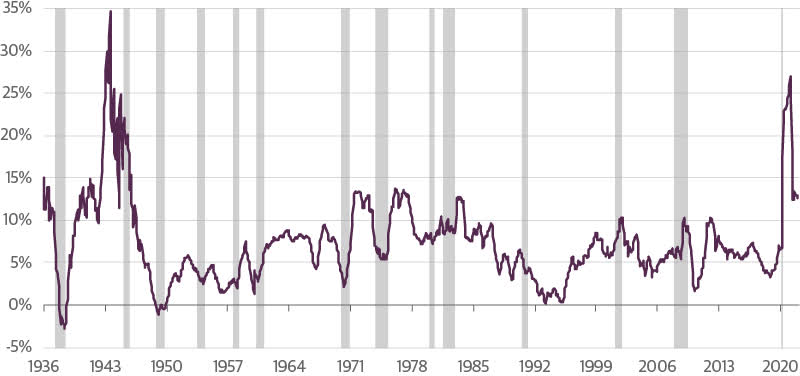
Today, M2 growth, which peaked at levels not seen since World War II, has been declining. With the Fed likely to embark on a path of reducing its balance sheet while simultaneously raising the policy rate, the risk is much greater that the result will not be a quick, mild recession like we saw in 1949, but a much more serious downturn associated with greater market volatility, and a potential financial crisis. Given the record levels of leverage in the corporate sector and the rich valuation of financial assets along with surging prices in real estate and other speculative assets, the prospects for policy error are high.
The Fed is already getting important market feedback, as evidenced by different measures of inflation expectations. As shown by the 5Y/5Y TIPS breakeven, and the New York Fed’s consumer inflation survey, the market is fairly comfortable that the Fed can manage this inflationary episode.
Inflation Expectations Are Well Managed Today
Guggenheim Investments, Haver Analytics. Data as of 1.31.2022 for NY Fed, 2.18.2022 for TIPS.
Interestingly, over the years the three-month T-bill yield has moved roughly in line with the annual rate of change in Core Personal Consumption Expenditures (Core PCE), but never have they diverged like we see today, a sign of confidence in the transitory nature of the current inflation spike.
The Market Is Signaling Lower Inflation Expectations
3-Month T-bill vs. Core PCE YOY% change (Guggenheim Investments, Haver Analytics. Data as of 1.31.2022.)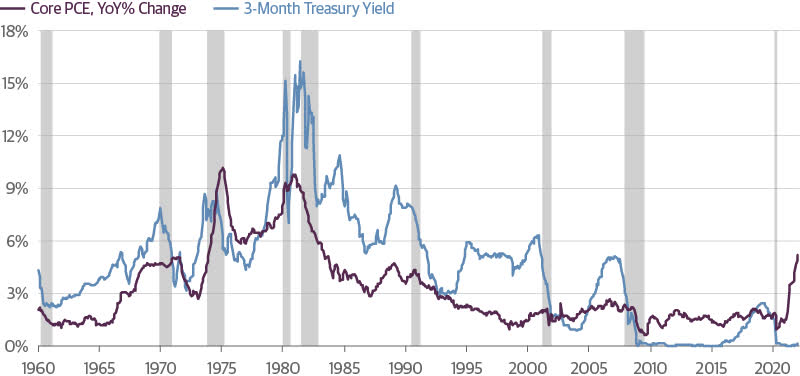
Policymakers would be wise to look to the past to design policy that can successfully end the current surge in prices. Attempts to contain inflation in the 1970s were focused on targeting short-term rates instead of limiting credit creation through controlling the Fed balance sheet and the money supply. This policy was an obvious failure. In the post-financial crisis period, policymakers seem to have lost faith in the power of markets to set prices and balance supply and demand, and have gained too much faith in their own ability to do the same. Perhaps a rational and disciplined approach adhering to monetary orthodoxy as demonstrated in the 1940s would greatly reduce the risk of policy error, avoid the inflation spiral of the 1970s, and reduce the risk of yet another financial panic in the near future.
Important Notices and Disclosures
Investing involves risk, including the possible loss of principal.
One basis point is equal to 0.01 percent.
1. The epilogue to this story is the Fed-Treasury Accord of 1951, by which the Fed was able to halt the support of the Treasury market and resume its function as an independent monetary policymaking body.
This material is distributed or presented for informational or educational purposes only and should not be considered a recommendation of any particular security, strategy or investment product, or as investing advice of any kind. This material is not provided in a fiduciary capacity, may not be relied upon for or in connection with the making of investment decisions, and does not constitute a solicitation of an offer to buy or sell securities. The content contained herein is not intended to be and should not be construed as legal or tax advice and/or a legal opinion. Always consult a financial, tax and/or legal professional regarding your specific situation.
This material contains opinions of the author or speaker, but not necessarily those of Guggenheim Partners or its subsidiaries. The opinions contained herein are subject to change without notice. Forward looking statements, estimates, and certain information contained herein are based upon proprietary and non-proprietary research and other sources. Information contained herein has been obtained from sources believed to be reliable, but are not assured as to accuracy. No part of this material may be reproduced or referred to in any form, without express written permission of Guggenheim Partners, LLC. There is neither representation nor warranty as to the current accuracy of, nor liability for, decisions based on such information. Past performance is not indicative of future results.
Guggenheim Investments represents the following affiliated investment management businesses: Guggenheim Partners Investment Management, LLC, Security Investors, LLC, Guggenheim Funds Distributors, LLC, Guggenheim Funds Investment Advisors, LLC, Guggenheim Corporate Funding, LLC, Guggenheim Partners Europe Limited, Guggenheim Partners Fund Management (Europe) Limited, Guggenheim Partners Japan Limited, GS GAMMA Advisors, LLC, and Guggenheim Partners India Management.
© 2022 Guggenheim Partners, LLC. All rights reserved.
Be the first to comment