

FOMC Talking Points:
- The FOMC has just announced a 25 basis point rate hike, the first since 2018.
- This is lift-off as the Fed begins to pare back pandemic stimulus, largely in response to still-aggressive inflation. The Fed’s forecasts were telling today, with the bank looking for another 5-6 hikes this year while expecting inflation to fall to 4.3% by the end of the year, 4.1% for core.
- This write-up will be guiding through the press conference, with updates throughout the event. The time of each update will be denoted before the passage itself.
- The analysis contained in article relies on price action and chart formations. To learn more about price action or chart patterns, check out our DailyFX Education section.
2:25
We’re getting closer to the press conference and our own Christopher Vecchio just covered the FOMC statement for the March rate decision. The big news of course is the 25 basis point hike, although this wasn’t much of a mystery. This move was well-telegraphed ahead of time and given the Fed’s quandary with inflation it was seemingly a necessity.
But 25 basis points is unlikely to do much to inflation. Likely, the Fed is going to need to do this many more times this year, and in the forecasts that they just released, they highlighted a possibility of another 5-6 hikes through this year. And they’re still expecting inflation to be at 4.3% by the end of the year, even with that taken into account.
In response, the US Dollar put in a strong bounce from a support zone that was tested a little earlier this morning.
US Dollar Hourly Price Chart
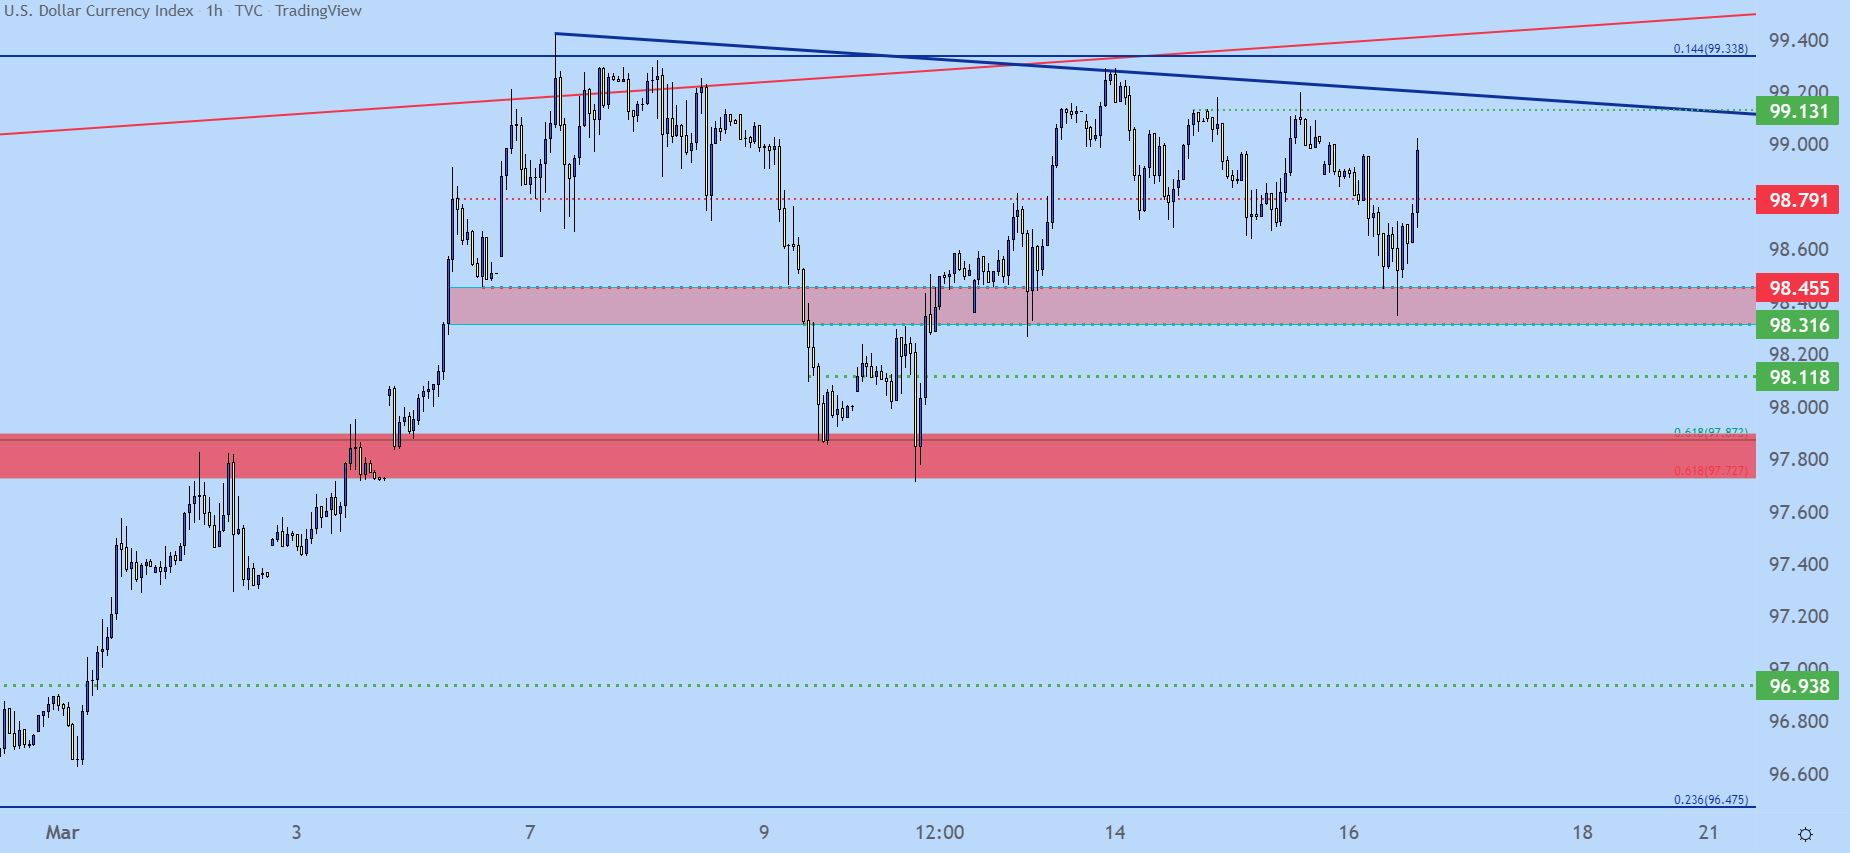
Chart prepared by James Stanley; USD, DXY on Tradingview
2:35
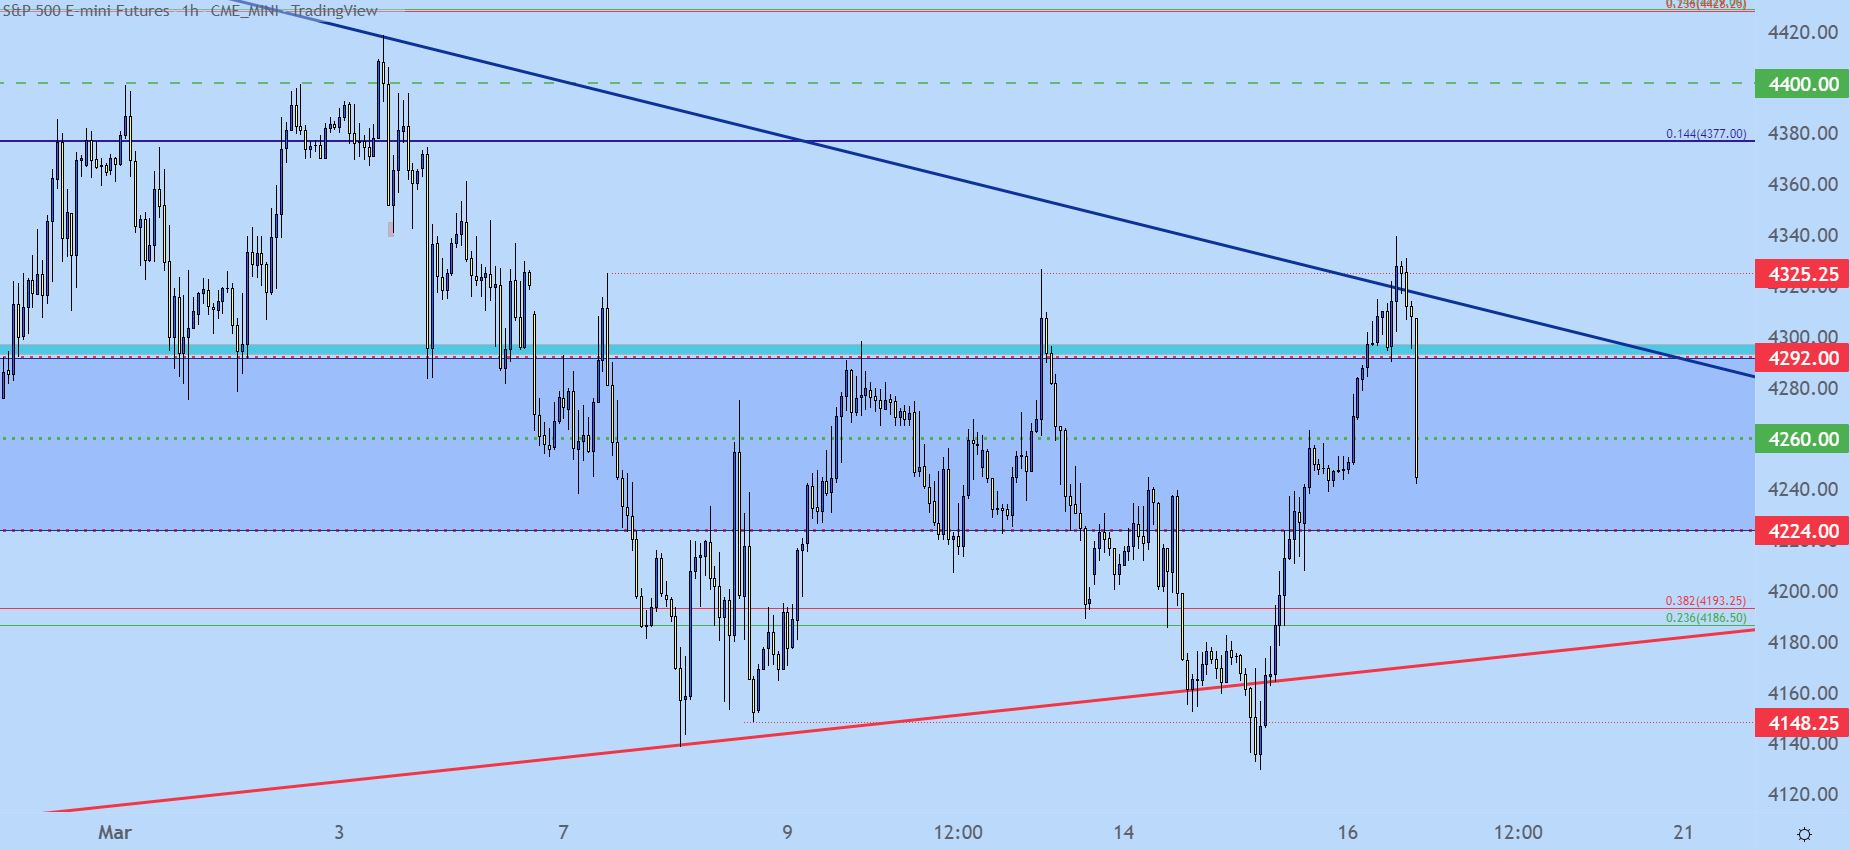
Presser is beginning and very early in the speech Powell is remarking on inflation potential from the Russian invasion of Ukraine. Stocks aren’t liking this news with the S&P 500 pushing back down to a session low.
I talked about the backdrop in stocks earlier today. Next support in SPX on my chart is around 4224, after which there’s a spot between 4186 and 4193.
S&P 500 Hourly Price Chart
— Written by James Stanley, Senior Strategist for DailyFX.com
Contact and follow James on Twitter: @JStanleyFX
Be the first to comment