

DavidLeshem/iStock via Getty Images
In the aftermath of the 2020 stock market crash Flow Traders (OTCPK:FLTDF) was lauded for its ability to earn windfall profits in times of turmoil. Over the course of 2021 investors ploughed money into this company hoping for a repetition of 2020 events. As extreme volatility spikes do not happen often investors gradually pulled out of this stock. With the company diversifying into different asset classes to support earnings and dividend growth, Flow Traders presents a buying opportunity.
Growth materializing
When the company presented 4Q21 results in February this year, the stock dropped significantly as the company lowered the pay-out ratio to 51%:
The payout ratio reflects a greater need to retain capital given expected increased trading opportunities ahead in strategic growth activities.
Following the earnings call the company released its annual report in March ’22 and struck an upbeat tone about the progress of the growth initiatives:
We maintained our position as a leading liquidity provider in ETPs on- and off-exchange and hold the number one position in EMEA in equity, fixed income, cryptocurrency and commodity ETFs. (…) Building upon our successful fixed income ETP trading footprint, in 2021, we strategically expanded into single-bond market making.
Flow Traders remains a strong player in its traditional area of ETPs, but successfully grew in EMEA, mainly due to good performance in its European home market. The expansion into new markets becomes very clear when the VIX is referenced against the On & Off Exchange Value Traded (EVT), see figure 1.
Figure 1 – Value traded versus VIX (yahoo finance, flowtraders.com; chart by author)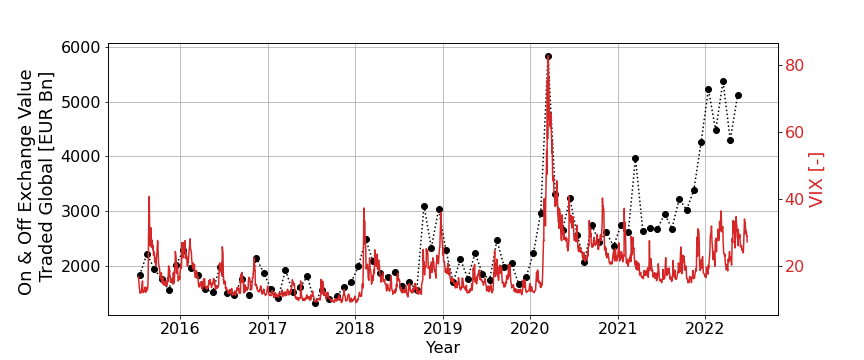
The focus on growth has resulted in a disconnect between value traded and volatility of stock markets. Up to 2021 the EVT clearly followed the VIX. After 2021, focusing on fixed income and crypto amongst others, EVT was diversified. With the Exchange Value Traded nearly doubling, logic leads to the conclusion income doubled as well. Unfortunately this line of reasoning is not valid. Figure 2 shows net trading income (NTI) still follows the VIX rather than the expanded Value Traded.
Figure 2 – EVT, VIX and net trading income (yahoo finance, flow traders.com; chart by author)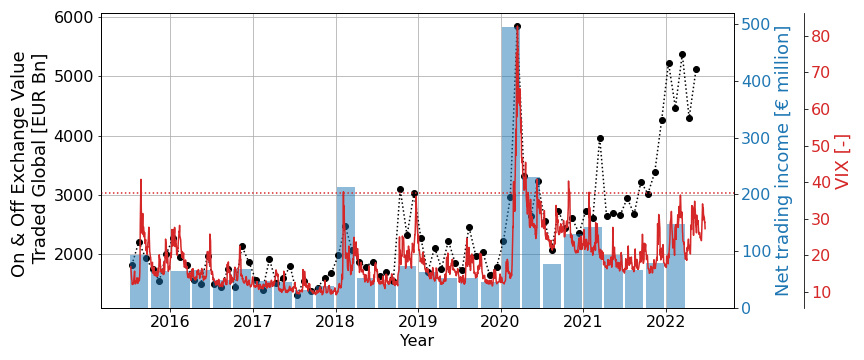
The question is why FLTDF is not yet able to significantly increase the NTI while volume clearly rose. From the annual report:
Increasing our NTI involves increasing the product of volume and the net margin we capture per trade, where volume is the value of products we trade and the net margin is the margin we capture per trade after the corresponding exposure has been hedged.
As volume rose, it’s likely the company is working with small net margins, which could be explained by the fact it intends to grow in these new markets. Another reason could be the company needs to study the markets and learn how to respond. In a new market this takes time, especially as ‘responding’ does not just involve a trader hitting a button. Instead, with in-house developed software, algorithms need to be tweaked and fine-tuned to transfer knowledge into the automation of trading.
Flow Traders on the MOVE
The fixed income market is known to be larger than the stock market. In this respect the step into fixed income by Flow is logical. As this company makes money when markets are volatile, it would be worthwhile to have a proxy for the VIX which is applicable to the bond market. Thanks to the folks at Merrill Lynch, such an index exists. The Merrill Lynch Option Volatility Estimate (MOVE) does exactly this:
The MOVE Index is a well-recognized measure of U.S. interest rate volatility that tracks the movement in U.S. Treasury yield volatility implied by current prices of one-month over-the-counter options on 2-year, 5-year, 10-year and 30-year Treasuries.
Plotting the MOVE against Flow’s EVT, an interesting picture emerges, see figure 3. Whereas volatility was rather level over the course of last year, the MOVE climbed steadily since 4Q21 for well-known reasons.
Figure 3 – MOVE index versus Exchange Value Traded (yahoo finance, flowtraders.coml chart by author)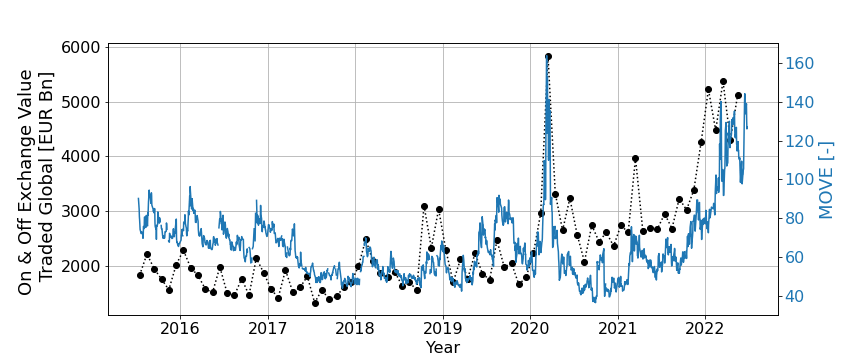
With Flow expanding into (currently) volatile markets such as fixed income and cryptocurrencies, the volume traded has taken flight. As the employees will further understand these markets and adjust applicable algorithms, I expect trading income to follow. This is important as NTI and earnings per share are closely related, which in turn means NTI and dividend payments are closely related as well.
Price dropping, fundamentals improving
A recurring theme in 2021 was investors moving the stock higher in anticipation of the trading update only to see hopes vanish as the price would drop significantly after the update. It seems this theme is something of the past as the first trading update in 2022 did not display this behavior, see figure 4.
Figure 4 – Stock price behaviour during trading updates (yahoo finance, flowwtraders.com; chart by author)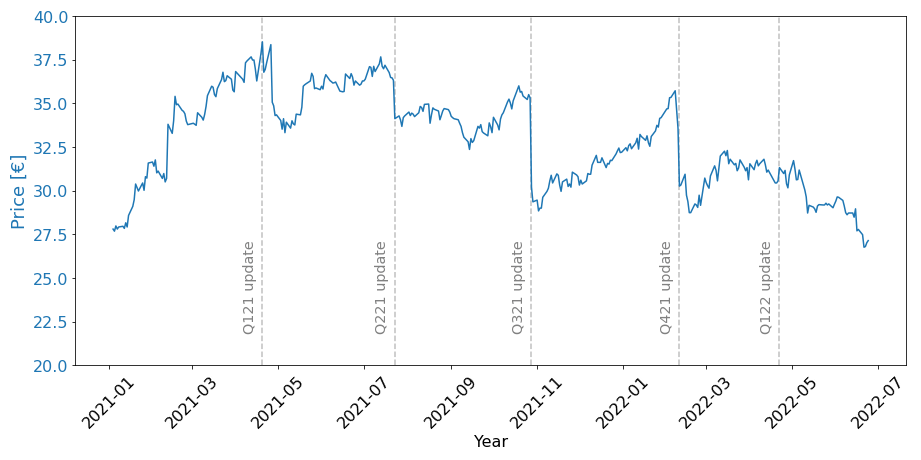
It appears investors hoping to make a quick buck on a resurgence in volatility finally threw in the towel. Students of the markets, or Nassim Taleb for that matter, could have seen this coming. In the same article it was noted the stock price historically traded in line with volatility, but after the 2020 events saw a disconnect. That is, volatility dropped but the stock price actually kept appreciating. As volatility has been on the rise over the last months, and the stock on a decline, it becomes worthwhile to reassess the situation.
Contrarian investing
In 2022 volatility has been rising. This holds for stock markets, but definitely for fixed income markets (figure 3), not to mention cryptocurrencies. Whereas 2021 showed the stock climbing against a descending VIX, 2022 shows the exact opposite behavior. The first half of this year the stock showed a downward trend while volatility across different asset classes was on the rise. In figure 5 these trends are visualized.
Figure 5 – Stock price versus VIX and EPS (yahoo finance, flowtraders.com; chart by author)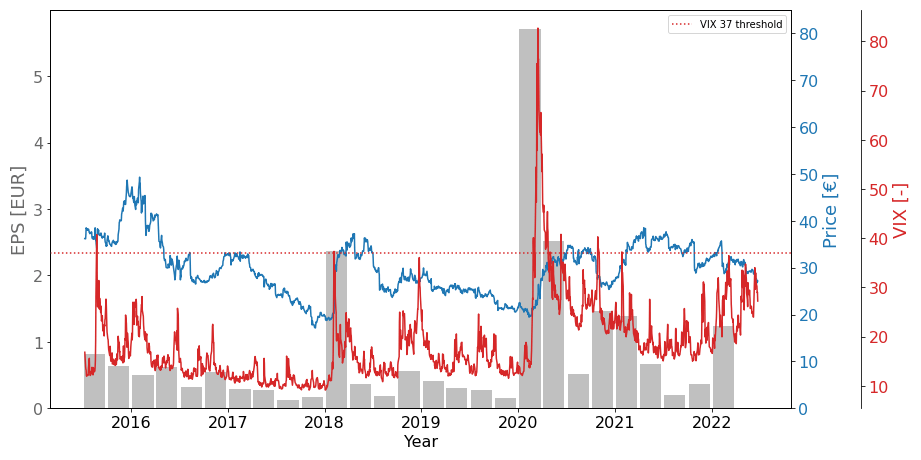
The same figure also shows a threshold line at a VIX level of 37. In this article it was demonstrated ‘chances of high returns materially increase when the VIX spikes above a level of 37’. On top of this we have seen policymakers effectively driving volatility which is demonstrated by a rising VIX and MOVE. This, combined with the Russian invasion of Ukraine, has been driving earnings for Flow in the first half of ’22.
With the Fed posting its biggest interest rate hike in decades, the ECB poised to raise rates while having to account for widening spreads of different Eurozone members and a NATO increasing its military presence on the Eastern flank, sufficient ingredients for market turmoil are present. Against this backdrop Flow Traders has been expanding its footprint across more asset classes, ready to benefit. Yet all this did not translate into a materially higher valuation.
Valuation
For the second quarter the high volatility in both stock and bond markets, combined with the high Exchange Value Traded, will support net trading income. After posting low earnings per share in 2H21, the €1.24 earnings per share in 1Q22 shows that the company is on track to perform better this year. Although a spike to the ‘VIX 37 threshold’ is missing in the current quarter, I expect earnings per share will not be significantly less than first quarter results.
For ease of reference I estimate 1H22 EPS will be approximately €2. Further assuming the company will continue to focus on growth, the dividend payout ratio will remain subdued at a level of 50%. These assumptions will lead to an estimated dividend of €1 per share for the first half of 2022.
In 2021 the company paid a dividend of €1.35 (US$1.42) per share. As it currently stands, the company will be able to match at least this amount in 2022. With FLTDF trading at US$28.50, the forward dividend yield is approximately 5%.
A company that is clearly growing, while delivering a yield of this magnitude, already makes a good investment. This does not yet account for the fact Flow Traders will benefit from a potential recession which will support volatility.
Conclusion
Flow Traders’ stock made a bumpy ride over the last year as the quarterly results did not satisfy investors. The company lowered shareholder returns to finance growth, but still manages to generate a 5% dividend yield.
Growth materialized fast as the Exchange Traded Value doubled over the course of a single year. Yet, net trading income and earnings per share are lagging as the company still needs to mature in the growth areas such as fixed income and cryptocurrencies.
As earnings have not yet caught up with increased Exchange Value Traded, the silent period leading up to the 1H22 earnings presentation provides an opportunity to buy this stock at or below the current level of US$28.50.
Be the first to comment