

USD/JPY ANALYSIS
- Long-term Japanese Government Bonds yields under pressure
- Fed and BOJ interest rate decisions
- USD/JPY approaching 9-month highs
- IG Client Sentiment (IGCS) bullish
JAPANESE YEN FUNDAMENTAL BACKDROP
The yield spread between longer dated Japanese Government Bonds (JGB) and short-term bonds have reduced (see chart below) today in anticipation of the Fed revising interest rate hikes. This comes after strong U.S. economic growth forecasts along with the BOJ suppressing hopes around 10- year yields trading within a wider band.
The U.S. Dollar has edged higher dovetailing behind the amended rate forecasts which has sustained the exponential rise on the USD/JPY currency pair.
JGB YIELDS ACROSS 2,5,10 AND 30-YEAR BONDS
Chart prepared by Warren Venketas, Refinitiv
USD/JPY ECONOMIC CALENDAR
High impact events this week should result in significant volatility pre and post-announcements. Both central banks will be followed closely as forecasts and changes in outlook could lead to big shifts in market conditions. Although interest rates may remain flat for both central banks, forward guidance will at the forefront for market participants.
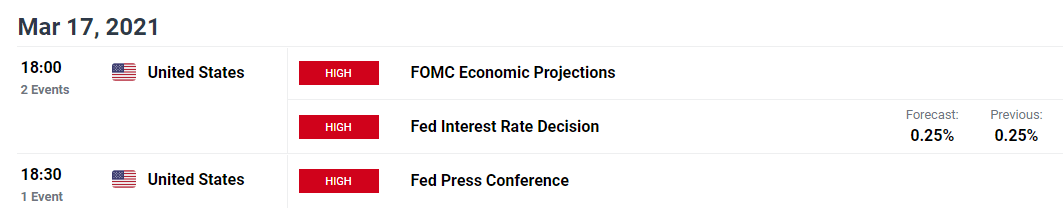
Source: DailyFX Economic Calendar

Recommended by Warren Venketas
Trading Forex News: The Strategy
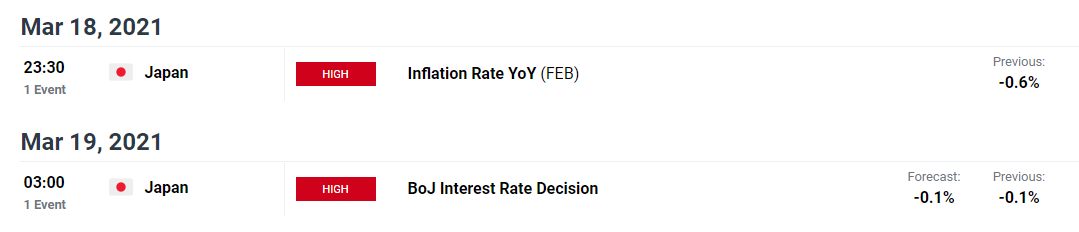
USD/JPY TECHNICAL ANALYSIS

Recommended by Warren Venketas
Get Your Free JPY Forecast
Chart prepared by Warren Venketas, IG
Year-to-date the greenback has appreciated 5.78% against Yen which is enduring as USD/JPY holds above the 109.00 psychological level. Fresh 9-month highs are in sight as June 2020 highs serve as upcoming resistance at 109.85 as fundamental prompts are in focus with central bank announcements around the corner .
The Relative Strength Index (RSI) suggests possible bearish divergence (blue) – when price moves in the opposite direction to the RSI momentum indicator. This phenomena is indicative of slowing upside momentum which could come to an end. This being said, it is difficult timing divergence so caution should be exercised around this input.
Should bearish divergence unfold, key levels to the downside will come from July 2020 swing high at 108.17 followed by the 107.50 support zone.
Key technical points to consider:
- 109.85 resistance target
- 108.17 support target
- RSI bearish divergence
Starts in:
Live now:
Mar 30
( 17:03 GMT )

Keep up to date with price action setups!
Trading Price Action
IG CLIENT SENTIMENT FAVORS BULLS
| Change in | Longs | Shorts | OI |
| Daily | -13% | 8% | -1% |
| Weekly | 6% | 8% | 7% |
IGCS shows retail traders are currently net long on USD/JPY, with 39% of traders currently holding long positions (as of this writing). Traders are further net-short than yesterday and last week, and the combination of current sentiment and recent changes gives us a stronger USD/JPY-bullish contrarian trading bias.
— Written by Warren Venketas for DailyFX.com
Contact and follow Warren on Twitter: @WVenketas
Be the first to comment