

cemagraphics
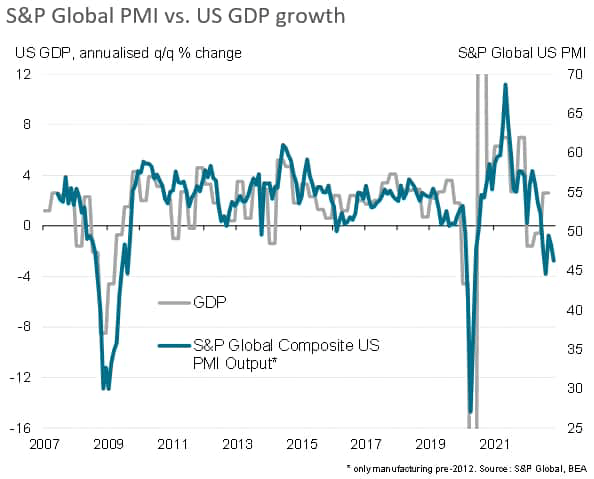
A marked divergence has developed between resilient official economic data and softer business survey statistics in the US. Past performance suggests that the surveys provide important advance signals on the health of the economy, and represent a more accurate picture of the underlying trend in the economy than volatile and backward-looking official data such as GDP.
More importantly, the weaker PMI survey data are more in line with many economists’ expectations of the impact of recent aggressive policy tightening by the Federal Reserve, which the survey data also reveal to have brought down inflationary pressures to a marked degree. An improvement in supplier delivery times, a key gauge of pricing power, has even moved to territory indicative of a shift from the sellers’- to a buyers’-market, hinting that inflationary pressures could moderate further in coming months, potentially quite significantly.
PMI signals fourth quarter GDP decline
Business conditions across the US worsened in November, according to the preliminary PMI survey findings. The headline Flash US PMI Composite Output Index from S&P Global registered 46.3 in November, down from 48.2 at the start of the fourth quarter. The rate of contraction signalled was the sharpest since August and among the quickest since 2009.
With output and demand falling at increased rates in November, the PMI survey data are consistent with the economy contracting at an annualised rate of 1% in the fourth quarter so far.
The weak November flash PMI numbers add to a growing divergence between the survey data and the recent path of GDP recorded in the US, with GDP and the PMI having in fact diverged to an unusual degree so far this year. The PMI showed business growth accelerating up to the spring, but growth has faded since peaking in March, to the extent that November’s decline represents a fifth consecutive month of falling business activity. By contrast, GDP fell at annualised rates of 1.6% and 0.6% in the first and second quarters respectively, before reviving to show 2.6% growth in the third quarter. Estimates for fourth quarter growth also suggest surprising resilience, with the Atlanta Fed nowcast, for example, pointing to GDP growth in excess of 4% for the fourth quarter.
PMI weakness led by financial services
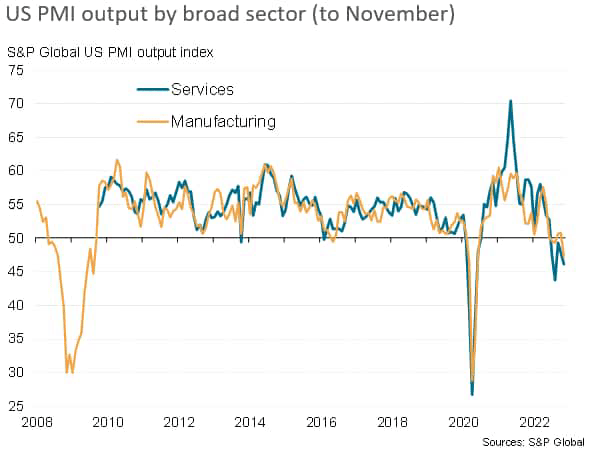
To get a better perspective on the recent weakness of the PMI, we can look into the sub-sector trends. November saw an accelerating rate of decline of service sector activity, accompanied by a renewed fall in manufacturing output, to suggest a broad-based malaise of the business activity.
Digging down a further layer, output trends are clearly more varied. Broad industry-level PMI data (currently only available up to October) reveal that by far the steepest downturn has been suffered by financial service providers in recent months. The next-steepest decline was recorded for consumer services, albeit with the rate of decline easing, followed by basic materials firms and then consumer goods, albeit with the latter reporting only a marginal decline in October.
In contrast, technology first reported the strongest output gain for five months in October, and healthcare returned to growth for the first time in six months. Modest growth was seen for industrials (which includes producers and B2B service providers).
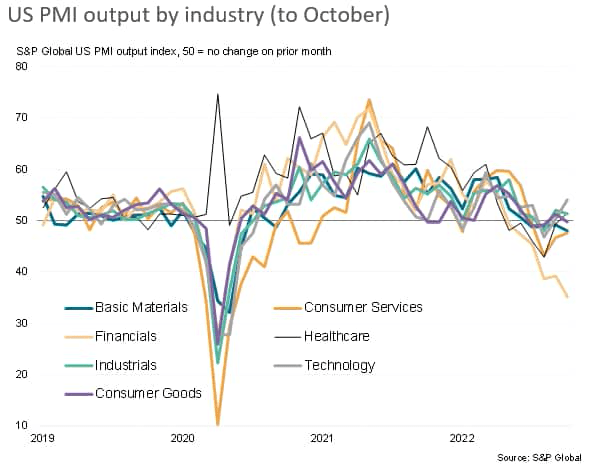
These divergent trends by industry are not surprising, given recent headwinds to the economy. Companies are reporting downward pressure on sales from the rising cost of living and from tightening financial conditions -notably higher borrowing costs. It is therefore understandable that financial services, which includes real estate, and consumer-facing sectors are consequently suffering the steepest downturns at present.
Weakening global demand hits manufacturing
Companies are also reporting weakened demand across both home and export markets, notably in terms of manufactured goods as the cost of living squeeze is exacerbated by reduced inventory building, and in many cases the shift towards inventory reduction. Note that manufacturing production is weakening on a global basis, with rising inventories of unsold stock and un-used inputs being increasingly widely reported amid the downturn in demand.
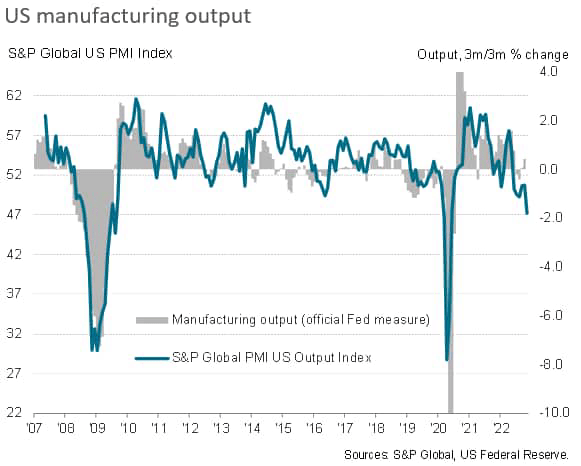
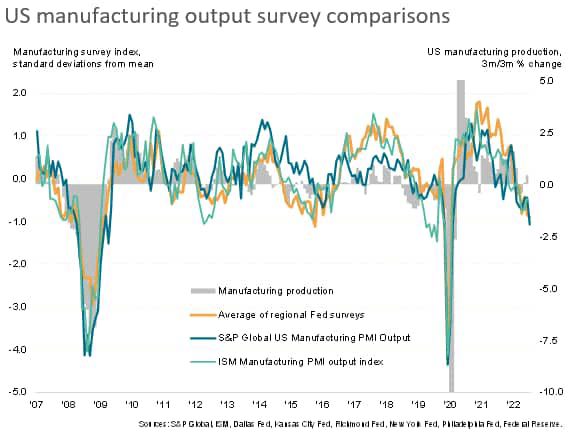
Hence, manufacturing output is turning down sharply now in the US, led by basic resources firms, which are at the leading edge of the downturn in demand for inputs by producers around the world. Barring the initial COVID-19 shutdowns of 2020, the latest manufacturing PMI readings are the weakest since the global financial crisis.
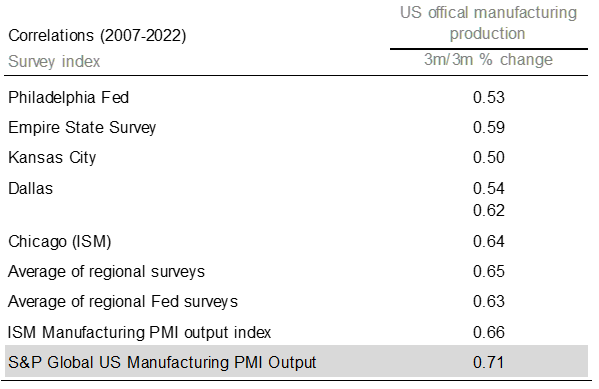
The S&P Global PMI readings bode ill for the official manufacturing data, which have recently shown resilience but now look prone to a fall. The S&P Global US PMI index has historically exhibited a higher correlation than other business surveys (since 2007, when S&P Global PMI data were first available). However, the signals from the other surveys corroborate the recent weakness depicted by the S&P Global US PMI, with a common theme of strong growth earlier in the year giving way to a rate of decline of approximately 2% on a quarterly basis. In short, the various survey data are consistent in warning of an imminent downturn in the official manufacturing production data.
Service sector hit by rising cost of living
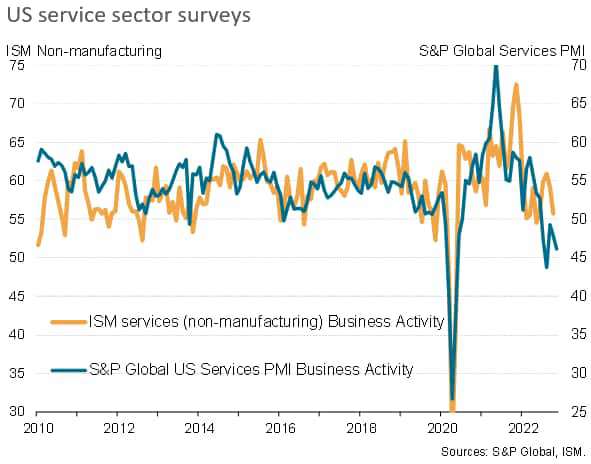
In the service sector, private sector business activity has also been slumping in recent months at a rate not seen for over a decade, excluding the initial pandemic months, which – while in contrast to official data – is not representing a major divergence from ISM non-manufacturing data. Although the latter remains somewhat stronger than the S&P Global US services PMI, the ISM data coverage extends beyond private sector services to include government and energy sectors, which are often counter cyclical, with the energy sector in particular having benefitted considerably during the crisis caused by the Ukraine war. Hence, especially given the latter’s greater exposure to interest-rate sensitive sectors such as consumer services and real estate, the relative outperformance of the ISM relative to the S&P Global US services PMI is no great surprise.
Fed policy curbing growth and inflation
The impact of higher borrowing costs and tightening financial conditions from FOMC rate hikes is illustrated clearly when the PMI data are charted against historical FOMC policy decisions. Recent months have seen the most aggressive Fed tightening in modern history, and any lack of impact on the economy would run counter to expectations.
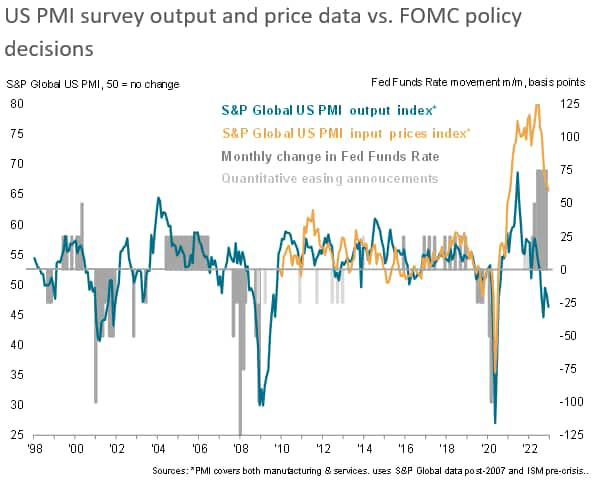
However, although induing a downturn in business activity, more encouragingly Fed rate hikes also appear to be driving down inflationary pressures, as signaled by a further marked cooling in the rate of increase of firms’ costs in November.
The all-sector PMI input cost index sank to its lowest since December 2020, and had fallen continually since peak in May 2022. This PMI index acts as a reliable forward-indicator of consumer price inflation, and points to inflation falling markedly further from the latest rate of 7.7%.
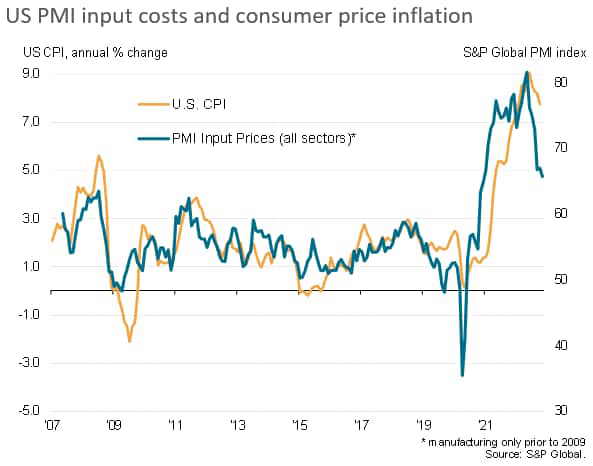
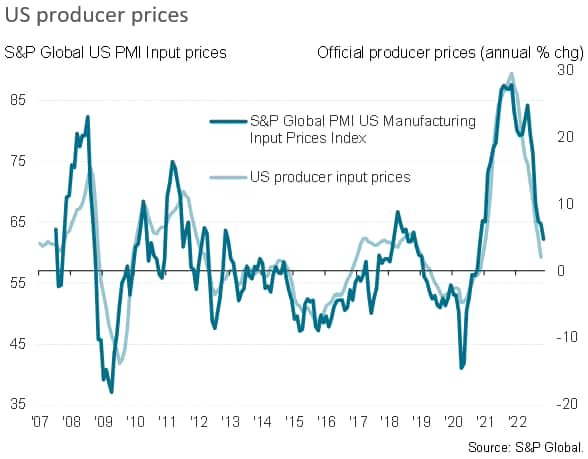
The cooling of inflationary pressures in the PMI is being led by an especially marked slowing of input cost inflation in manufacturing, which is also clearly being likewise signalled in the official producer price data. However, service sector input cost inflation also cooled slightly in November.
Improving supply chains
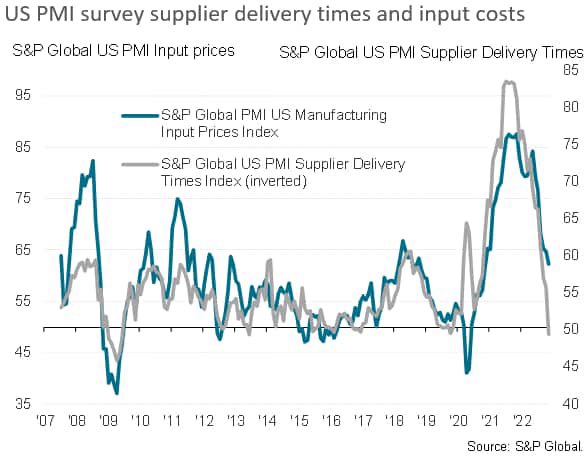
Brighter news on inflation was also provided by the survey data on supply chains. Supplier performance improved in November, as measured by average supplier delivery times, for the first time in over three years, marking a major change in supply conditions relative to that seen throughout much of the pandemic.
While the reduced supply chain stress is partly a symptom of lower demand, the alleviation of supply delays removes a key driver of inflationary pressures and has helped moderate the overall rate of input cost inflation to a near two-year low. November even saw increasing numbers of suppliers, factories and service providers offering discounts to help boost flagging sales.
In this environment, inflationary pressures should continue to cool in the months ahead, potentially markedly.
Editor’s Note: The summary bullets for this article were chosen by Seeking Alpha editors.
Be the first to comment