

primeimages
Everything Old is New Again
It has been said that everything old is new again. We find it hard not to have mixed feelings about this old trope when reflecting on 2022.
Year-End 2022
The year represented a giant step toward normalcy for many of us after a long period of routine lost to the pandemic; going to the office, a restaurant or a sporting event without restrictions still has a whiff of novelty to it. At the same time, there were a number of recurrences we could have done without, including double-digit inflation rates, stagflation, potential energy shortages, Russia as the chief antagonist of the West and loose talk of nuclear engagement.
Noting the similarities between the current environment and times past, we recently reviewed the Global Value team’s published materials from the past couple of decades. For us, this look back in history served not only as a reminder of the circular rhythm of the markets but also of the consistency of the investment approach introduced by the now-retired Jean-Marie Eveillard. As the current stewards of his philosophy, we carry on his tradition of constancy in the face of shifting dynamics and of focus on avoiding the permanent impairment of capital independent of the markets’ whims.1
Doing the Math
We believe the market and macroeconomic dynamics we witnessed in 2022—while painful—reflected a relatively orderly transition from an environment characterized by a generational-low cost of capital to one in which money again has a price. For many years, repressed interest rates helped support valuations for securities with expected cash flows far into the future and contributed to a prolonged period of outperformance of growth stocks. This came at the expense of value stocks, which tend to focus on free cash flow in the here and now. The rise in interest rates during the course of 2022 as central banks worldwide sought to tame inflation—yield on the 10-year US Treasury, for example, increased by more than 230 basis points during the year2—explains much of the drop in securities dependent on future cash flows. The math of higher discount rates exerted itself.
While equities were weak across the board in 2022, lower-valuation stocks turned the tables on growth names; the MSCI World Value Index outperformed its growth analog by more than 2,250 basis points lastyear.3 Geographically, non-US stocks held the edge last year, an infrequent occurrence during the the post global financial crisis period. Despite 2022’s relative outperformance, the price ratio of non-US stocks to US names remains at lows not seen in many decades, as shown in Exhibit 1. We think one ought to be open minded in such an environment, especially given the number of quality businesses that exist outside the US.
Exhibit 1. Non-US Stocks Trading at Multi-Decade Lows Relative to US Stocks (Price Ratio of MSCI EAFE Index to S&P 500 Index, January 1970 through November 2022)
Source: Bloomberg; data as of December 31, 2022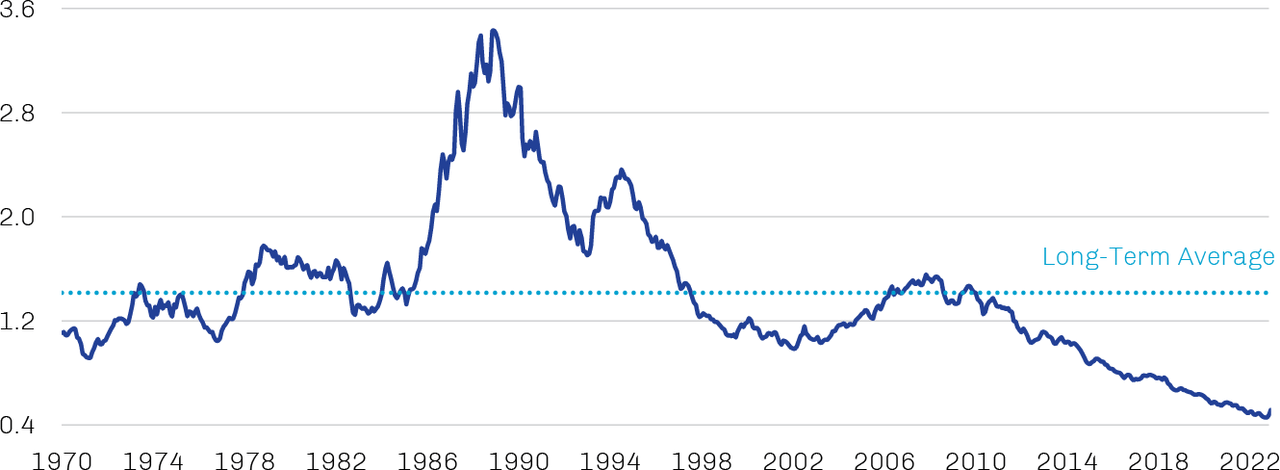
Unfortunately, the long period of low—and sometimes negative—nominal rates served as fuel for a range of more speculative investments, many of which suffered profoundly during 2022 as rates reversed course. For example, the ARK Innovation ETF (ARKK)—a multi-cap vehicle whose theme is “disruptive innovation” and that could be considered a proxy for the tech high-flyers that bloomed in the aftermath of Covid-19—was down 67% in 2022 and nearly 80% since its peak in early 2021.4 The value of special purpose acquisition company (SPAC) initial public offerings in the US fell 90% year-over-year in the first three quarters of 2022, and the value of “de-SPAC” transactions (in which the previously IPOed SPAC merges with its targeted private business) declined 89%.5 Cryptocurrencies lost about $1.4 trillion in market capitalization,6 and a number of headline-grabbing missteps—including the high-profile bankruptcy of crypto exchange FTX and the de-pegging of stablecoin TerraUSD (UST-USD)—inspired calls across jurisdictions for greater regulation of the industry.7
Meaningfully positive real interest rates also fueled a selloff across the fixed income complex, with duration-sensitive issues particularly challenged. The Bloomberg US Long Treasury Index was down about 29% in 2022, while the index of long global sovereign debt posted a similar loss. Corporate bonds fared better, but investment grade and high yield debt still delivered double-digit losses.8 With borrowers given pause by higher rates and investors seeking to preserve liquidity in a volatile environment, new corporate issuance fell sharply in 2022 after establishing fresh annual records in 2020 and 2021.9 A very active primary market has been a key support of performance in recent years, particularly for high yield bonds; continued weakness here could become a more systemic concern should issuers find their access to the capital markets limited when it comes time to refinance maturing paper. That said, borrowers were aggressive in issuing low-rate debt in the preceding years, and the manageable near-term maturity wall suggests a decent amount of breathing room for most.
On the flip side of this bond rout is that many fixed income securities now offer investors reasonable yields, freeing them from the idea that there is no alternative to equities. However, credit spreads on both investment grade and high yield corporate bonds in the US counterintuitively rebounded to levels above their long-term averages on a yield-to-worst basis, before pulling back somewhat toward year-end.10
We see the potential for additional downside in credit from here, especially if the Fed’s inflation-fighting fervor tips the economy into recession. Inflation alone weighs on margins and pressure credit metrics, inflation plus slow or no economic growth would amplify these effects. Conditions could get truly messy if markets were to lose faith in the Fed’s ability to control inflation and the “bond vigilantes” stepped in to drive up rates. We saw a preview of this in the UK during the fall; the Truss administration issued a highly stimulative—and since-scuttled—budget proposal at odds with the Bank of England’s inflation-fighting efforts, quickly sending the pound to a record low against the dollar and 10-year gilt yields to levels not seen since 2010.11
Many of our portfolios hold gold as a potential hedge against adverse market outcomes. The price of gold behaved pretty much as we would expect in 2022. It rallied early in the year in anticipation of and the weeks after Russia’s invasion of Ukraine as investors sought traditional “safe havens.” With markets digesting tighter monetary policy, however, gold moved lower as real interest rates—the key determinant of movements in the price of gold—moved higher. A rebound ensued toward year-end on signs the Federal Reserve was prepared to slow its pace of rate hikes, and ultimately spot gold lost only 28 basis points in 2022 despite significant intra-period swings.12
Wages May Be Key to Solving Inflation Riddle
While risk assets may have become more compelling from a mathematical perspective, we’d caution against expecting a quick renewal of the bullish euphoria that captivated markets after the initial pandemic selloff. That episode was extraordinary in nature from start to finish: a once-in-a-century public-health crisis whose macro and market impacts were countered by highly experimental monetary and fiscal policies. To us, it feels as if we’re still a few years away from what could be characterized as a normal macroeconomic environment; getting there likely will entail absorbing some unpleasant headwinds.
In seeking to structure our portfolios to be resilient in different states of the world, both supportive and destructive, we need to be realistic about the obstacles to the return of normal macroeconomic and market conditions. Among these today is the potential that elevated inflation and the policy actions designed to combat it may be threatening financial stability.
As Covid-19 evolved into a pandemic that would soon bring global economic activity close to a standstill, the Fed and US fiscal authorities in early 2020 introduced an extraordinary set of policy measures. While the Fed slashed the federal funds rate to zero and installed numerous backstops to enable continued smooth functioning of markets, Congress unleashed $5 trillion of fiscal support—equal to 24.3% of GDP13—primarily in the form of two key pieces of legislation. In March 2020 came the $2.1 trillion Coronavirus Aid, Relief and Economic Security (CARES) Act, which for the most part served its intended purpose.14 By the end of 2020, conditions had begun to improve—the pandemic recession was the shortest on record15—and the slow rollout of vaccines worldwide promised to kickstart the global economic engine. Despite the evident success of the first bill, Congress went back to the well about a year later, passing the $1.9 trillion American Rescue Plan (ARP).16
Notably, between the passage of these two bills the Fed announced a shift to a new inflation average-targeting policy framework. Rather than a static 2% inflation target, the Fed would now pursue inflation that averages 2% over an unspecified period of time, a flexibility that implies the central bank would seek to generate inflation somewhat above 2% to offset sub-2% periods. This represented a significant change to Fed orthodoxy; to maintain the credibility of its expectations anchor, the Fed since the 1980s has rarely tolerated inflation above its 2% target and has acted to cool the economy if rates even approached that level. The Fed’s new approach introduced a novel element of uncertainty to forecasting, an uncertainty that seemed to extend to the Fed itself; the inflation pressures still present today were referred to by the central bank as “transitory” for the better part of 2021.17
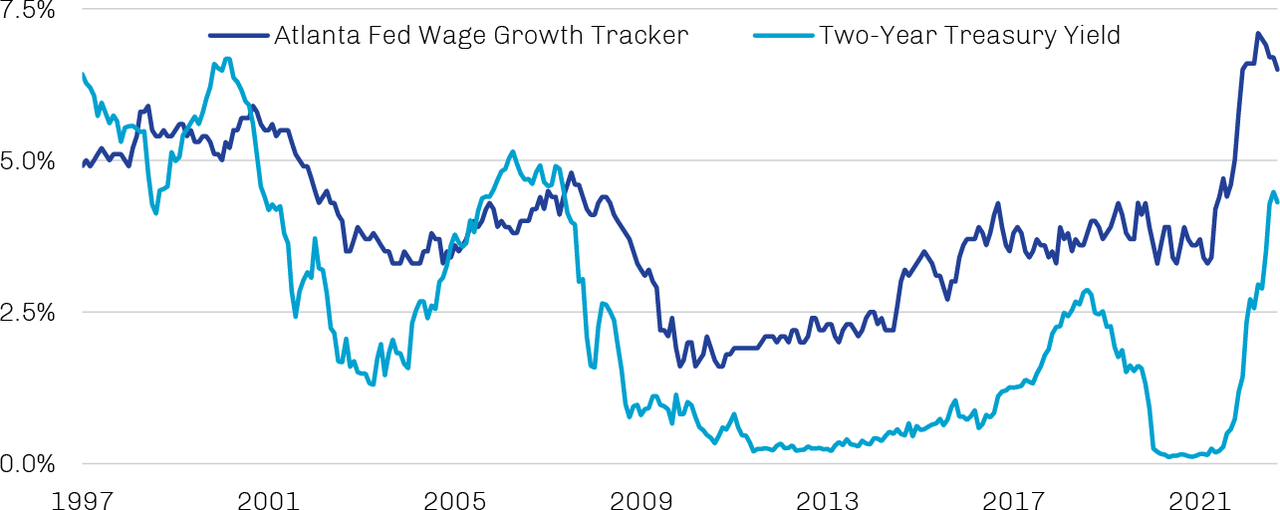
Highly stimulative fiscal and monetary policies and a flexible Fed were met by the unprecedented demand for goods and the crippled supply chains that stemmed from the pandemic, which—supercharged by the commodity-price impact of Russia’s invasion of Ukraine in February—gives us the inflation dynamic we are embroiled in today. While inflation seemingly has peaked—durable and nondurable goods prices have rolled over in recent months, and housing costs also have begun to ease—persistent wage pressures are likely to complicate the journey back to 2%.18 As shown in Exhibit 2, post-Covid labor-availability issues have pushed wage inflation to the mid-6% level from its mid-3% average over the past few decades. Higher wages—which are difficult to undo absent job losses and/or recession—have driven nominal income growth and aggregate demand higher at a time when there is not a lot of spare supply in the economy, presenting broad inflationary pressures. Two-year Treasury rates at or above the level of wage inflation historically have been needed to pull it lower; the most recent data show a gap of about 200 basis points between the two.
Exhibit 2. Still-Higher Interest Rates May Be Needed to Contain Wage Inflation (January 1997 through November 2022)
|
Note: The Atlanta Fed’s Wage Growth Tracker is a three-month moving average of median wage growth based on hourly data. It is a weighted series structured to be representative of each month’s population of wage and salary earners in terms of sex, broad age range, education, industry and occupation groups.Source: Bloomberg, Haver/Federal Reserve Bank of Atlanta, First Eagle Investments; data as of November 30, 2022. 1,2. Source: FactSet; data as of November 30, 2022.3. Source: Bloomberg; data as of December 13, 2022.4. Source: Bloomberg, Haver/Federal Reserve Bank of Atlanta, First Eagle Investments; data as of November 30, 2022. |
Did the Fed Miss Its Chance?
The soft landing/hard landing debate really boils down to wage inflation versus unemployment. Can the Fed bring down the former without causing a spike in the latter? History suggests this is unlikely. At the same time, precedent may not be a reliable guide considering the highly unusual circumstances that led us down this path.
Hindsight is 20/20, but we think the Fed may have missed its best opportunity to engineer a soft landing for the economy in early 2021. Had it tapped the brakes on monetary support back then—either through higher rates or quantitative tightening—it likely could have curbed payroll growth and capped wage inflation around 4%. By missing that window, however, the Fed instead has been forced to pull the handbrake. This is perhaps most evident in the money supply, as shown below; after expanding by more than one-third after the Covid-19 outbreak, M2 money supply has been in decline since March. The Fed’s balance sheet also has been contracting, and quantitative tightening means that the market will need to absorb a greater share of bond issuance going forward.
Exhibit 3. US Money Supply, Unusually, Is in Decline (M2 in Trillions of Dollars, January 2007 through November 2022)
Source: Federal Reserve Board of St. Louis; data as of November 30, 2022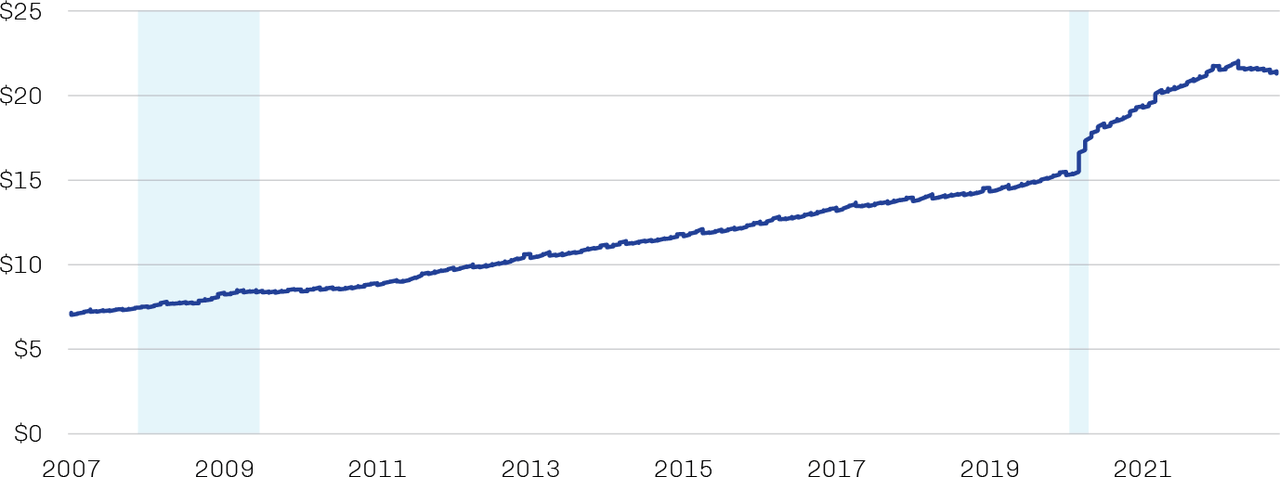
Meanwhile, the seemingly unnecessary ARP package authorized by Congress served primarily to add another nearly $2 trillion to the nation’s already bloated debt load, further complicating the current battle against inflation. The yield on two-year Treasuries tends to reflect the bond market’s expectations for Fed policy. As can be seen in Exhibit 4, each rate peak since the mid-1980s was lower than the one that preceded it, suggesting the policy rate necessary to slow the economy has declined over time. Coincident with this have been climbing debt-to-GDP levels, which typically lead to higher borrowing and debt-servicing costs across an economy, weighing on productivity and output and potentially undermining sovereign creditworthiness. The two-year rate broke through its trend line in 2022, which combined with higher debt levels points to a significantly greater financial burden.
Exhibit 4. Growing Debt Load Has Weighed on Financial Conditions (January 1985 through November 20222)
Source: Federal Reserve Board of St. Louis; data as of December 31, 2022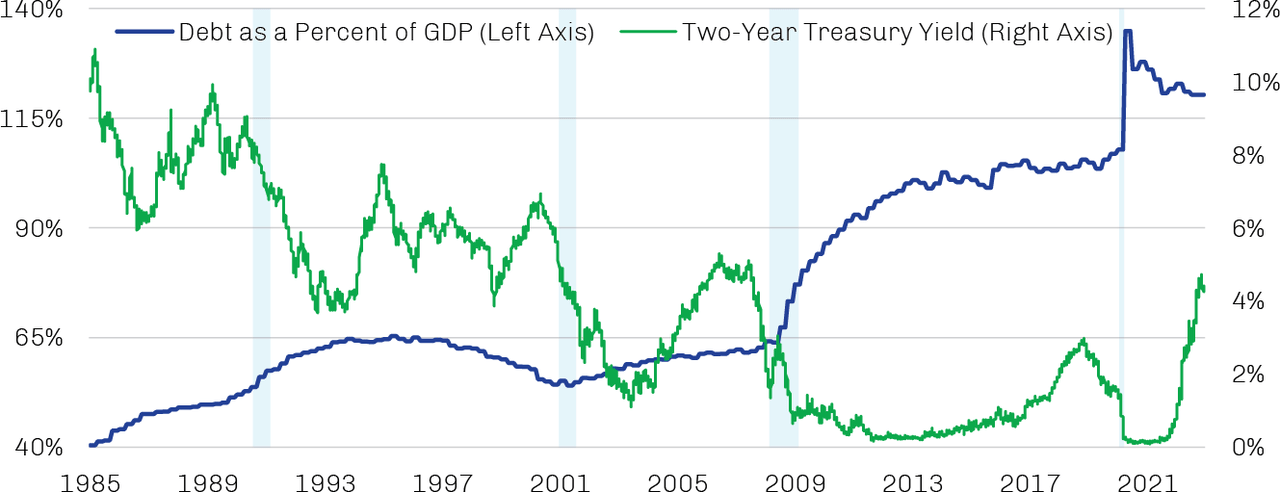
One potential downside scenario is that after underestimating the risk of inflation coming out of the Covid-19 dislocations, the Fed is now underestimating the risk of a financial accident emerging somewhere in the system that could trigger a deep recession and broad selloff in risk assets. We saw a number of burgeoning threats materialize last year, though all ultimately failed to inflict widespread damage. One example is the aforementioned botched budget plan in the UK, which presented a particular challenge to the many pension funds in the country that employ liability-driven investment (LDI) strategies to lever their portfolios. With gilt prices plummeting, a number of funds were forced to sell these assets to meet margin calls on their LDI-related hedges, putting further downward pressure on gilts until the Bank of England was forced to intervene.19 All-time highs in the cost of credit-default swaps on Swiss banking giant Credit Suisse and the collapse of crypto exchange FTX also come to mind as potential sparks for a global conflagration. While the impact of these events was contained, their emergence may be suggestive of a broader set of troubling tectonics shifting underneath the surface.
Synchronized Tightening Contributing to Synchronized Slowdown
The Fed isn’t the only central bank squeezing out liquidity, of course, and the US isn’t the only country facing slowing growth and potential recession (as shown in Exhibit 5). Emerging market central banks were leaders in this hiking cycle; a number of them, especially in Latin America, began hiking in mid-2021 and are likely closer to the end of their tightening efforts than the beginning.20
Developed markets in general were later to the party. Headline inflation in the euro zone fell to 10.1% year-over-year in November, down from October’s record high of 10.6%, as mild weather took some of the sting out of energy prices.21 Inflation remains punishingly high, however, and the European Central Bank is contending with both the appropriate pace of rate hikes and the need to begin quantitative tightening at some point soon. Economists forecast full-year 2022 growth of 3.2% for the region, though the consensus expects a small contraction in output during 2023.22 The UK appears to be in far worse shape. Inflation stood at 10.7% year-over-year in its most recent reading, and the Bank of England recently enacted its largest rate hike in 33 years.23 With productivity in decline and business investment persistently weak, the BOE believes the country in the third quarter entered into a recession that will last until mid-2024 and result in 2.9% of cumulative economic contraction.24
Exhibit 5. Global Growth Appears to Be Stalling (Global Manufacturing and Services PMIs, January 1998 through November 2022)
Source: Morgan Markets, Bloomberg, First Eagle Investments; data as of November 30, 2022.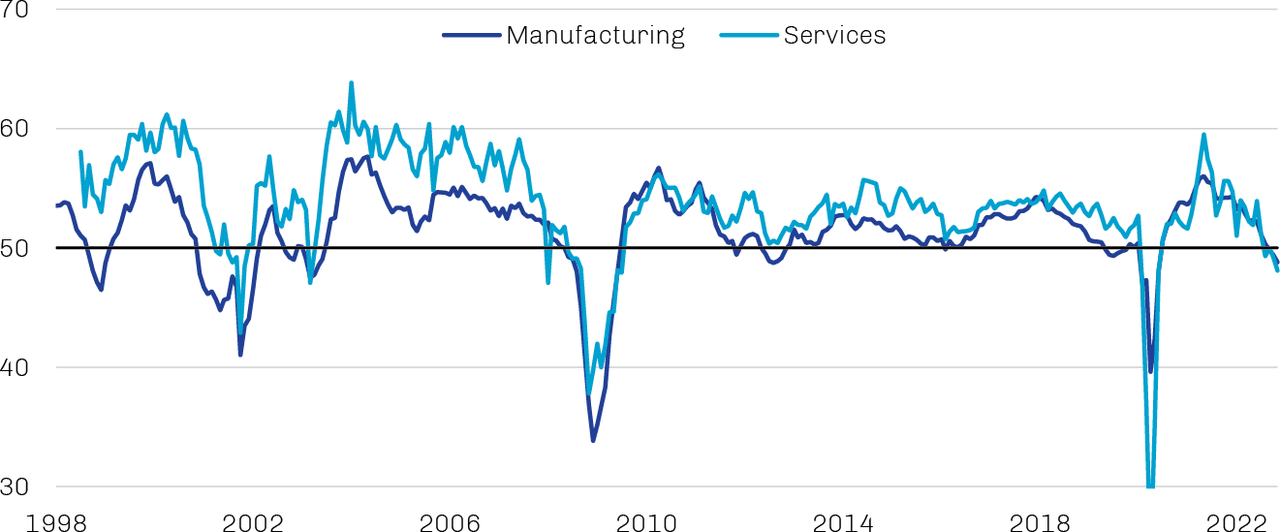
| Note: Above 50 = expansion; below 50 = contraction. |
In contrast with most of its developed market brethren, the Bank of Japan has maintained its ultralow policy rates. While the country’s 3.8% inflation seems relatively minor in the grand scheme of things, it still comes as a bit of a shock to consumers and businesses accustomed to decades of limited price pressures. The yen perhaps has been the biggest casualty of easy BOJ policy, falling to 1990 levels relative to the dollar. Sharply higher import prices and weak consumption are among the reasons Japan’s GDP unexpectedly contracted at an 0.8% annualized rate in the third quarter after a 4.5% expansion in the second.25
Like Japan, China also has managed to sidestep significant inflation pressures, though its economy remains on shaky ground. The country’s growth has been challenged by its zero-Covid policy, drought conditions, soft global demand and, most of all, an imploding property market. Beijing recently eliminated some of its more stringent pandemic-related restrictions, seemingly in response to the sluggish economy and mounting public discontent; with vaccination rates low among the elderly and little natural immunity among the populace in general, however, there is concern that public-health conditions in China could get worse before they get better.
Seeking Resilience Through Balance and Diversification
We’re pleased with the relatively orderly demeanor of markets in 2022, as the resumption of more rational behaviors appears to support our style of value investing. That said, we are somewhat unsettled by the markets’ apparent disconnect with the abovementioned risks, especially as the Fed’s tightening efforts continue to transmit to all nodes of the economy with a lag. Market-based indicators such as the five-year forward inflation expectation rate suggest inflation expectations remain well-anchored, and bond yields eased later in the year on signs the Fed was prepared to scale back its pace of rate hikes. At the corporate level, earnings growth expectations for 2022 and 2023 have pulled back somewhat for both the MSCI World and S&P 500 indexes but remain solidly positive despite all the operating headwinds.26
In response to top-down questions, the Global Value team seeks to build resilience in our portfolios from the bottom up, focusing on incremental decisions we expect may in aggregate have the potential to improve portfolio performance over time. This has meant seeking companies with track records of stability in the face of market volatility and macroeconomic weakness, with pricing power that can be exploited in inflationary environments, with scarce assets and strong capital structures that may serve as a buffer against rising interest rates, and with management teams whose prudence and predictability stands in contrast with the uncertain path of federal policy makers. This also has meant investing in such companies only when we can do so at what we believe to be “margin of safety” to our estimate of intrinsic value.27 We say “no” to investment opportunities far more often than we say “yes.”
We are also mindful of the importance of diversification as a guiding investment principle, and we seek to create carefully curated collections of businesses drawn from a wide range of industries, sectors and geographies. Our benchmark-agnostic perspective supports our disciplined approach to asset allocation—which in some cases employs gold and gold-related securities as a potential hedge against adverse market developments—and enables thoughtful diversification rather than index-tracking, helping to ensure we are providing clients with truly differentiated investment solutions.
Controlling What We Can Through Temperament
We often find ourselves returning to The History of the Peloponnesian War by Greek author Thucydides from the late 5th century BC. Thuycdides’s insights about the Athenians and the Spartans have proved prescient throughout history, today illustrating the rivalry between the US and China just as they did the rivalry between Germany and the UK a century ago. Beyond its historical context, the book is full of valuable insights into the human condition; among the most resonant to us as investors is his analysis of the mistakes people make when confronted with uncertainty. They act with haste. They act with hubris. They act with dogma. And the outcome of these actions typically is suboptimal.
At First Eagle, we try to embody the philosophical inverse of these behaviors. Instead of haste, we exercise patience, maintaining low turnover rates and allowing time for our investment theses to play out. Instead of hubris, we embrace humility, constructing broadly diversified portfolios we expect should perform across various world-states and investing capital only when we can do so with a “margin of safety.” Instead of dogma, we encourage flexibility, letting the character of a business dictate its potential appeal as an investment and making the value opportunity set larger in the process. The distinct temperament of our investment professionals is key to our success in this endeavor, and we remain resolute in our commitment to cultivating a high-performance culture that attracts, develops and retains talented individuals and inspires them to do their life’s best work on behalf of our clients.
Footnotes1. Please see our July 2022 paper, “Then as Now” 2. Source: Federal Reserve; data as of December 31, 2022 3. Source: FactSet; data as of December 31, 2022. 4. Source: Bloomberg; data as of December 31, 2022. 5. Source: White & Case LLP; data as of November 30, 2022. 6. Source: CoinMarketCap; data as of December 8, 2022. 7. Source: CoinDesk; data as of December 31, 2022. 8. Source: FactSet; data as of December 31, 2022. 9. Source: SIFMA; data as of October 31, 2022. 10. Source: FactSet; data as of November 30, 2022. 11. Source: Barron’s; data as of September 26, 2022. 12. Source: Bloomberg; data as of December 31, 2022. 13. Source: Federal Reserve Bank of St. Louis; data as of July 13, 2021. 14, Source: Pandemic Response Accountability Committee; data as of November 30, 2022. 15. Source: National Bureau of Economic Research; data as of November 30, 2022. 16. Source: Pandemic Response Accountability Committee; data as of November 30, 2022. 17. Source: Bloomberg; data as of November 30, 2021. 18. Source: FactSet; data as of November 30, 2022. 19. Source: Financial Times; data as of October 24, 2022.. 20. Source: Bloomberg; data as of October 9, 2022. 21. Source: Eurostat; data as of December 16, 2022. 22. Source: Financial Times; data as of November 23, 2022. 23. Source: Office for National Statistics; data as of December 14, 2022. 24. Source: Reuters; data as of December 5, 2022. 25. Source: Financial Times; data as of December 23, 2022. 26. Source: FactSet; data as of December 15, 2022. 27. First Eagle defines “margin of safety” as the difference between a company’s market price and our estimate of its intrinsic value. “Intrinsic value” is based on our judgment of what a prudent and rational business buyer would pay in cash for all of a company in normal markets. |
|
The opinions expressed are not necessarily those of the firm and are subject to change based on market and other conditions. These materials are provided for informational purposes only. These opinions are not intended to be a forecast of future events, a guarantee of future results, or investment advice. Any statistics contained herein have been obtained from sources believed to be reliable, but the accuracy of this information cannot be guaranteed. The views expressed herein may change at any time subsequent to the date of issue hereof. The information provided is not to be construed as a recommendation or an offer to buy or sell or the solicitation of an offer to buy or sell any security. Past performance does not guarantee future results. Risk Disclosures All investments involve the risk of loss of principal. The value and liquidity of portfolio holdings may fluctuate in response to events specific to the companies or markets, as well as economic, political or social events in the United States or abroad. During periods of market volatility, the value of individual securities and other investments at times may decline significantly and rapidly. The securities of small companies can be more volatile in price than those of larger companies and may be more difficult or expensive to trade. A principal risk of investing in value stocks is that the price of the security may not approach its anticipated value or may decline in value. “Value” investments, as a category, or entire industries or sectors associated with such investments, may lose favor with investors as compared to those that are more “growth” oriented. There are risks associated with investing in securities of foreign countries, such as erratic market conditions, economic and political instability, and fluctuations in currency exchange rates. There are risks associated with investing in foreign investments (including depositary receipts). Foreign investments, which can be denominated in foreign currencies, are susceptible to less politically, economically and socially stable environments; fluctuations in the value of foreign currency and exchange rates; and adverse changes to government regulations. Investment in gold and gold-related investments present certain risks, including political and economic risks affecting the price of gold and other precious metals, like changes in US or foreign tax, currency or mining laws, increased environmental costs, international monetary and political policies, economic conditions within an individual country, trade imbalances, and trade or currency restrictions between countries. The price of gold, in turn, is likely to affect the market prices of securities of companies mining or processing gold and, accordingly, the value of investments in such securities may also be affected. Gold-related investments as a group have notperformed as well as the stock market in general during periods when the US dollar is strong, inflation is low and general economic conditions are stable. In addition, returns on gold-related investments have traditionally been more volatile than investments in broader equity or debt markets. Investment in gold and gold-related investments may be speculative and may be subject to greater price volatility than investments in other assets and types of companies.Strategies whose investments are concentrated in a specific industry or sector may be subject to a higher degree of risk than funds whose investments are diversified and may not be suitable for all investors. Diversification does not guarantee investment returns and does not eliminate the risk of loss.Portfolio holdings are subject to change and should not be considered a recommendation to buy, hold or sell securities. Current and future portfolio holdings are subject to risk. Active management is an investment management approach in which an investor, a professional money manager or a team of professionals tracks the performance of an investment portfolio and makes buy, hold, and sell decisions about the assets in it. Bottom-up investing primarily considers factors affecting individual companies and secondarily focuses on industries and economic trends. Consumer price index (CPI) is a measure of the average change over time in prices paid by consumers for a specific basket of goods and services. The core version of this index excludes more volatile food and energy prices. Diversification is a strategy that involves allocating assets to a variety of investments with the intention to help manage risk. Federal funds rate is the interest rate at which depository institutions (banks and credit unions) lend reserve balances to other depository institutions overnight on an uncollateralized basis. Intrinsic value is based on a judgment of what a prudent and rational business buyer would pay in cash for all of a company in normal markets. Margin of safety is defined by First Eagle as the difference between a company’s market value and our estimate of its intrinsic value. An investment made with a margin of safety is no guarantee against loss. Passive Management is an investment management approach that seeks to mirror the performance of a designated index. Special-purpose acquisition company (SPACs) are publicly listed entities formed solely to acquire one or more privately held companies. Target-date funds are packaged asset-allocation products whose investment allocation shifts over time as their target date nears. Volatility is a statistical measure of the degree to which the return of a portfolio or individual security deviates from its mean over time. Indexes are unmanaged, and one cannot invest directly in an index.Index Definitions MSCI EAFE Index captures large and midcap representation across 21 developed markets countries around the world, excluding the US and Canada. MSCI World Index captures large and midcap representation across 23 developed markets countries around the world. MSCI World Growth Index captures large and midcap securities exhibiting growth style characteristics across 23 developed markets countries. The growth investment style characteristics for index construction are defined using five variables: long-term forward EPS growth rate, short-term forward EPS growth rate, current internal growth rate, long-term historical EPS growth trend and long-term historical sales per share growth trend. MSCI World Value Index captures large and midcap securities exhibiting growth style characteristics across 23 developed markets countries. The growth investment style characteristics for index construction are defined using three variables: book value to price, 12-month forward earnings to price and dividend yield. S&P 500 Index is a widely recognized unmanaged index including a representative sample of 500 leading companies in leading sectors of the US economy. Although the S&P 500 Index focuses on the large-cap segment of the market, with approximately 80% coverage of US equities, it is also considered a proxy for the total market. Bloomberg Global Aggregate ex-USD Bond Index is a measure of investment grade debt from 24 local-currency markets. This multi-currency benchmark includes sovereign, government-related, corporate and securitized fixed-rate bonds from both developed and emerging markets issuers. Bonds issued in USD are excluded. Bloomberg US Aggregate Bond Index is an unmanaged broad-based benchmark that measures the investment grade, US dollar-denominated, fixed-rate taxable bond market, including US Treasuries, government-related and corporate securities, MBS (agency fixed-rate and hybrid ARM passthroughs), ABS and CMBS. Bloomberg US Corporate Bond Index measures the investment grade, fixed-rate, taxable corporate bond market. It includes USD-denominated securities publicly issued by US and non-US industrial, utility and financial issuers. Bloomberg US Corporate High Yield Bond Index measures the USD-denominated, high yield, fixed-rate corporate bond market. Securities are classified as high yield if the middle rating of Moody’s, Fitch and S&P is Ba1/BB+/BB+ or below. Bonds from issuers with an emerging markets country of risk are excluded. Bloomberg US Long Treasury Index measures the performance of USD-denominated, fixed-rate, nominal debt issued by the US Treasury with a maturity greater than 10 years. FEF Distributors, LLC (Member SIPC) distributes certain First Eagle products; it does not provide services to investors. As such, when FEF Distributors, LLC presents a strategy or product to an investor, FEF Distributors, LLC does not determine whether the investment is in the best interests of, or is suitable for, the investor. Investors should exercise their own judgment and/or consult with a financial professional prior to investing in any First Eagle strategy or product. First Eagle Investments is the brand name for First Eagle Investment Management, LLC and its subsidiary investment advisers. © 2023 First Eagle Investment Management, LLC. All rights reserved. |
Editor’s Note: The summary bullets for this article were chosen by Seeking Alpha editors.
Editor’s Note: This article covers one or more microcap stocks. Please be aware of the risks associated with these stocks.
Be the first to comment