

Darren415
This article was first released to Systematic Income subscribers and free trials on Sep. 6.
The income market has been impacted by two big trends this year – a rise in interest rates and a widening in credit spreads. These two trends align very well with floating-rate investment-grade assets which has caused them to outperform this year. One of the very few CEFs that specialize in these assets is the Angel Oak Financial Strategies Income Term Trust (NYSE:NYSE:FINS) which has outperformed nearly all other credit CEFs this year.
The key takeaway is that the fund aligns very well with the two main market trends this year which could easily continue to run past 2022 into next year. In addition, the fund trades at a double-digit discount and its recent distribution cut has both right-sized its distribution and moved its valuation to an attractive level. The cut also hides the fact that the fund’s net income profile has actually strengthened significantly this year and will continue to improve over the medium term in reflection of a sharp jump in short-term rates.
A Look At FINS
FINS allocates primarily to floating-rate bank debt.
The fund has a number of attractive features in the current market environment. First, it has a mostly investment-grade allocation profile.
Angel Oak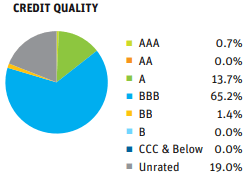
Two, it has a mostly floating-rate allocation profile. About 2/3 of the portfolio is in floating-rate bonds – an extract is shown below.
SEC Filing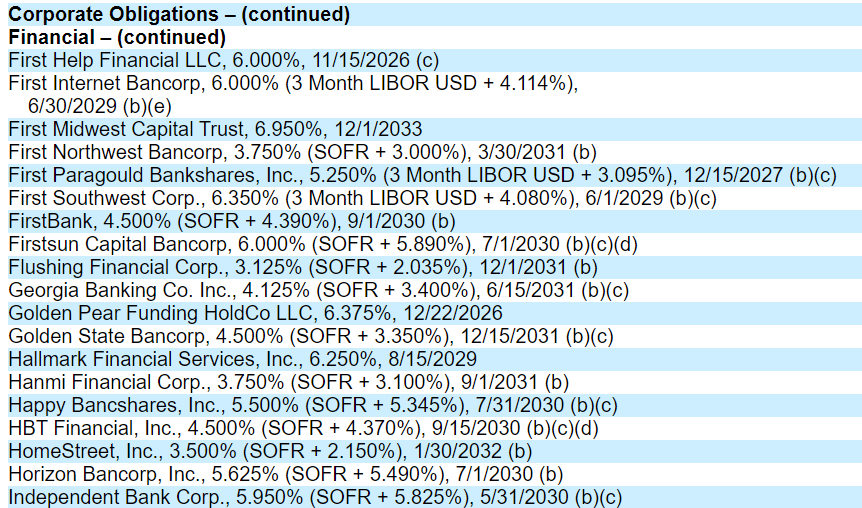
Three, its liability profile is mostly fixed. Specifically, it has $54m in repo and $85m in fixed-rate bonds. More interestingly, the bonds are both relatively long-dated (2026, 2028 maturities) and boast very low interest rates. For instance, the 5Y Treasury yield is currently 3.43% while the weighted-average interest rate on the FINS bonds is just 2.6%. The fund masterfully timed the issuance of these bonds at a historic low in corporate bond yields.
Angel Oak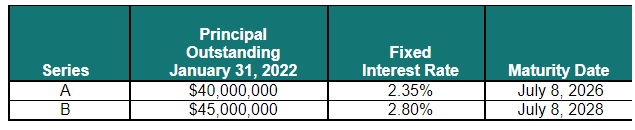
Four, it has held up very well this year with a total NAV return of -5.9%. This is in the context of investment-grade CEF sector total NAV return of -13%. Its performance is better than nearly all credit CEFs which it owes to the combination of a modest duration profile (due to floating-rate holdings) and a higher-quality allocation.
Five, FINS has recently cut its distribution by 12%. This may not sound like a great result to some investors. However, its previous NAV distribution rate of north of 9% was unsustainable and required a rightsizing. After the cut, the distribution is on a much more sound footing and removes the immediate need for further cuts.
Sixth, the fund has a term structure, meaning it has a planned termination date which in this case is in 2032 (which can be extended by 18 months). A termination date is not a guarantee that the fund will terminate. That said, for funds trading at attractive discounts it offers a positively asymmetric profile. In case of termination, its discount will move to zero, creating a performance tailwind. And in case the shareholders vote to cancel the termination its discount shouldn’t move much wider. This is particularly the case for FINS as its discount is already 4% wider than the sector average while its 3Y total NAV return is slightly better than the sector average. In case the fund does terminate it should enjoy a 1% per annum return tailwind as its discount moves to zero over time. This pull-to-NAV yield, as we call it, is close to its historic high.
Systematic Income CEF Tool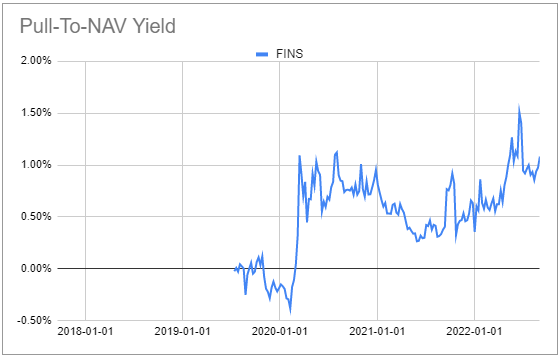
Seventh, most income investors focus on the current yield of any given CEF as well as its investment income to gauge how much they are earning. The trouble is that in most cases these two metrics are a terrible proxy for a true yield of the fund which is the fund’s portfolio weighted-average yield-to-maturity (or yield-to-call / worst for callable bonds).
This issue is much broader than just for FINS and is present in all bond funds. Thankfully, some managers such as State Street which manage the bond fund (JNK), which we use to illustrate the issue, make this more obvious. The fund’s average yield-to-worst is 8.48% while its current yield (i.e. coupon / price) is just 6.46%. The difference has to do with positive pull-to-par of the portfolio bonds given the average price is just $87.82.
SSGA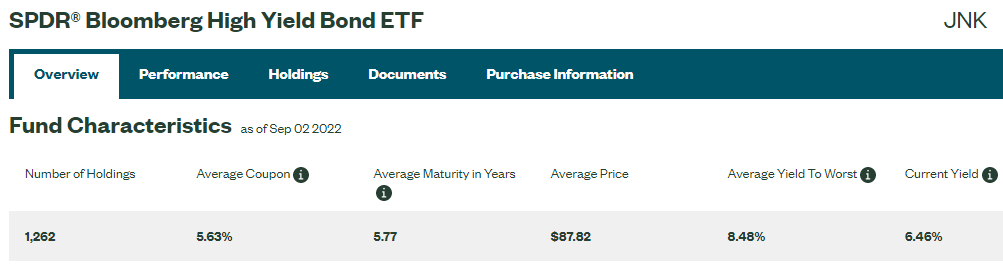
We can illustrate how the two yields compare for different levels of bond prices in the chart below. At a price of $100 the two are equal, however, they diverge when the bond price moves away from $100. Bond prices are, by and large, below par these days which means that bond fund portfolio weighted-average yields-to-worst are above their current yields. The key point here is that because bond prices are no longer above par as they were in 2021, the pull-to-par headwind has turned into a tailwind and the portfolio yield-to-worst is actually higher than the fund’s net investment income implies. This is a good result for a bond fund like FINS.
Systematic Income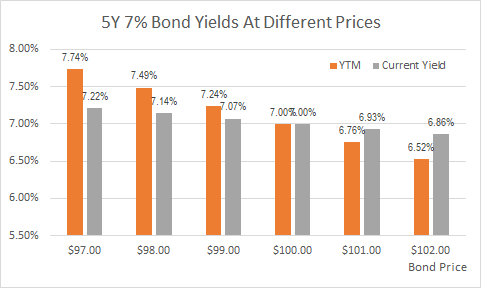
Finally, the most common go-to for income investors in search for floating-rate assets are bank loans. However, while rising short-term rates do result in rising loan distributions, they also pull a significant amount of additional pressure on loan borrowers in the form of a rising interest expense. This is particularly challenging for lower-rated borrowers which make up most of the loan sector. The advantage of a fund like FINS is that because most of the borrowers are investment-grade (roughly two full-rating levels above the typical loan borrower) rising interest expense is much less of a concern for borrowers in the FINS portfolio. Obviously, this higher-quality profile does come at the expense of yield but once we adjust for different levels of expected losses between bank loans and investment-grade bonds the yield differential is not as large as it seems.
Gauging The Fund’s Income Profile
Let’s take a look at what the income picture looks like.
Unfortunately, as with most other CEFs, it’s not easy to work out what the fund’s true underlying yield really is.
Normally, investors use the fund’s distribution as a proxy for its underlying yield; however, this is generally a very bad idea.
Other investors do something better which is to go to the fund’s income as published in the semi-annual shareholder reports. However, this is a problem for a fund like FINS for two reasons. First, as touched on above, as a bond fund, its investment income will be a poor reflection of its portfolio yield-to-worst as it ignores pull-to-par. And two, because it holds mostly floating-rate bonds, shareholder reports are hopelessly out of date given how fast short-term rates have moved, i.e. they will understate the fund’s actual portfolio yield.
To gauge the fund’s actual yield we need to understand the fund’s holdings – specifically we need to look at its coupon structure and its weighted-average price. We can get these figures from the fund’s April holdings report. What we get to is that its weighted-average coupon is roughly SOFR/Libor + 3.8% and its weighted-average clean price is around $98.70 which we round up conservatively to $100 for this exercise. Not all holdings are floating rate but those that are not have relatively high yields which is an offsetting factor.
To gauge the fund’s price portfolio yield we show two figures. The left-hand chart shows the fund’s portfolio yield on price of 7.33% when SOFR rises to 3% which should happen by the time of the September Fed hike. The right-hand chart shows the fund’s portfolio yield on price will rise to around 8.5% when SOFR is at 4% which is roughly where it’s expected to peak.
Systematic Income CEF Tool
These are clearly very attractive levels for mostly investment-grade risk. By contrast BBB-rated investment-grade bonds are now trading at a yield of 5.25%. Investment-grade bank preferreds are trading around 5-6% yields. This yield pick-up is a function of the fund’s leverage, its wide discount and its relatively low leverage cost.
The fund’s discount is now trading relatively wide relative to its sector which creates an attractive entry point.
Systematic Income CEF Tool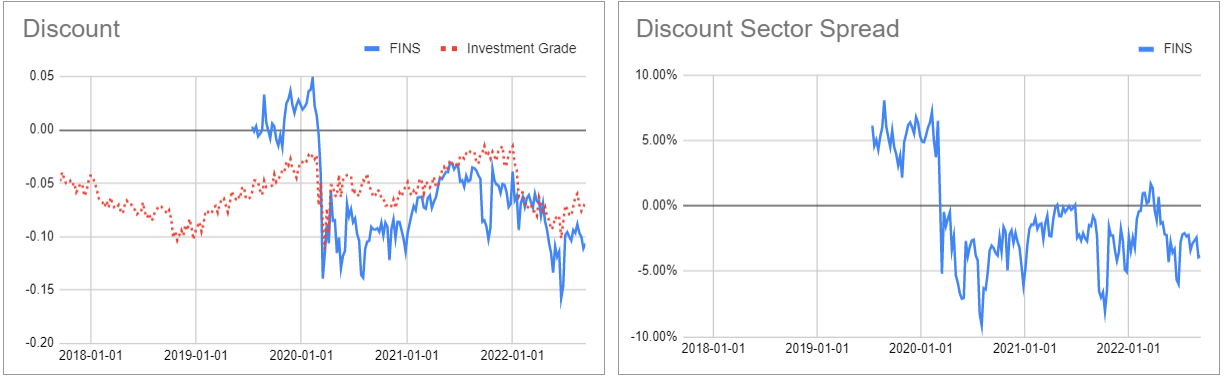
Takeaways
As highlighted above, a fund like FINS now offers a compelling proposition as a higher-quality holding in a diversified income portfolio.
However, it does carry some risks though not of the usual kind. The chief risk is a potential missing out in case corporate bond yields fall right back down. In this scenario, longer-duration, lower-quality assets like high-yield corporate bond CEFs would outperform FINS.
In our view, there is no need to view income allocation as an either-or. An income portfolio can happily accommodate high-yield corporate bonds as well as floating-rate investment-grade bank debt which FINS specializes in.
The second risk to the fund is that the Fed policy rate starts moving back lower after reaching a peak. As the chart below shows, the Fed policy rate does not tend to stay at its peak for a long time.
Bloomberg
Fed’s Mester, however, has recently said, “My current view is that it will be necessary to move the fed funds rate up to somewhat above 4% by early next year and hold it there. I do not anticipate the Fed cutting the fed funds rate target next year.” This view is very likely widely shared on the Board given the high level and relative stickiness of inflation. It would also be odd for the Fed to start cutting rates even as it continues to shrink its portfolio via its Quantitative Tightening operations. Overall, we don’t expect short-term rates to move significantly lower next year however even if it happens the move lower is likely to be much more gradual than the rise.
Be the first to comment