

katleho Seisa/E+ via Getty Images
INVESTMENT STRATEGY OUTLOOK – SMALL CAP EQUITY
The FMI Small Cap portfolios declined approximately 4.4% (gross)/4.5% (NET) in the March quarter compared to a 7.53% drop in the Russell 2000 Index, and 2.40% loss in the Russell 2000 Value Index. Areas where the portfolio had little exposure, such as Energy Minerals & Utilities, accounted for the performance difference between the Small Cap strategy and the Russell 2000 Value. Compared to the Russell 2000, sectors that helped performance included Commercial Services, Health Technology, and Technology Services. Sectors that detracted included Energy Minerals, Industrial Services, and Utilities. Henry Schein, Inc., Zions Bancorporation, N.A., and Robert Half International, Inc. added to performance in the quarter while LCI Industries, Genpact Ltd., and LGI Homes, Inc. detracted. Since the Russian invasion of Ukraine on February 24, the market has moved in somewhat of a barbell fashion, with Energy/Non-Energy Minerals and Industrial Service companies tied to these segments driving the value trade, while many speculative growth names also moved up sharply.
Quarterly investment letters across the land will be focused on the Russian invasion and what it means for geopolitical stability, supply chains, energy, inflation, globalization, economic growth, and interest rates. All of these elements were in play long before the invasion. Although markets have largely ignored it, China and Russia substantially increased their belligerence toward the U.S. (and the “West”) in recent years. A new two-pronged cold war with China and Russia has been underway for some time. Historically, sanctions have not been terribly effective, as authoritarian leaders (Mussolini, Castro, Kim Jung Un/IL, Chavez, Maduro, Khomeini) survived by controlling the narrative and crushing popular dissent. Maybe the coordinated effort of a surprisingly large number of Russian trading partners and central banks will prove to be the exception. We don’t expect Putin to change course because of sanctions or exposure of war atrocities, but perhaps Xi Jinping has taken notice and pauses any moves on Taiwan. On a gross basis, China exported $577 billion to the U.S. and $701 billion to the European Union in 2021. China can ill afford a trade war with the West, although the reverse is also true. The war has already had impacts on commodities, intermediate products, and the supply chain. Energy and mineral prices have blown out. Inflation, which started rising rapidly twelve months ago, remains at a 40-year high. For at least three decades, the world’s inflation picture has benefitted from a giant Chinese labor arbitrage that is now in the rearview mirror, as the Chinese working-age population is no longer growing, and wages there have risen markedly. Additionally, both politically and strategically, the West will need to secure more production domestically or with friendly regimes — whether it be in energy, materials, or manufactured goods — adding to inflation pressure in the short-to-intermediate term.
While the end of the pandemic and possible slowing of the economy may bring inflation down somewhat, we cannot avoid the ramifications tied to years of quantitative easing, rapid money supply growth, and unprecedented fiscal expansion. The market hasn’t figured this out yet, in fact, speculative activity has reemerged in recent weeks. Despite this, if higher interest rates and inflation characterize the landscape for the next several years, it likely spells the end of the era of unbridled speculation and high multiples. We believe the portfolio is well- positioned to thrive in the tougher world that may be upon us.
Interest Rates and Inflation
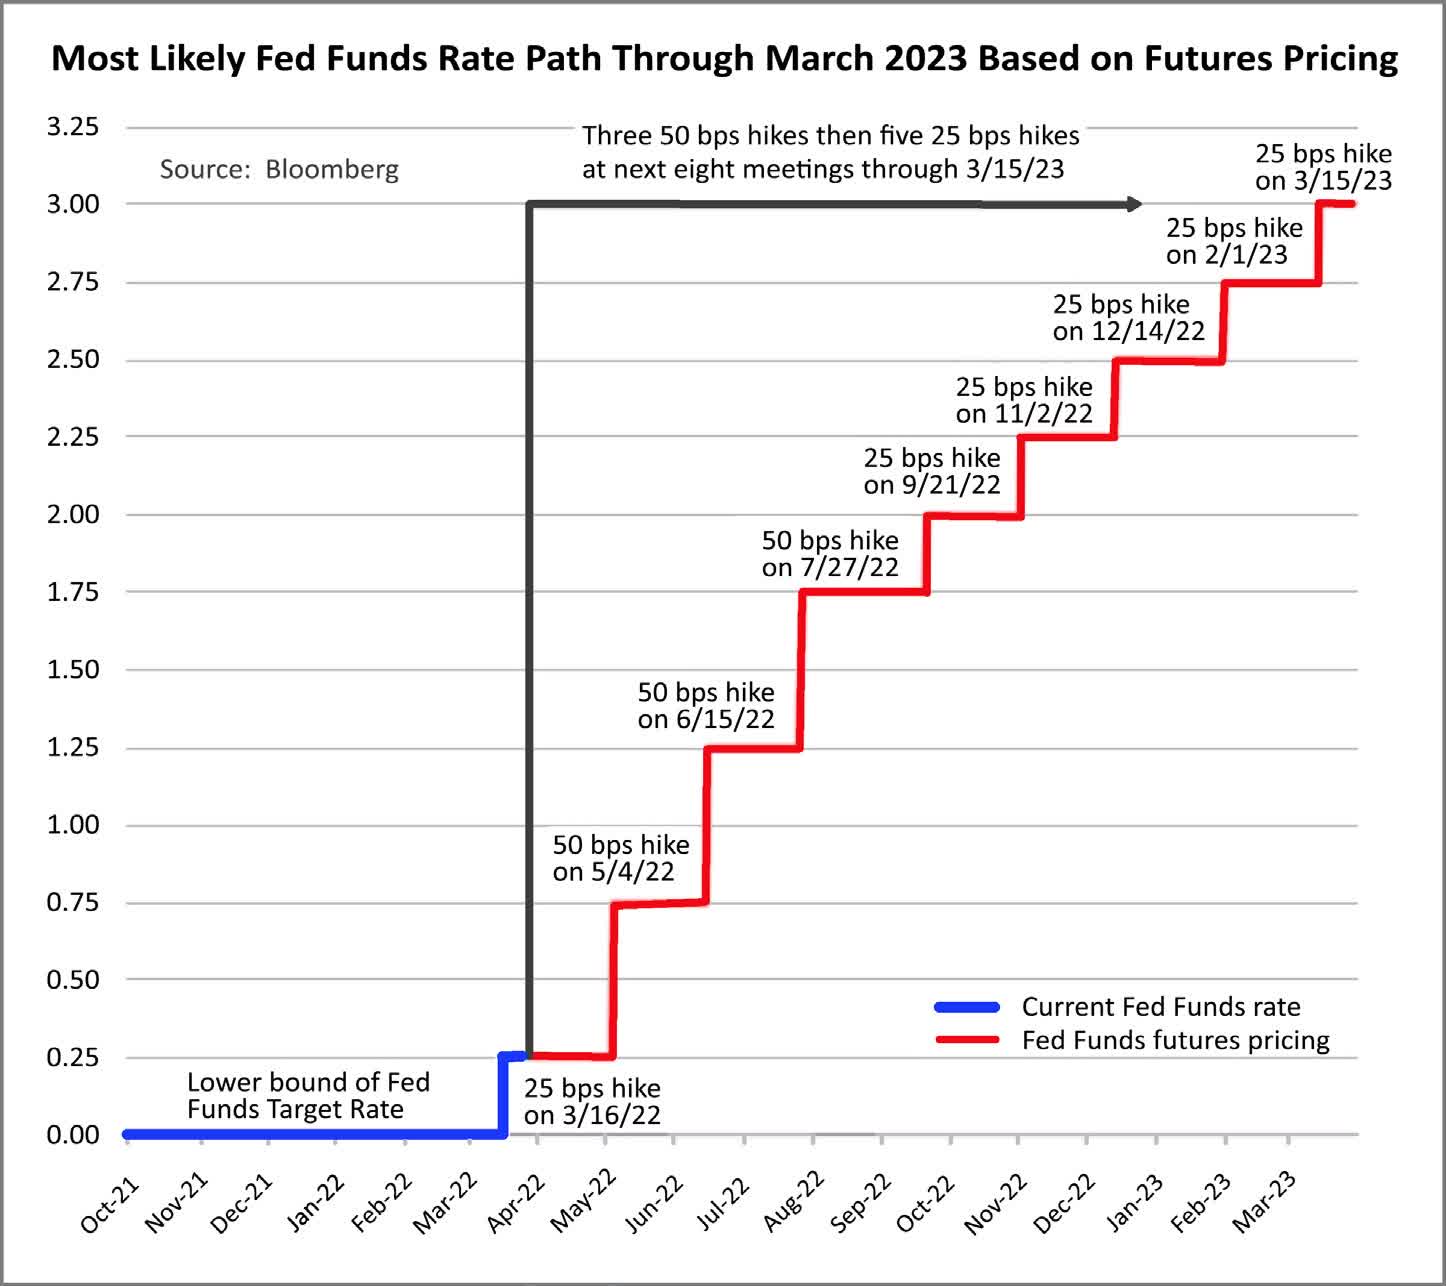
Nearby is the latest illustration of the expected Fed Funds Rate to March 2023. If these moves come to pass, the recent 0% Fed Funds Rate would be 3%.
Now observe the chart on the following page showing the Fed Funds Rate and the inflation rate over fifty years. Tracking the Federal Funds Target Rate back to 1971, the average inflation rate as measured by CPI from 1971 until today is 3.9%.
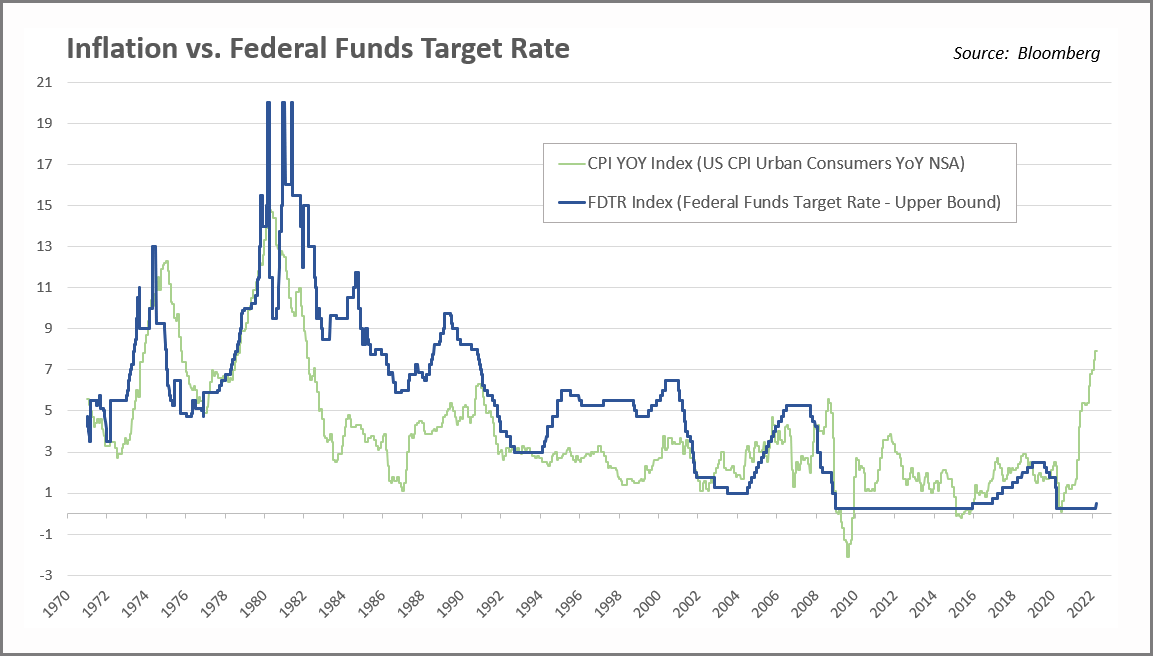
Inflation Episode 1
The CPI went from 2.7% to 12.3% from the 3rd quarter of 1972 to the 4th quarter of 1974. The Fed Funds rate went from 5% to 13% from the 3rd quarter of 1972 to the 2nd quarter of 1974. From the 4th quarter of 1974 to the 4th quarter of 1976, CPI went from 12.3% to 4.9%.
Inflation Episode 2
CPI went from 4.9% to 14.8% from the 4th quarter of 1976 to the 1st quarter of 1980. Fed Funds went from 6% to 20% from the 4th quarter of 1976 to the 1st quarter of 1980. Inflation finally got to a more normal level by the 4th quarter of 1982. From the 1st quarter of 1980 to the 4th quarter of 1982, CPI averaged 9.7% while the Fed Funds target averaged 13.6%.
Inflation Episode 3
CPI went from 1.1% to 6.2% from the 4th quarter of 1986 to the 3rd quarter of 1990. Fed Funds went from 6% to 9.75% from the 4th quarter of 1986 to the 1st quarter of 1989. CPI from the 3rd quarter of 1990 to the 4th quarter of 1991 went from 6.2% to 3.1%. CPI was under control from 1991 until the financial crisis in 2008, averaging 2.7% while the Fed Funds target rate averaged 3.95%.
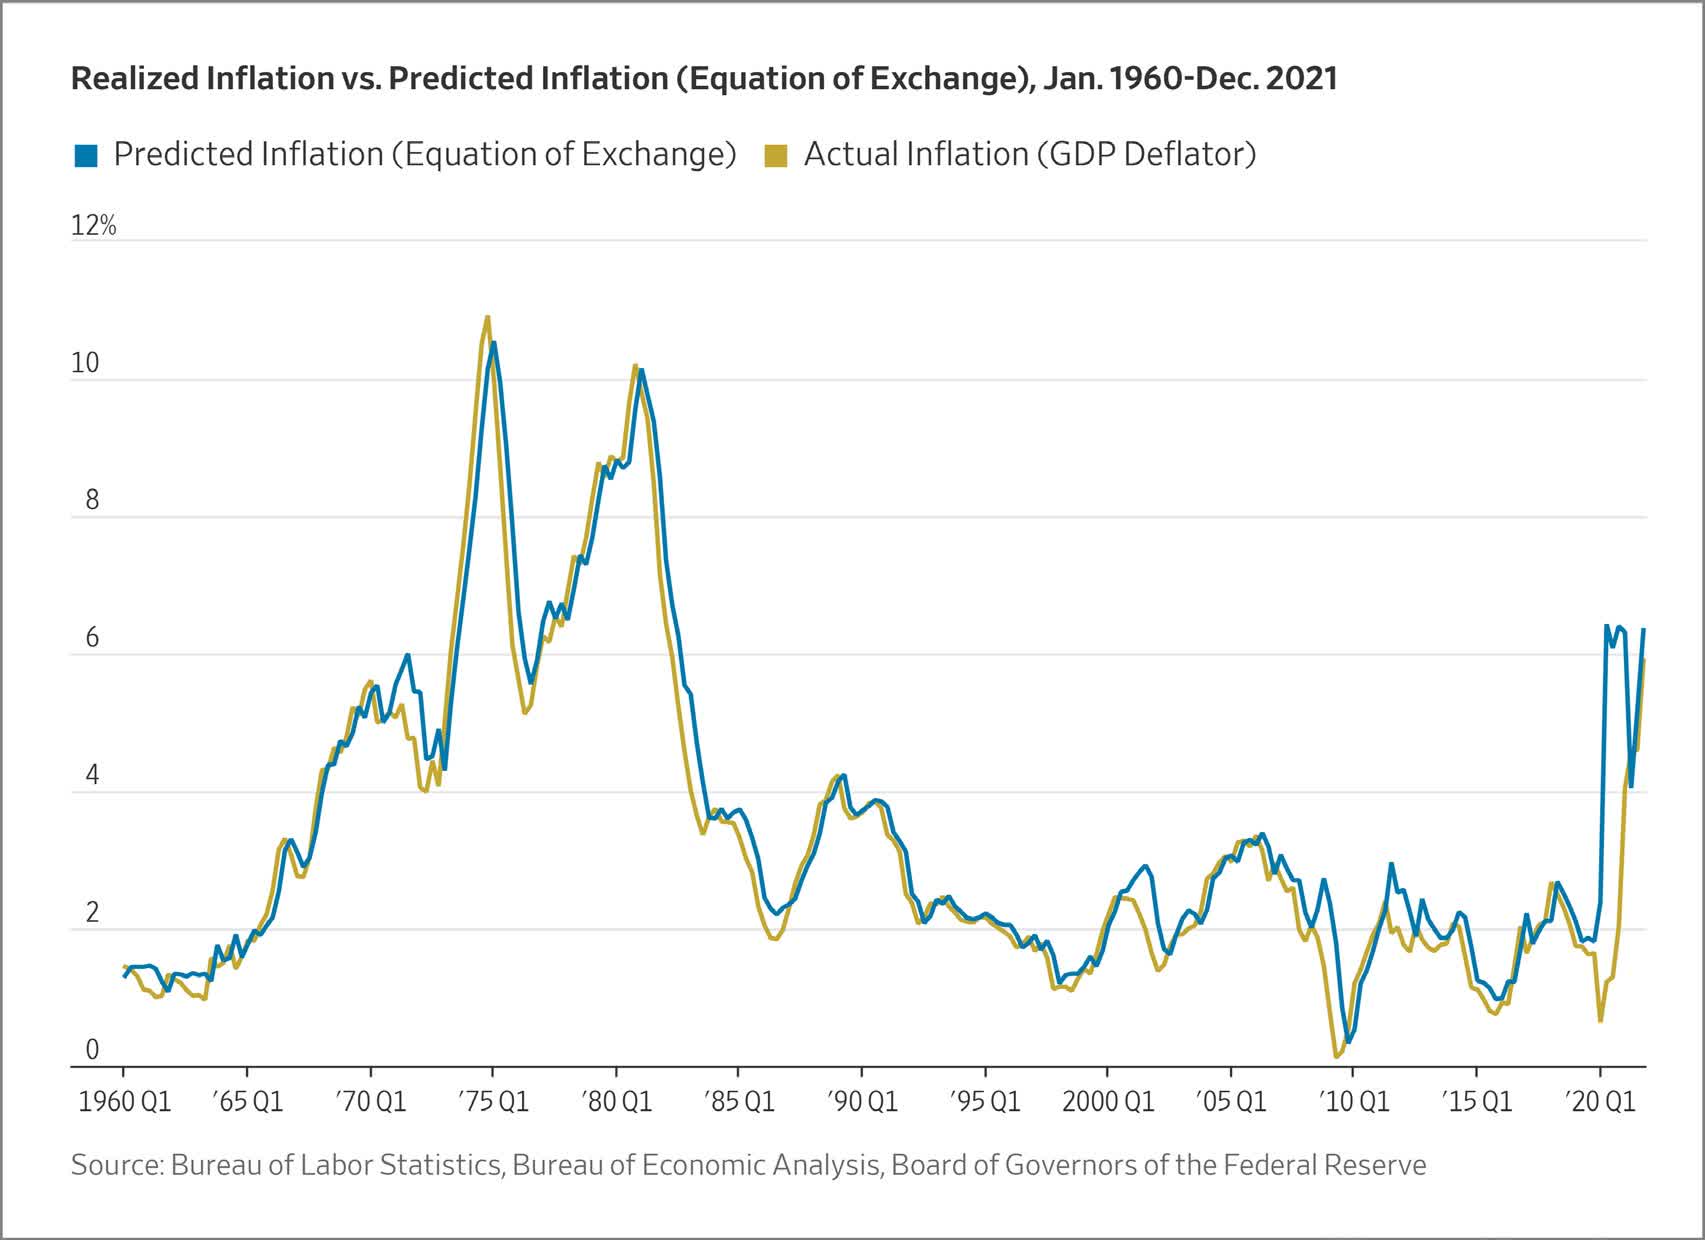
Virtually every time inflation spiked over the past fifty years, the Fed Funds Rate went higher than the inflation rate to tame it. How many investors today believe the Fed Funds Rate is on a path toward 8%? Inflation is taking longer to stabilize than expected and Chairman Powell is pointing toward short-term supply chain problems, or transient war impacts. The stock and bond markets seem to agree it’s a temporary challenge. As of 3/31/22 the S&P 500 is only 5.2% off its high, and the bond market (using inflation- adjusted Treasury securities) expects five-year inflation to drop dramatically. A recent study from AllianceBernstein (AB) concluded that only 1.5 percentage points of the 7.9% inflation rate is likely due to one-time supply chain effects. More traditional monetary factors appear to be the culprit. In a recent piece from The Wall Street Journal by Hanke and Hanlon,1 titled, “Jerome Powell is Wrong. Printing Money Causes Inflation,” the authors point out that in two separate communications with Congress over the past year, Powell said the connection between money supply growth and inflation ended 40 years ago. The chart on the next page throws cold water on these assertions.
Why is the market not yet buying the high inflation, higher rate thesis? One possible explanation gaining traction is the notion that we are headed for a recession, complete with demand destruction and falling prices, or at least a much slower growth rate in the CPI. Given the downward action in many stocks recently (aside from energy and commodities), this seems plausible. Yield curves have flattened in recent weeks. Inverted yield curves (short-term rates exceeding long-term rates) have a better-than-average track record of predicting recessions. Talking to our companies, however, and observing demand across many industries, it does not feel like a downturn is imminent. Perhaps stagflation is on the horizon. Whether underlying economic growth remains solid or weakens enough to cause a recession, we do not see inflation returning to 2% anytime soon. Moreover, with quantitative easing ending, Fed Funds rising, and bond investors wanting more compensation for the risk of inflation, longer maturity interest rates may continue to normalize. As we indicated in our letter of December 31, 2021, the 10-Year Treasury’s median yield since 1957 is 5.38% compared to 2.34% today (up from 1.51% as of 12/31/21).
It is hard to imagine P/E multiples remaining near all-time highs with the discount rate escalating.
Market Behavior
The value move in the market this year is mostly related to hydrocarbon exploration and production stocks, as well as other commodity- oriented equities. The Small Cap portfolio has little-to-no exposure to these sectors, as over long periods of time, most of the companies in these sectors have proven unable to earn their cost of capital and are highly volatile. These stocks periodically race higher, but elevated commodity prices almost always spur a supply response that typically ends the rally. Higher raw material prices have temporarily affected a few of our stocks, but these companies have good market power and are already raising prices aggressively. We expect within a few quarters that margins will recover.
In the latter parts of last year and into the beginning of this year, the market was correcting a significant amount of excess, and it looked like the growth fever had broken. In our letter of December 31, 2021, we presented a table with a number of notable names down between 50-90% from their highs. Strangely, considering war, inflation, and rapidly rising rates, many meme stocks and other speculative issues have once again rallied. The same names are depicted on the left, with their performance since the Russian invasion through 3/29/22. Based on EBIT, only four of these companies have earnings.
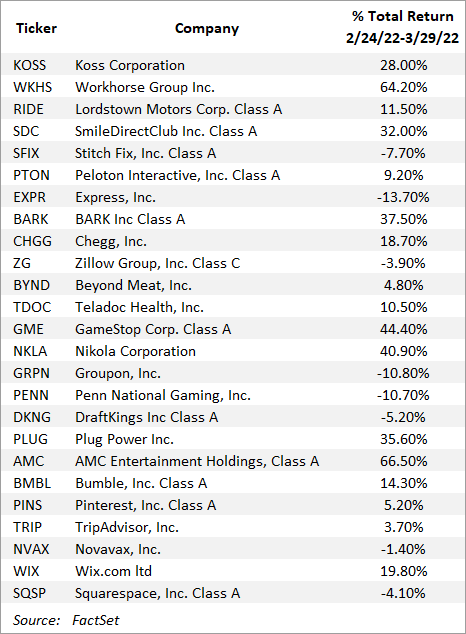
Remarkably, the Nasdaq-100 and Russell 2000 indices are up 6.25% and 3.90% through 3/31/22, respectively, since the war started. Tesla, Inc. (TSLA) went up 57% from its low on February 24 ($700) to the close on March 29th ($1099), which equates to an advance of $413 billion. To put that in perspective, the 24-trading day gain in Tesla was greater than the entire market value of Walmart, Inc.! Tesla trades for 120 times estimated 2022 GAAP2 earnings, compared to Walmart’s (WMT) 21.8 multiple (1/2023 fiscal year). Robinhood Markets, Inc. (HOOD) gained 47% from February 24th to March 29th, which gives another indication of how the speculative candle has reignited. Additionally, the high yield market has outperformed investment grade credits and treasuries, both year-to-date and, inexplicably, post the Russian invasion. It is difficult to understand this; our only explanation is that after years of aggressive behavior being rewarded, investors’ muscle memory remains strong, kicking in whenever trouble surfaces, knowing the Fed has a long history of coming to the rescue (or losing its nerve when it comes to interest rate hikes). Of course, the difference this time around is that market interest rates are rising sharply, and inflation is proving to be sticky. It could also be that the market is anticipating the end of the war and are thus bidding up the most aggressive growth stocks; it is hard to know for sure. What does seem apparent is that investor psychology has not been significantly tempered by rates, inflation, or a war.
Looking back over the years, we have been surprised by how long interest rates have stayed low. It has created many problems, which we have discussed at length in previous letters and will not address here. One byproduct is high valuations that have rewarded speculative behavior.
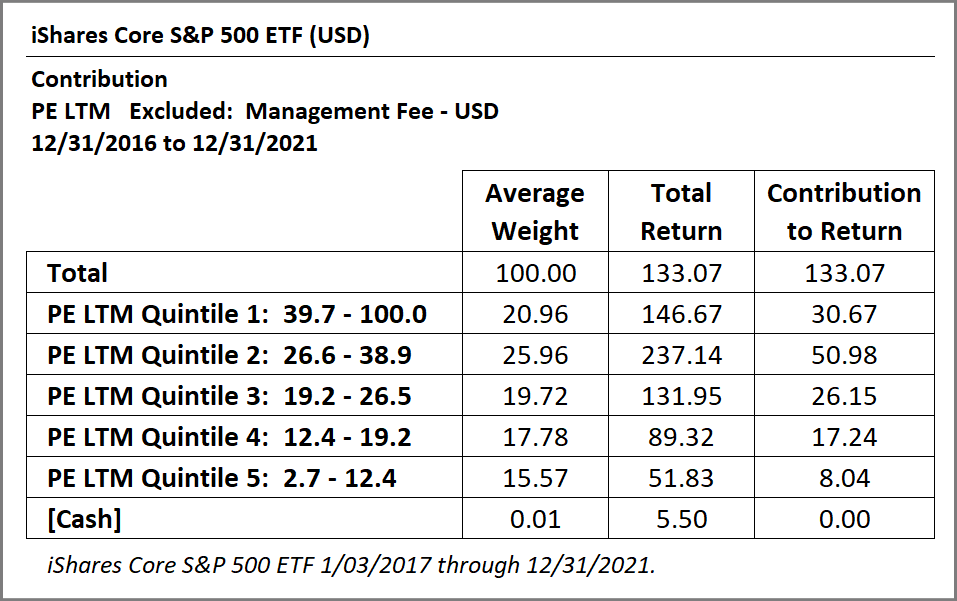
Throughout these years, our portfolio valuations have been considerably cheaper than the benchmark, and our balance sheets were better (and these conditions remain today). In hindsight, one could say we cared too much about risk. Data on price-to-earnings (P/E) ratios for the Russell 2000 is very difficult to develop, owing to the fact that roughly 40% (as of 2/28/22) of the companies do not have earnings. But in the S&P 500, contrary to decades of history, over the last 5 years, for all but one quintile, the higher the trailing price-to-earnings ratio, the better the stock performance, as illustrated by the table above.
In hindsight, almost every stock sold for valuation reasons looks like a mistake. We had a few problem stocks that, in retrospect, may have been too complicated, a couple where we misjudged the quality of the management, and a handful that were really hit by COVID. We’ve made some adjustments, are optimistic about the COVID-affected names, and are confident in the lineup we have today. We make no apologies about having a deep concern about downside risk and sticking with high-quality businesses and relatively low valuations. The portfolio trades at a 15-50% discount to the iShares Russell 2000 based on an array of valuation metrics. These attributes should be rewarded in time.
As per usual in the March letter, we include a brief commentary on two portfolio holdings.
Skechers U.S.A., Inc. (SKX)
(Analyst: Matt Sullivan)
Description
Skechers is the third largest footwear brand in the world. The company designs, manufactures, and distributes footwear for men, women, and children in U.S. and international markets. Its products cover a wide range of footwear categories including casuals, dress casuals, sandals, boots, work boots, performance footwear, and kids footwear. The company operates in three business segments: Domestic Wholesale (23% of sales), International Wholesale (48% of sales), and Direct-to-Consumer (29% of sales). In total, international sales account for approximately 60% of revenue.
Good Business
- Excluding net cash on the balance sheet, return on invested capital (ROIC) is in the mid-teens, which easily exceeds the company’s cost of capital.
- Skechers has established a brand over the past 30 years that customers associate with comfortable, quality shoes at low prices, which we believe is an attractive niche.
- This is a scaled player in the industry that can efficiently design, manufacture, market, and distribute shoes all over the world.
- The company has exposure to a wide range of domestic and international distribution channels, including both third party and owned e-commerce websites. Consumers can find the company’s products however they’d like to shop.
- Sketchers sells a broad assortment of shoes and uses a fast follower model, which we believe reduces fashion risk.
- The company is in a net cash position and the business is easy to understand.
Valuation
- Excluding net cash on the balance sheet, Skechers trades for 12.3 times our next 12-months earnings per share (EPS) estimate, which is below the company’s 5-year average and is a significant discount to the Russell 2000, as well as other comparable companies serving similar end markets.
- The EV/sales multiple is 1.0 times, which is below the company’s 5-year average of 1.2 times.
Management
- Management and the board own ~41 million shares of stock, which equates to ~26% of the company.
- The company’s founder, Robert Greenberg, is Chairman and CEO.
- Michael Greenberg, son of the founder, is President, and has been at Skechers for 29 years.
Investment Thesis
Skechers has built an impressive global business over many years. The growth and ROIC track record of the company has been terrific. We believe the company can continue to grow nicely and with rising margins over the next number of years, as it keeps expanding internationally and further develops its direct-to-consumer business, which includes fully owned stores and the Skechers.com website. These segments sport accretive margins, meaning outsized growth in these channels will boost consolidated company margins. Near- term supply chain challenges are weighing on the stock’s multiple and distracting from Skechers’ attractive longer-term outlook. The company has a fortress balance sheet, reports GAAP earnings, and doesn’t engage in mergers and acquisitions activity. All in, this appears to be a rare value in a very expensive market.
nVent Electric PLC (NVT) (Analyst: Dain Tofson)
Description
nVent is a global provider of electrical connection and protection solutions. It was spun out of Pentair in 2018. The company is headquartered in Minneapolis, MN, although it’s incorporated in Ireland, and reports three segments: Enclosures (51% of sales and 40% of EBITA3), Electrical & Fastening Solutions (27% of sales and 36% of EBITA), and Thermal Management (22% of sales and 24% of EBITA). By geography, sales are split 63% U.S. and Canada, 23% Developed Europe, 11% Developing, and 3% Other Developed. By vertical, sales are split 43% Industrial, 28% Commercial & Residential, 21% Infrastructure, and 8% Energy.
Good Business
- The company has industry-leading positions and strong brands across its segments. Key brands include Hoffman and Schroff in Enclosures, Raychem and Tracer in Thermal Management, and Erico and Caddy in Electrical & Fastening Solutions.
- The cost of the products typically represents a small proportion of the total cost of a customer’s end systems.
- nVent operates in an attractive industry structure with relatively high barriers to entry.
- EBITA margin was 17.7% in 2021, which is better than the average industrial company.
- nVent generates consistent free cash flow throughout an economic cycle, and has attractive ROIC prospects.
Valuation
- The stock trades at 16.0 times 2022 consensus EPS versus industrial peers at >20.0 times.
Management
- The management team led by Beth Wozniak has executed well since the spinout and has invested in new product launches, a digital transformation, and structural cost reductions.
- Management has laid out sensible capital allocation priorities including (1) reinvesting in the company to drive organic growth, (2) maintaining a competitive dividend, and (3) pursuing bolt-on acquisitions and/or share repurchases with an objective to allocate capital to the highest return, while appropriately managing liquidity and leverage.
- Randy Hogan, non-executive Chairman of the Board, was the CEO of Pentair from 2001 until the spin. Pentair significantly outperformed the S&P 500 during his tenure as CEO.
Investment Thesis
nVent has industry-leading positions, strong brands across its segments, leverage to mega-trends such as electrification, and consistent free cash flow generation throughout an economic cycle. It’s a better-than-average industrial business, in our opinion; however, the stock trades at a discount to industrial peers. The opportunity to own an above-average industrial business at a below-average price is an attractive proposition. Additionally, management’s investments since the spinout should increase the earnings power of the business, and subsequently, magnify the earnings gains in an upcycle. Finally, there is takeout optionality given nVent’s size and business quality.
Thank you for your confidence in Fiduciary Management, Inc.
Fiduciary Management Inc. Small Cap Equity Composite 12/31/2011 ‐ 12/31/2021
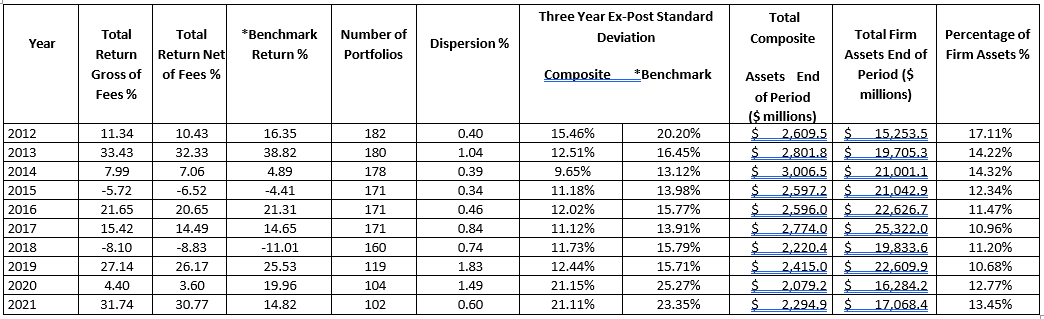
*Benchmark: Russell 2000 Index®
Returns reflect the reinvestment of dividends and other earnings.
The above table reflects past performance. Past performance does not guarantee future results. A client’s investment return may be lower or higher than the performance shown above. Clients may suffer an investment loss.
Footnotes
1Steve Hanke, professor, and Nicholas Hanlon, chief of staff, at the Johns Hopkins Institute of Applied Economics.
2Generally accepted accounting principles.
3Earnings before interest, taxes, and amortization.
Editor’s Note: The summary bullets for this article were chosen by Seeking Alpha editors.
Be the first to comment