

imaginima
In this analysis of Fidelity National Information Services, Inc. (NYSE:FIS), we cover the company as it regained market share in the Merchant Acquirer segment as well as its growth since its acquisition of Worldpay in July 2019. Since the acquisition, Merchant Solutions has been the highest-growing segment for FIS and its second-largest segment; thus we will analyze how FIS regained its Merchant Acquirer lead in 2021, the drivers of Merchant Solutions segment revenue, and how its margins compare with the other segments.
|
FIS Segments |
2017 |
2018 |
2019 |
2020 |
2021 |
2022F |
Average |
|
Merchant Solutions |
261 |
276 |
1,942 |
3,767 |
4,496 |
4,792 |
|
|
Growth % |
5.7% |
603.6% |
94.0% |
19.4% |
6.6% |
145.9% |
|
|
Organic Growth % |
5.7% |
9.0% |
-9.0% |
7.0% |
3.2% |
||
|
Banking Solutions |
5,552 |
5,712 |
5,592 |
5,944 |
6,396 |
6,651 |
|
|
Growth % |
2.9% |
-2.1% |
6.3% |
7.6% |
4.0% |
3.7% |
|
|
Capital Market Solutions |
2,749 |
2,391 |
2,318 |
2,440 |
2,624 |
2,656 |
|
|
Growth % |
-13.0% |
-3.1% |
5.3% |
7.5% |
1.2% |
-0.4% |
|
|
Corporate and Other |
106 |
44 |
481 |
401 |
361 |
321 |
|
|
Growth % |
-58.5% |
993.2% |
-16.6% |
-10.0% |
-11.1% |
179.4% |
|
|
Total |
8,668 |
8,423 |
10,333 |
12,552 |
13,877 |
14,420 |
|
|
Growth % |
-2.8% |
22.7% |
21.5% |
10.6% |
3.9% |
11.2% |
Source: Company Data, Khaveen Investments
From the table above, the sharp increase in revenues in the Merchant Solutions segment in 2019 and 2020 “were primarily due to the Worldpay acquisition”. Organic revenue growth for Merchant Solutions is defined as…
the current period compared to an adjusted revenue base for the prior period, which is adjusted to add pre-acquisition revenue of acquired businesses for a portion of the prior year matching the portion of the current year for which the business was owned and subtract pre-divestiture revenue for divested businesses for the portion of the prior year matching the portion of the current year for which the business was not owned, and has a 4-year average of 3.2%.
We forecasted FY2022 results based on the average revenue from the first 3 quarters of FY2022 and expect Merchant Solutions to see the highest growth. Merchant Solutions is expected to grow by 6.6% in FY2022, compared to Banking Solutions growth of 4.0% and Capital Market Solutions growth of 1.2%. As a result, FIS is expected to have a 5-year average total revenue growth of 11.2%.
FIS Regains Merchant Acquirer Lead
Nilson Report, Khaveen Investments 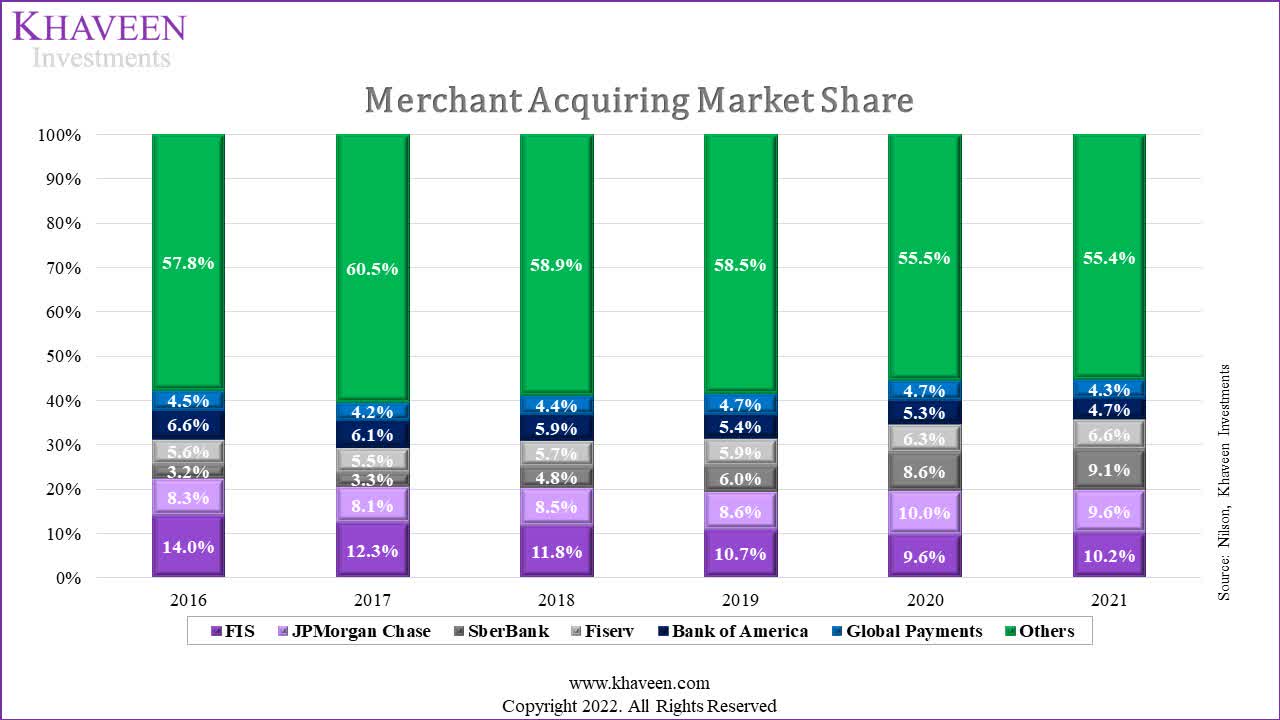
|
Merchant Acquirers Transactions (‘BLN’) |
2016 |
2017 |
2018 |
2019 |
2020 |
2021 |
Average |
|
FIS (Worldpay) |
32.5 |
33.5 |
35.4 |
36.7 |
34.1 |
42.5 |
|
|
Growth % |
3.0% |
5.6% |
3.9% |
-7.2% |
24.8% |
6.0% |
|
|
JPMorgan Chase (JPM) |
19.4 |
21.9 |
25.5 |
29.4 |
35.5 |
40.2 |
|
|
Growth % |
13.0% |
16.4% |
15.5% |
20.6% |
13.3% |
15.8% |
|
|
SberBank |
7.5 |
9.0 |
14.4 |
20.6 |
30.5 |
37.9 |
|
|
Growth % |
20.4% |
59.3% |
43.3% |
48.0% |
24.2% |
39.0% |
|
|
Fiserv (FISV) |
13.0 |
14.8 |
17.1 |
20.4 |
22.4 |
27.6 |
|
|
Growth % |
13.5% |
15.4% |
19.2% |
9.8% |
23.5% |
16.3% |
|
|
Bank of America (BAC) |
15.3 |
16.6 |
17.7 |
18.6 |
18.8 |
19.6 |
|
|
Growth % |
8.4% |
6.8% |
5.0% |
1.3% |
4.2% |
5.1% |
|
|
Global Payments (GPN) |
10.4 |
11.3 |
13.2 |
16.2 |
16.7 |
18.1 |
|
|
Growth % |
9.4% |
16.5% |
22.8% |
3.0% |
8.5% |
12.0% |
|
|
Others |
134.3 |
164.1 |
176.5 |
200.3 |
196.9 |
230.9 |
|
|
Growth % |
22.2% |
7.6% |
13.5% |
-1.7% |
17.3% |
11.8% |
|
|
Total Transactions |
232.3 |
271.2 |
299.6 |
342.2 |
354.8 |
416.8 |
|
|
Growth % |
16.7% |
10.5% |
14.2% |
3.7% |
17.5% |
12.5% |
Source: Nilson, Khaveen Investments
From the table above, FIS has one of the lowest 5-year average growth rates of 6.0%. This is mainly due to its negative growth of 7.2% in 2020 as it is said that its…
Merchant Acquirer business is more skewed to higher-margin categories like travel and restaurants.
Since the Covid-19 pandemic made travel and dining out nearly impossible, the number of transactions declined by 2.6 bln for FIS in 2020.
However, in 2021 where there was post-pandemic recovery, FIS led the rebound in the number of Merchant Acquirer Transactions by growing 24.8% in 2021, followed closely by SberBank and Fiserv showing a 24.2% growth and 23.5% growth respectively. FIS attributed its 2021 recovery…
primarily due to ongoing recovery from the pandemic and the partial return of in-person holiday shopping.
SberBank’s immense growth over the past 5 years to be Europe’s top merchant acquirer can be attributed to…
an increase in contactless payments and expanded card acceptance on the public transport system across Russia.
It believed that…
infrastructure development is one of the key factors necessary for the growth of cashless payments”
and thus introduced…
PoS terminals to be found in small shops in towns and cities throughout the country.
which contributed to Russia’s increased use of cashless payments. Since the Russian invasion of Ukraine, the National Bank of Ukraine has…
encouraged Ukrainians to make cashless payments as they were the safest and most reliable way to pay for goods and services in the current conditions”
which would spur the growth of cashless payments.
On the other hand, JP Morgan underperformed compared to the broader market as they grew by 13.3% in 2021 compared to the total transaction growth of 17.5%. This is likely due to the lack of acquisitions done in the merchant acquirer space, focusing more on big data, AI and providing premium customer experiences. In September 2022, JP Morgan acquired Renovite, a payment solutions company to “underpin its expansion of its merchant acquiring space worldwide” thus we would expect its market share to be tight with FIS in 2022.
The top 6 companies as highlighted in the table above have gradually established their lead from the others as they represented 44.6% of the market in 2021, compared to 39.5% in 2017.
|
Merchant Acquirer Comparisons |
FIS |
JP Morgan |
|
Countries presence |
146 |
170+ |
|
Currencies available |
120+ |
120 |
|
Fees (per transaction) |
0.15% + 4.5₵ |
2.6% + 10₵ |
Source: Merchant Cost Consulting, CNBC, Company Data, Khaveen Investments
As we compared the top 2 market leaders in the Merchant Acquirer space, FIS has a small advantage for having more currencies available for their merchants and charging them less per transaction. However, JP Morgan’s presence in more countries would allow it to grow faster especially when it leverages other segments of its business.
Merchant Solutions Growth Driven by Transaction Volume
|
FIS Merchant Acquirer |
2018 |
2019 |
2020 |
2021 |
2022F |
Average |
|
Transactions Volume (‘bln’) (‘a’) |
35.4 |
36.7 |
34.1 |
42.5 |
45.7 |
|
|
Growth % |
3.9% |
-7.2% |
24.8% |
7.5% |
7.2% |
|
|
Revenue/Transaction ($) (‘b’) |
0.111 |
0.107 |
0.111 |
0.106 |
0.105 |
|
|
Growth % |
-3.4% |
3.1% |
-4.3% |
-0.8% |
-1.4% |
|
|
Merchant Solutions Revenue ($ mln) (‘c’) |
3,925 |
3,939 |
3,767 |
4,496 |
4,792 |
|
|
Growth % |
0.3% |
-4.4% |
19.4% |
6.6% |
5.5% |
*c = a × b
Source: Company Data, Khaveen Investments
From the table above, we can see that the revenue per transaction has been hovering and has been on a slow decline with a 4-year average of -1.4%. Total Merchant Solutions revenue has been mainly driven by the increase in transaction volumes from 35.4 bln in 2018 to a forecasted 45.7 bln transactions in 2022 at an average of 7.2% per year.
FIS President highlighted that Merchant Solutions’ growth is due to…
the strength of our e-commerce and software-led strategy.
This has not helped in the revenue earned per transaction, however, it might have contributed to an increase in transactions done via FIS in 2021 and 2022.
Despite stronger consumer spending in 2022 as “spending per household was up 5.9% y-o-y”, FIS Merchant Solutions remained roughly in line with a forecasted FY2022 revenue growth of 6.6%. This is likely due to a “10% growth in services” where FIS is strong in travel, offset by a “y-o-y 3.7% spending growth for retail” where FIS is strong in restaurants.
FIS Margins Supported by Other Segments
|
FIS Margins |
2017 |
2018 |
2019 |
2020 |
2021 |
Average |
|
Merchant Solutions Revenue |
261 |
276 |
2,013 |
3,767 |
4,496 |
|
|
EBITDA margin % |
26.1% |
21.4% |
49.4% |
46.5% |
50.3% |
|
|
Change % |
-4.7% |
28.0% |
-2.9% |
3.8% |
6.1% |
|
|
Banking Solutions Revenue |
5,552 |
5,712 |
5,873 |
5,944 |
6,396 |
|
|
EBITDA margin % |
37.8% |
39.5% |
41.8% |
43.0% |
44.9% |
|
|
Change % |
1.7% |
2.3% |
1.2% |
1.9% |
1.8% |
|
|
Capital Market Solutions Revenue |
2,749 |
2,391 |
2,447 |
2,440 |
2,624 |
|
|
EBITDA margin % |
39.3% |
45.2% |
46.1% |
47.0% |
48.4% |
|
|
Change % |
5.9% |
0.9% |
0.9% |
1.4% |
2.3% |
|
|
Corporate and Other Revenue |
106 |
44 |
– |
361 |
401 |
|
|
Total Revenue |
8,668 |
8,423 |
10,333 |
12,512 |
13,917 |
|
|
EBITDA margin % |
34.4% |
37.2% |
40.7% |
42.0% |
44.0% |
|
|
Change % |
2.8% |
3.5% |
1.4% |
1.9% |
2.4% |
Source: Company Data, Khaveen Investments
From the table above, we can see the EBITDA margin for Merchant Solutions revenue drastically increased since the acquisition of Worldpay in 2019. However, it suffered a slight drop in 2020 due to…
decreasing volumes of high-margin services as a result of Covid-19 pandemic”.
Despite Merchant Solutions having the highest EBITDA margins among the 3 major segments, FIS EBITDA margin is mainly supported by its Banking Solutions segment as it made up 50.1% of its revenue on average since the acquisition of Worldpay. This is more evident in 2020 where FIS margins continue to increase by 1.3% despite Merchant Solutions EBITDA margin decreasing by 2.9% in the same period.
Overall, we expect FIS margins to continue increasing due to its gradual decline in cost of revenue which mainly includes…
payroll, program design and develop and professional services.
If the company remains prudent with its expense management, we expect to see company margins increasing but tapering off in the near future.
Risk: High Net Debt
FIS, Khaveen Investments 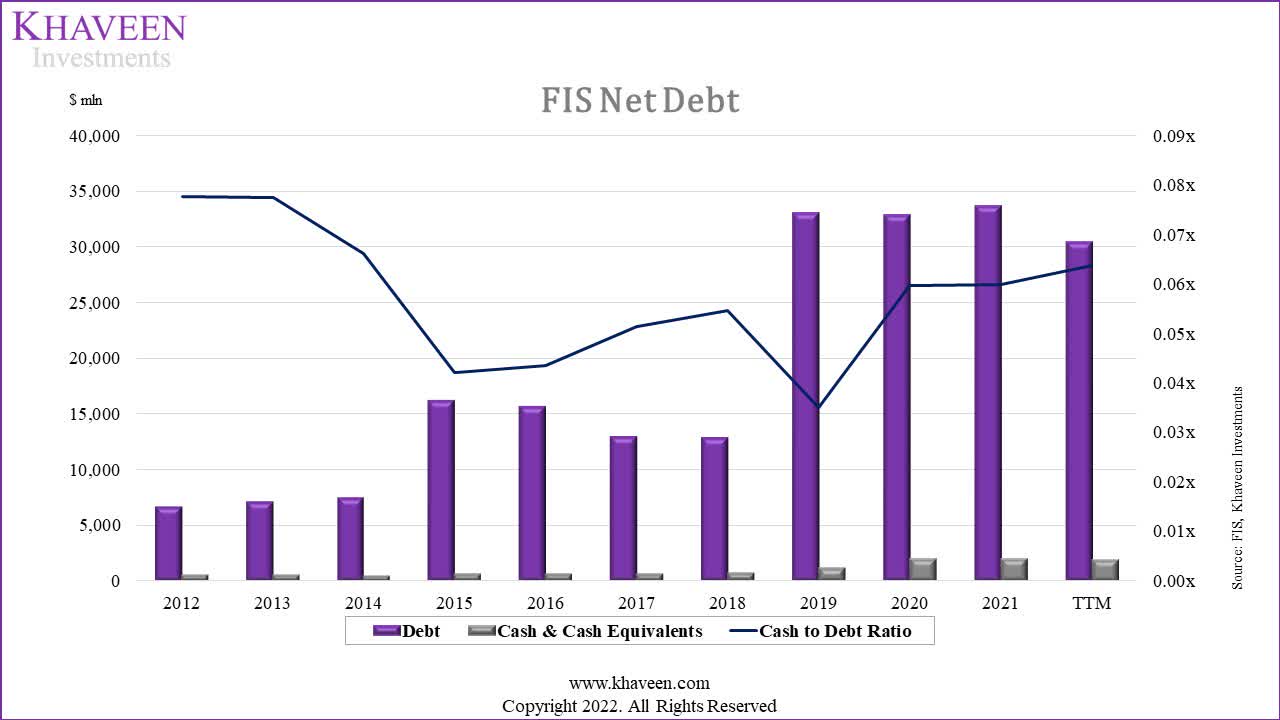
From the graph above, we can see that FIS debt levels spiked in 2015 and 2019 due to the $9.3 bln and $43.0 bln acquisitions of SunGard and Worldpay respectively. This worrying level of debt can be seen from its net debt-to-equity ratio of about 67% which is high. FIS would still need to further improve its cash-to-debt ratio as it remains in a vulnerable position of 0.06x in TTM.
Management has also highlighted that they “currently do not anticipate taking out incremental debt in 2023” and “should market conditions deteriorate, we will deploy our robust free cash flow to pay down upcoming maturities”.
Verdict
FIS, Khaveen Investments 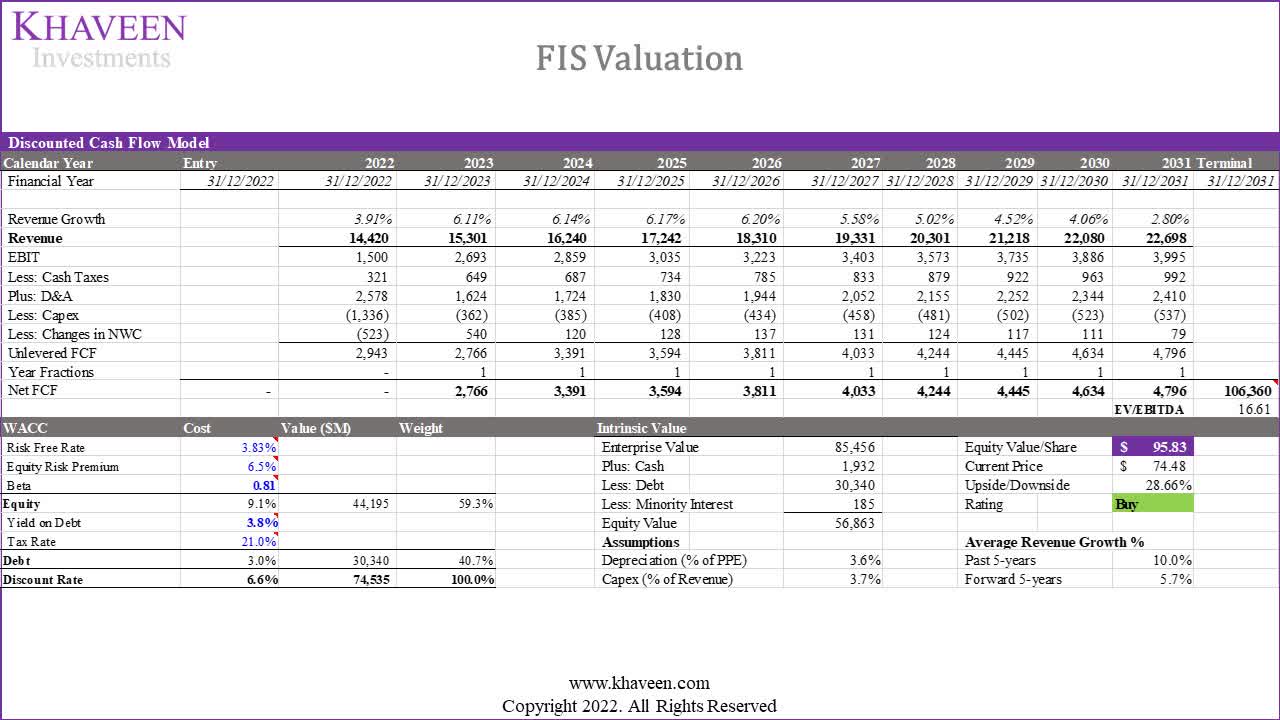
All in all, Merchant Solutions’ growth is expected to be the highest in FY2022 among FIS’s 3 core segments with a growth rate of 6.6%. However, its overall growth is expected to decrease to 3.9%, the lowest since 2018. We determined the company’s Merchant Solutions revenue growth is driven by its increase in transactions but is offset by the decrease in revenue per transaction. We updated our revenue growth forecast of a 4-year forward average of 8.3% for Merchant Solutions and 5.4% for Banking Solutions. For Capital Market Solutions, we forecasted its growth to be 4.7% for the next 4 years based on its historical 3-year average. We updated our valuation with a DCF analysis with our revised revenue forecasts and terminal value based on the Core Banking and Merchant Acquirer average EV/EBITDA of 16.61x, thus we obtained a price target of $95.83 with an upside of 28.66% and rated the company as a Buy.
Be the first to comment