

tdub303
Summary
Fidelity National Financial (NYSE:FNF) spun off shares of F&G Annuities & Life (FG) on Thursday (December 1). For every 1000 shares owned of FNF, shareholders received 68 shares of F&G Annuities.
It is a taxable transaction, but quite small for FNF holders. With FNF at $40 per share and F&G now trading at roughly $19.50, it is a 3% distribution relative to your stake in FNF pre-deal. The tax will be small in size given this.
Big picture, we like F&G, the new spinco. Only 15% of F&G was distributed to FNF holders, with FNF the parent keeping the other 85%.
With a $100 million dividend planned in early 2023, we see a stock trading at 7.2x 2023 estimated earnings with a 4.1% yield.
Capitalization Table (FG Financials, Author Spreadsheet)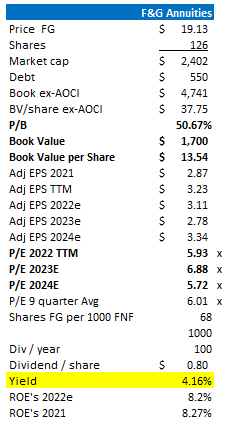
Most lop-sized spinoffs tend to trade quite poorly. Investors inherit small slivers of an equity, don’t care to do the work on them, and then just punt them.
We recommend either selling them quickly (today) if you are not interested in holding this name. Or, as is my plan, wait about a month and make it a real position. I only suggest a month as that is typically how long it takes these spins to wash out so to speak.
Technically, I would not be surprised to see FG fall to $15 (4.7x TTM earnings and a 5.3% yield) before seeing a bounce. I plan to add more at $16 and lower. Book value including AOCI is $13.54 as of September 30, but probably higher today given that book is marked to market (and we’ve seen bonds rally since then).
It is worth noting that virtually all FNF’s spincos do extremely well over time, and we have found Chris Blunt, the CEO of F&G to be an impressive operator.
Fundamentals
As a bit of history, FNF paid $2.55 billion for F&G in June 2020, a multiple of just under 10x TTM earnings. Today, the market cap is roughly the same.
Below we post several slides from their November 10th analyst day.
F&G Overview (FG Investor Relations)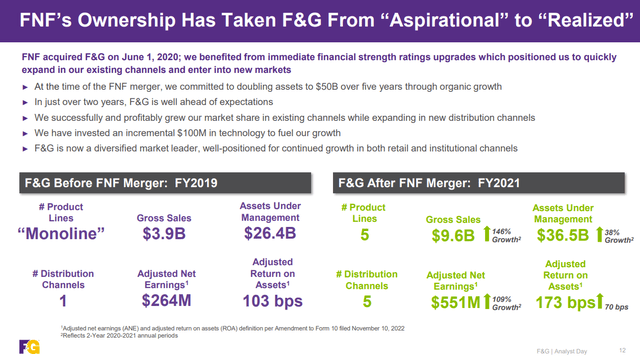
The company greatly improved the business in the next two and a half years. Management expanded the F&G from one distribution channel to five channels, gaining access to several new markets.
Sales doubled from 2020 to 2021, from $4.5 billion to $9.6 billion. Assets under management (“AUM”) also grew from $26.5 billion in mid-2020 to $42.0 billion as of September 30, 2022.
Here is a slide on sales.
FG Investor Relations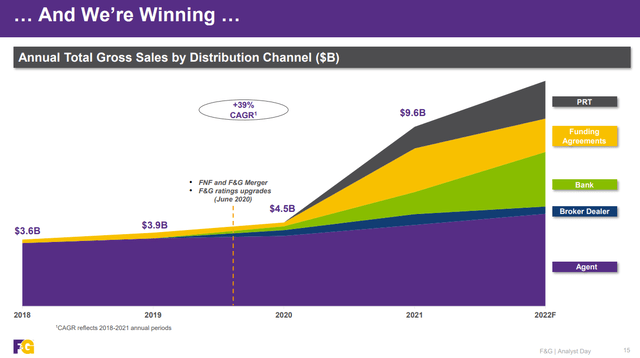
On the asset management side, FG uses Blackstone to manage their capital. Their assets appear quite diversified, with only 7bps of credit impairments over the past three years.
Portfolio (FG Investor Relations)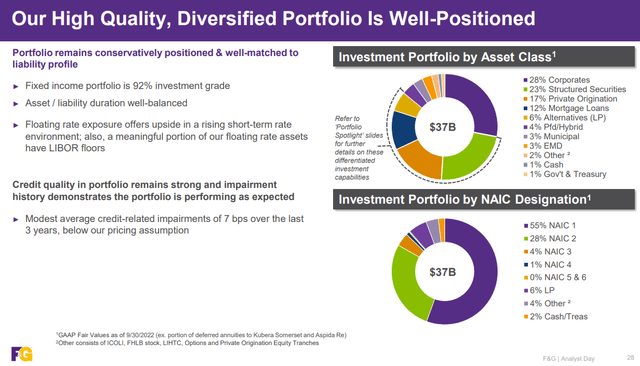
The growth at FG has been impressive, well-outperforming industry figures since 2017. Below is industry sales (on the left) and F&G sales on the right for Fixed Index Annuities (FIAs).
FG Investor Relations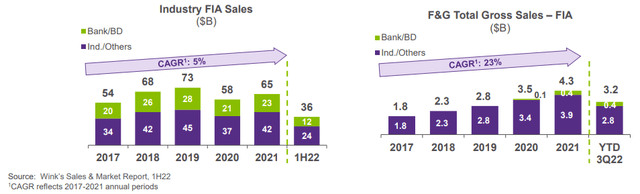
Below are sales of Multi-Year Guaranteed Annuities (MYGA).
FG Investor Relations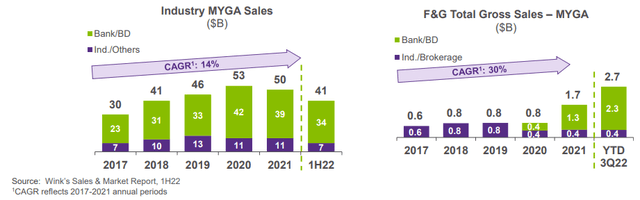
The company has quickly transformed from a Fixed Index Annuity issuer, one product company sold only through independent insurance agencies, to one selling FIAs, MYGAs and Indexed Universal Life products sold through agents, banks, and broker-dealers.
FG is also expanding into institutional products (e.g., pension risk transfer) which, while lumpy, is a growth area too.
Financials
While sales may be off in 2022 compared to a banner 2021, the year to date figures look solid still. Higher rates tend to spur investing in annuity products.
FG IR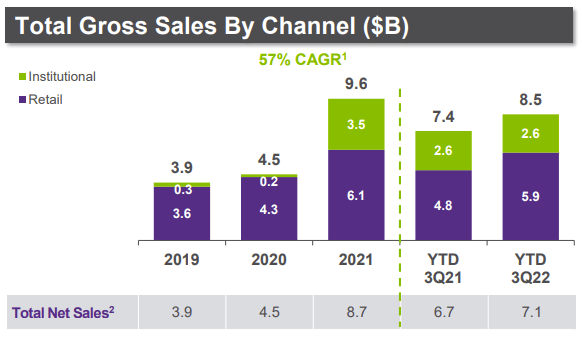
Of course, equity markets have put a damper on profitability, with market returns a headwind in 2022. Accounting rules have also recently changed. No longer can F&G report earnings using a long-term normalized return estimate for their Alternative funds.
In short, F&G historically applied a 10% normalized rate of return on their Alternative funds (compared to earning 12% since the deal closed). Going forward, the income statement will simply reflect the marked-to-market changes in this book.
The purple figures below illustrate both sets of earnings. In purple are adjusted earnings using normalized returns. In green are new methodology net income figures (now marked to market). Naturally, this will create more volatility in quarterly results.
Adjusted Net Earnings (FG IR)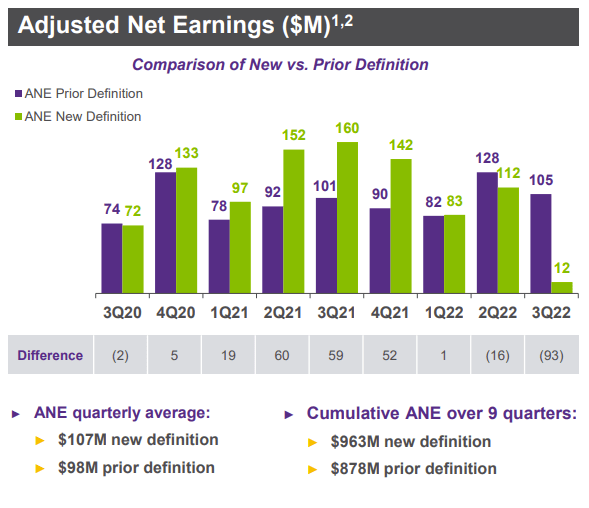
Earnings will look worse in bear markets (as in today) but better in bull markets.
Cumulatively, over the past nine quarters, Adjusted Net Earnings have been roughly equal (a little higher under the new accounting regime given that actual returns of 12% versus normalized assumptions of 10%).
For 2023, we assumed $87 million in quarterly net income, the average trailing twelve month new adjusted earnings figure. That implies FG is now trading at 6.9x forward earnings. That also assumes zero growth in 2023.
In 2024, we assume earnings revert back to historical norms of approximately 100 basis points of assets under management, or 1% of $42 billion. That is $420 million or $3.34 in EPS.
F&G has a great balance sheet, with A-/Baa1 ratings. The plan is to keep debt at 25% of total capitalization and RBC ratios over 400%.
The only real debt outstanding is a $550 million May 2025 bond with a 5.5% coupon (trading just under par). It is Baa2 rated.
Book value ex-AOCI today is $4.7 billion (as of 9/30), or $37.75 per share on newly trading FG equity.
Total book value is $13.54 per share. With ROEs over the past three years of 15%, 17%, and 8.3% (2022 YTD annualized per our estimates), we suggest that FG should trade about 0.5x-0.9x book (ex-AOCI). That implies $17-$30.
We have not had luck in finding statutory book values but will update when we do.
Comps
Comps (Bloomberg)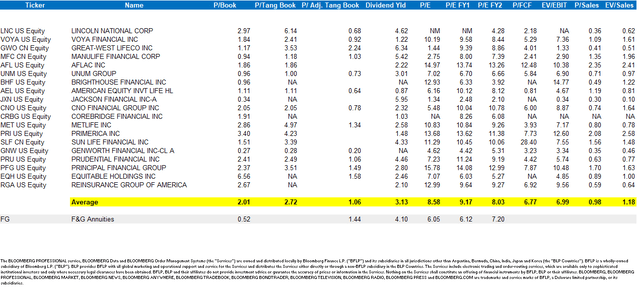
Valuation and Conclusion
From a valuation perspective, we think 6x-9x earnings is a conservative range for F&G.
On 2023 EPS, that gets us $17.00 to $26.00 including dividends in a year.
On 2024 earnings, assuming still no growth in AUM, we think a fair multiple is 9x-10x earnings.
That is approximately $31-$35 on the stock, including a year of dividends.
The downside appears limited barring a major mistake here. For the time being, the yield is attractive, but unknown to most investors who own this stock. Until that is declared in January, many will sell FG.
The longer-term view is positive in our view. Management has really ramped up growth, and with F&G growing net income from $247 million in 2020 to an estimated $350 million in 2023, we like the 12% earnings CAGR here (all organic). It could be higher with share repurchases.
But like we said, the technicals will probably be ugly near term. Selling fast today and waiting to reload at lower levels is likely a doable strategy.
But I intend to hold my position and add aggressively in the coming weeks.
Be the first to comment