

sankai/iStock via Getty Images
Written by Nick Ackerman, co-produced by Stanford Chemist. This article was originally published to members of the CEF/ETF Income Laboratory on October 30th, 2022.
First Trust Specialty Finance & Financial Opportunities Fund (NYSE:FGB) remains an attractively discounted fund. With its latest semi-annual report, we can see that the distribution coverage jumped quite sharply from the previous report. This was as a result of a good chunk of the top holdings raising their dividends, and they also had several significant specials paid out during the reporting period too.
Seeing the distribution covered entirely from net investment income is encouraging. Combining that with the fund’s discount, and I think that FGB remains attractive. That being said, this should be seen as a more volatile closed-end fund. The fund’s track record has proven that; this isn’t a “buy-and-hold” type of investment.
The Basics
- 1-Year Z-score: -0.04
- Discount: 10.22%
- Distribution Yield: 10.28%
- Expense Ratio: 1.51%
- Leverage: 14.18%
- Managed Assets: $60.659 million
- Structure: Perpetual
FGB has an investment objective to “seek a high level of current income. As a secondary objective, the fund seeks an attractive total return.” To achieve this, the fund will “invest, under normal market conditions, at least 80% of its managed assets in a portfolio of securities of specialty finance and other financial companies that the Fund’s sub-advisor believes offer attractive opportunities for income and capital appreciation.”
A risk to note here is the fund’s incredibly small size. That generally leads to a lack of trading volume. That would essentially leave larger retail investors out if they wanted to use it as a trading vehicle, which is what this fund is more appropriate for, in my opinion.
However, I would suggest that the biggest risk is due to the fund’s leverage. For the most part, the ~14% leverage is rather modest. That wouldn’t be taking into account the 92% of the portfolio being invested in business development companies, though.
BDCs themselves carry some significant leverage. So we are essentially seeing leverage on leverage, which is one thing that will make FGB much more volatile – as its underlying holdings can also be rather volatile.
The borrowings for FGB are also based on a variable rate of 1-month LIBOR plus 85 basis points. That means the costs of the borrowings will also increase as the Fed raises rates. This is the same for BDCs, but BDCs typically have significant, if not all, of their borrowings at fixed rates.
Additionally, the underlying BDCs have floating-rate portfolios. That would mean as rates rise, the income should also rise, which the portfolios are generating. Rising income on the portfolios leads to rising dividends on the BDCs. Rising BDC dividends mean rising NII for FGB. So, in that way, the fund is essentially hedged from higher rates more than one might originally think.
Performance – Attractive Discount
Since our last coverage, the fund started making a move higher. This was mostly because the broader market was also moving higher. During September, we saw the fund and the market move sharply lower.
FGB Author Coverage (Seeking Alpha)
That being said, on a YTD basis, FGB has outperformed the S&P 500 as measured by (SPY). On the other hand, it has underperformed the VanEck BDC Income ETF (BIZD). This seems to be related to the leverage the fund uses to push FGB down further. BIZD doesn’t incorporate leverage into its passive strategy. That being said, we can see that BDCs have, for the most part, held up better relative to the broader market.
YCharts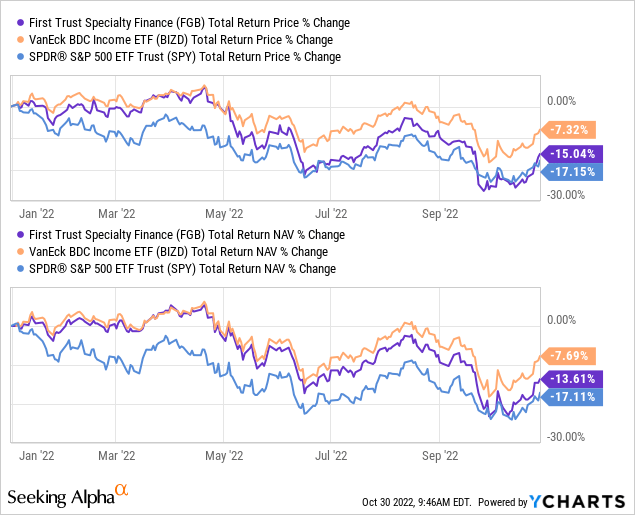
As we noted, leverage is one of the main risks that has truly punished FGB in 2020. We have discussed that previously, but worth noting again. This was largely due to the deleveraging that took place. Since they had to sell investments at lows, they weren’t there when the recovery occurred. As readers probably remember, the COVID crash came swiftly but left just as swiftly.
YCharts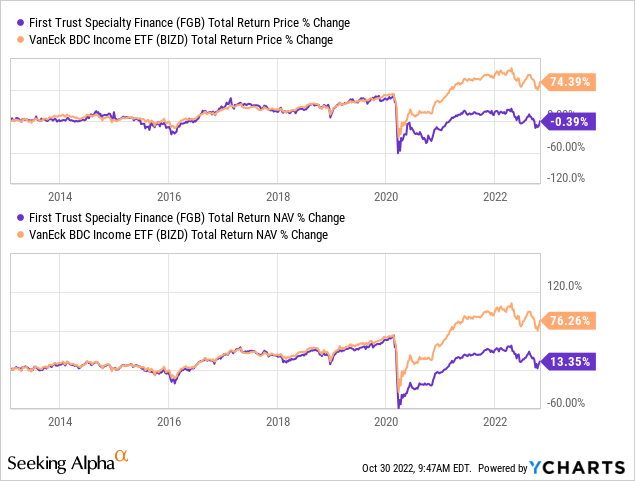
I think this highlights why FGB is a better trading type fund rather than buy-and-hold. At this time, the main selling point is that you can hold FGB at a discount, and BIZD, you can’t buy at a significant discount. Which could end up making it outperform over relatively shorter periods of time. For the most part, FGB and BIZD performed quite similarly prior to 2020.
Historically, this fund has traded at premiums for regular periods of time. It was after a distribution cut in 2020 – following the deleveraging – that the fund was punished, and the discount has been widening further. I believe that could be due to, once again, overall uncertainty in this current environment.
YCharts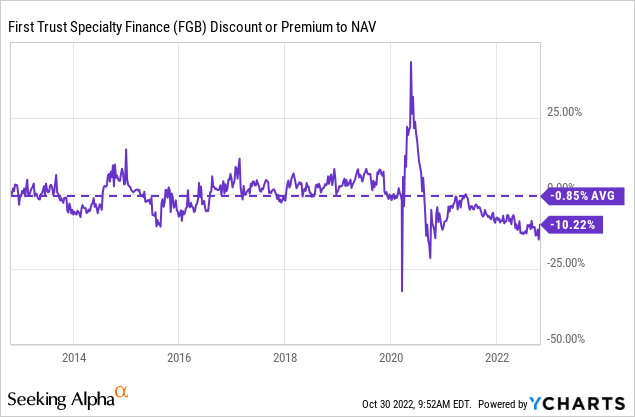
Since our previous update, the fund’s discount did contract a bit. It was over 13% previously.
Distribution – Fully Covered
Here is what I had to say about FGB previously on their distribution:
We will get a new report in a month or so showing the updated earnings (net investment income and gains/losses) for FGB. For now, the previous update is still the latest coverage. That showed that NII coverage was around 80% in the last fiscal year. The next report isn’t likely to have NII increase significantly until BDCs start meaningfully increasing their own distributions. That could come when they start receiving higher earnings from higher rates.
Most notably, my remark is that NII coverage isn’t likely to increase unless BDCs start increasing their distributions. Well, it turns out that’s exactly what their underlying holdings were doing, as distribution coverage has surged with a significant jump in net investment income.
FGB Semi-Annual Report (First Trust)
If we annualized out that last six-month figure, we would see an NII increase of 30.3%! That’s a meaningful jump. That took the six-month NII distribution coverage to nearly 104%.
Not only did BDCs boost their distributions, but significant special payouts have also contributed to this. That’s good and bad. Partially because the coverage of the distribution for FGB could dip again if those specials aren’t paid out again.
Of course, with the portfolio accumulating losses, both realized and unrealized, that could also weaken coverage if they have fewer assets to generate income on. On the other hand, if BDCs continue to raise their dividends, that should offset some of that impact.
Since the fund has demonstrated historically that it will pay out the same distribution even if it isn’t covered, it would suggest that the current payout is quite secure.
That makes the current discount even more attractive as it pushes the distribution yield to 10.28%. At the same time, the NAV rate is a bit more moderate at 9.22%. That’s the amount that the fund has to earn to cover its distribution.
FGB Distribution History (CEFConnect)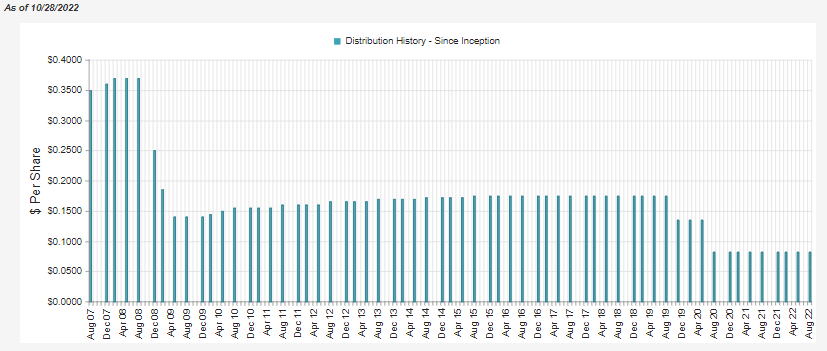
There are a lot of moving parts and “ifs” in this fund. Again, that highlights why this is a better fund to trade around than potentially trying to buy-and-hold this name.
FGB’s Portfolio Raising Dividends
FGB’s portfolio is fairly predictable in that they regularly hold a significant weighting to BDCs.
FGB Asset Allocation (First Trust)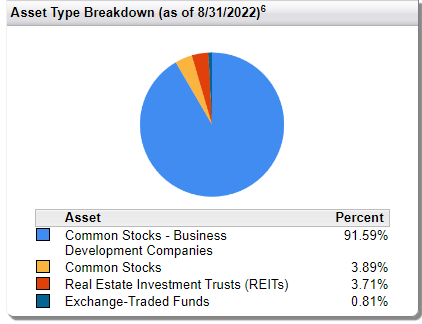
The latest top ten they show was at the end of August 2022. However, these are also pretty predictable because the fund’s turnover isn’t very elevated. In the last six months, turnover was reported at 4%. In the prior fiscal year, it was 8%. 2020 showed the highest turnover of the last five and a half years at 20%.
FGB Top Ten (First Trust)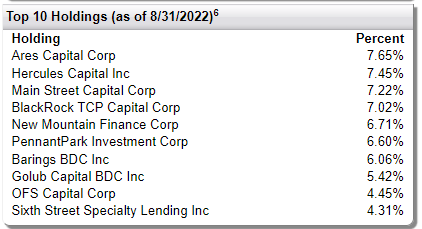
That being said, here is what we see regarding the dividends these BDCs are paying.
We will start with Ares Capital Corp. (ARCC), FGB’s largest position and seen as one of the best BDCs out there. What we can see is that ARCC delivered, too, keeping up with its reputation.
First, we see that the regular dividend was boosted, and then they paid out several specials too.
ARCC Dividend History (Ares Capital)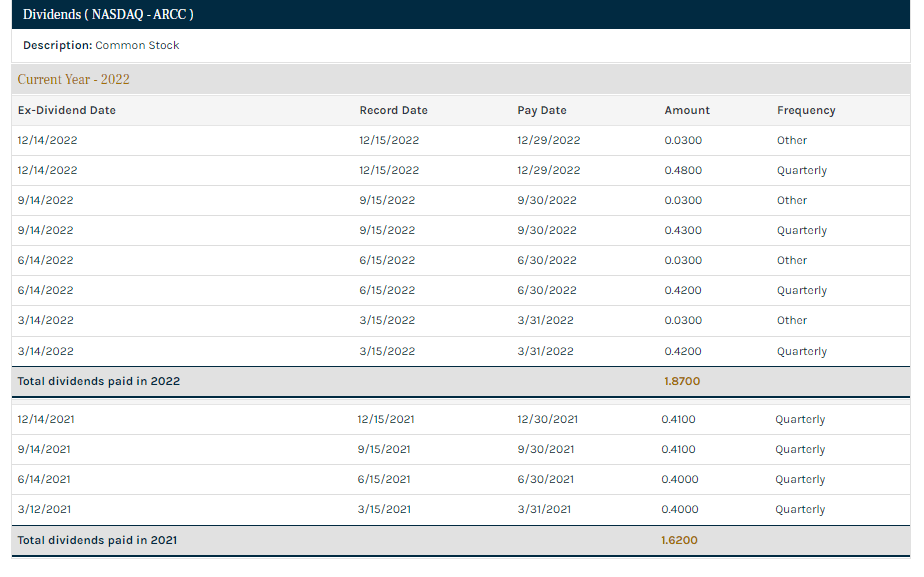
For FGB’s latest report, we are really looking between 11/30/2021 and 05/31/2022 – as that was the reporting period. What we can see for ARCC above is that they’ve continued along with raising their regular and specials too. That bodes well for FGB’s income potential in the future.
Another BDC that is seen as one of the best is Hercules Capital (HTGC). We see with this name that they, too, paid specials and raised their regular. They continued to do so after the reporting period for FGB too.
HTGC Dividend History (Hercules Capital)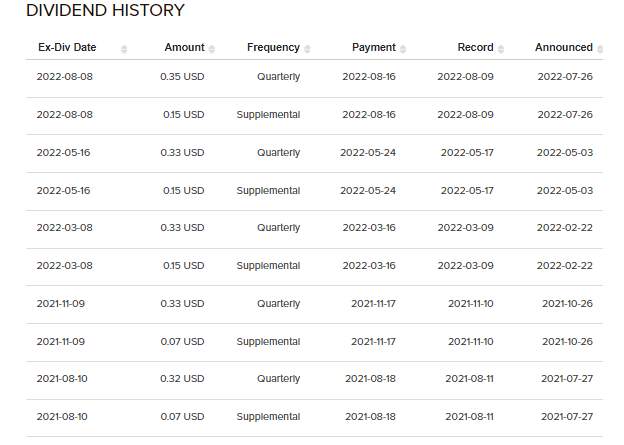
Main Street Capital (MAIN) is another top BDC that has shown consistency over the years. In fact, they are one of the only BDCs to make it through 2008/09 without any dividend cut. Similarly to ARCC and HTGC, they gave shareholders a boost for the regular dividend. They also started paying out several specials too.
Main Street Capital Dividend History (Seeking Alpha)
However, these weren’t the only BDCs in the top holdings for FGB that have been working. There were another five names that raised their regular dividends too. That includes PennantPark Investment (PNNT), Barings BDC (BBDC), Golub Capital (GBDC), OFS Capital (OFS), and Sixth Street Specialty Lending (TSLX). TSLX’s raise was only recently, but they had been paying specials in this period too.
YCharts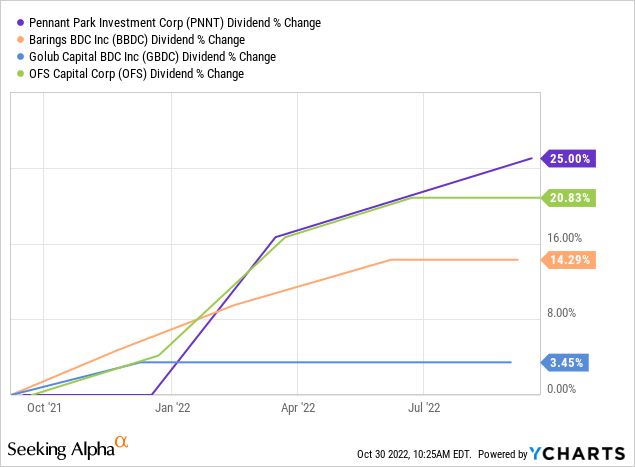
Here is a look at the dividend history for TSLX. I left that name out of the chart above due to the specials causing unusual spikes.
TSLX Dividend History (Seeking Alpha)
That leaves only BlackRock TCP Capital (TCPC) and New Mountain Finance (NMFC) that didn’t raise their payouts that are included in FGB’s top ten.
Conclusion
FGB’s portfolio is benefiting from rising payouts in its underlying holdings. Higher interest rates from the Fed fuel these rising payouts. To put it simply, BDCs generally underwrite floating loans, using a considerable amount of fixed-rate financing to accomplish that. That is what leads to higher payouts during rising interest rate environments. Additionally, they’ve been paying out specials quite regularly.
That all helps FGB, despite its own mild amount of leverage that is based on a variable rate. In the end, FGB is attractive due primarily to its discount. If that closes, we would simply sell out of the position and move on. While waiting for that to happen, it is encouraging to see its distribution well covered – which should help support the fund’s trading level. Investing in BIZD or directly into individual BDCs could be a preferable long-term holding strategy.
Be the first to comment