

KenCanning
The Innovator IBD 50 ETF (NYSEARCA:FFTY) is a passively managed index-based high-turnover investment vehicle I attempt to cover at least quarterly.
In my previous note in November, I provided an overview of a few integral faults of this investment vehicle, highlighting its inability to benefit from the prevailing market forces despite a high-conviction fundamentals-driven strategy, as well as excessive turnover that did not translate into consistent above-market returns, though I still acknowledged that its equity basket had appealing valuation back then. Similar conclusions were presented in the August article.
Since then, FFTY’s performance has been fairly lackluster, as it has lost about 5.2% while the bellwether 500 index has advanced by 4% buoyed by the hopes that the Fed would return to accommodative policy already by the end of 2023.
Seeking Alpha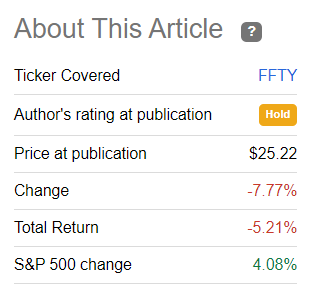
Since the August article, it has declined by a horrible 16.3% while the S&P 500 has been flat.
Seeking Alpha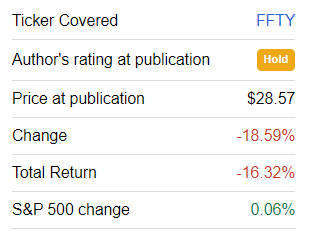
Overall, FFTY had a merely catastrophic 2022, the worst year since its inception in 2015 dwarfing even 2018 when it slipped by 16.8%. More specifically, it fell by 52.4%, underperforming both the iShares Core S&P 500 ETF (IVV) and Invesco QQQ ETF (QQQ) by 34.2% and 19.8%, respectively.
Despite being quasi-actively managed (as I prefer to put it as its underlying index is rebalanced weekly), the ETF failed to profit from the higher inflation and higher interest rates regime despite plentiful opportunities to do so, even though it was overweight energy, the key inflation beneficiary, as of the previous note.
And though it had a relatively upbeat start to 2023, owing to last year’s horrific performance, its compound annual growth rate over the May 2015 – January 2023 period (it was incepted on 8 April 2015) turned negative as illustrated below. As a reminder, the CAGR over the May 2015 – October 2022 period was 1.36% vs. IVV’s 10.63%.
| Portfolio | FFTY | IVV | QQQ |
| Initial Balance | $10,000 | $10,000 | $10,000 |
| Final Balance | $9,805 | $22,562 | $29,141 |
| CAGR | -0.25% | 11.07% | 14.80% |
| Stdev | 22.80% | 16.12% | 19.48% |
| Best Year | 37.63% | 31.25% | 48.40% |
| Worst Year | -52.40% | -18.16% | -32.58% |
| Max. Drawdown | -56.57% | -23.93% | -32.58% |
| Sharpe Ratio | 0.06 | 0.67 | 0.76 |
| Sortino Ratio | 0.08 | 1.02 | 1.21 |
| Market Correlation | 0.83 | 1 | 0.92 |
Created using data from Portfolio Visualizer
Obviously, its F Seeking Alpha Quant Momentum Grade is hardly coincidental, with the only bright spot being its one-month return.
Seeking Alpha
A quick investment strategy recap
As a refresher, FFTY’s strategy is based on the IBD 50 Index, which itself relies on the principles of the CAN SLIM Investing System. The sophisticated model amalgamates fundamental and technical data, paying due attention to eleven factors including EPS, relative price strength, sales margin, return on equity, industry group relative strength rating, etc., in order to select the 50 most promising names from around the 7,000-strong universe, with ADRs also eligible. More details can be found in the respective documents on its website.
Overview of portfolio changes, Energy falling out of favor
What is inside FFTY at the moment? Before delving into that, let me quickly remind you that making reservations about its performance this year based on the current composition and its factor exposure would be preposterous, as the portfolio might be rebuilt entirely in the blink of an eye upon the next weekly reconstitution.
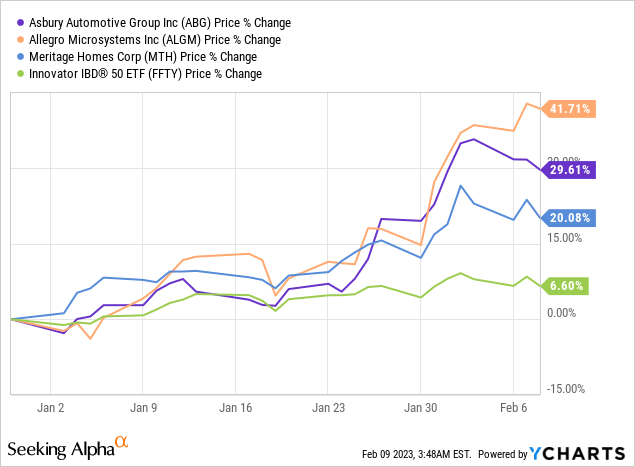
As of February 6, the 50-strong FFTY portfolio bears only a few resemblances to the basket I discussed in the previous note, with stocks from the November version accounting for less than 23% of the net assets. The additions worth mentioning are Allegro MicroSystems (ALGM), a semiconductor company, Asbury Automotive Group (ABG), an automotive retailer, and Meritage Homes (MTH), a homebuilder, all with the weights of around 3.6%. The trio has exemplary quality characteristics manifested in the Profitability grades of A-, B+, and A-, respectively. All of these names started 2023 on a high note, delivering spectacular double-digit returns, with expectations for lower rates in the near future likely being the principal tailwind owing to their business models being closely connected to the economic cycle.
Amongst the notable deletions are Super Micro Computer (SMCI), a manufacturer of high-performance server and storage solutions, ConocoPhillips (COP), an oil and gas exploration and production heavyweight focused on the Lower 48, and EOG Resources (EOG), another petroleum name; weights ranged from 3.63% to 3.48%.
I would like to pay special attention to the latter two. In essence, the fund has not simply rotated out of COP and EOG on account of the deterioration of fundamentals or due to any other meaningful reason, the changes to the portfolio were much more profound. FFTY fell out of favor with the energy sector that accounted for about 56% almost completely, cutting its weight to just around 9%. At the same time, it cranked up bets on IT, with this sector now sporting a close to 32% weight vs. only 9.7% as of the previous article. The consumer discretionary sector also enjoyed a boost, with the allocation ballooning from 5.8% to ~24%.
An important remark is that consumer staples, real estate, and utilities are ignored by FFTY at least for now. In the November version, it held only one consumer staple stock, Performance Food Group Company (PFGC), while communications now represented by Perion Network (PERI) and Nexstar Media Group (NXST) were absent. That is to say, the fund still has exposure to only eight sectors out of eleven in the GICS.
Did all of this result in profound factor exposure changes? Completely true.
First, the weighted-average market capitalization declined to around $26.5 billion from almost $40 billion previously, with the earnings yield now standing at approximately 9.3% vs. almost 11% in November. Unsurprisingly, the share of stocks with a B- Seeking Alpha Quant Valuation rating and higher fell to around 23% vs. 39.5% previously. The silver lining is that high-quality stocks (no less than a B- Profitability grade) now account for 80.4% of the portfolio vs. only ~69% in November.
Final thoughts
Does FFTY deserve an upgrade at this time? I doubt that.
Its sophisticated strategy looks solid at first blush as it pays due attention to the major drivers of returns, namely growth, quality, and momentum. Unfortunately, this approach only secured one alpha year, namely 2017, with the rest being utterly lackluster.
So the essential issue is that FFTY’s fees are still burdensome at 80 bps, while returns are lagging. This is hardly an appealing combination.
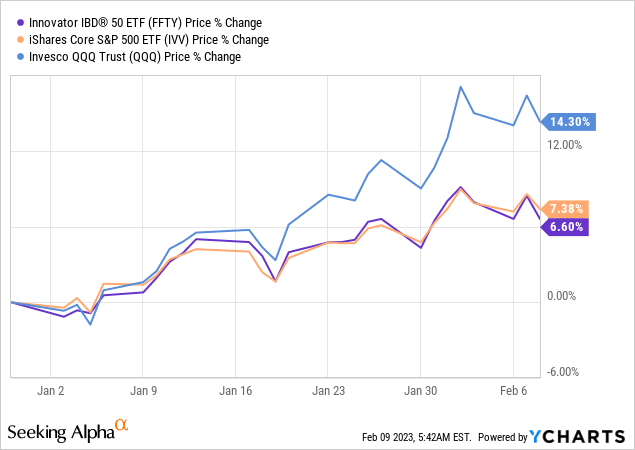
Last year, its performance was merely harrowing. Even in 2023 to date, amid the fading inflation narrative-driven rally that supercharged gains of the 2022 laggards like the ARK Innovation ETF (ARKK), FFTY has underperformed IVV (marginally), let alone the tech-heavy QQQ.
I should reiterate that the fund is frequently late to the party, adding seemingly top stocks at the wrong point when they have already peaked or are about to peak and then edge lower. The example of its massive increase in energy sector exposure last year after the oil price rally had already sputtered is telling.
Importantly, constructing a bullish thesis on the basis of factor exposure (some investors might find its earnings yield justly appealing, especially considering it goes with close to 28% weighted-average forward EPS growth rate, as per my calculations) is hardly possible at this point, as it is fluid because of the weekly reconstitutions.
Editor’s Note: This article covers one or more microcap stocks. Please be aware of the risks associated with these stocks.
Be the first to comment