


sasacvetkovic33
The Fidelity MSCI Energy ETF (NYSEARCA:FENY) has dramatically out-performed the broad market averages this year and is up 83% (96% including dividends) since my Seeking Alpha BUY rated article in February of last year (see FENY: A Reopening Thesis). While it may be tempting to take profits after such a strong run, investors would be well-advised to hold onto the position given the rather bullish back-drop as a result of Putin’s war-of-choice in Ukraine and the decision by OPEC+ last week to keep more supply off the market. In addition, investors can expect another round of strong quarterly reports during the Q3 reporting season. That is especially the case given Exxon Mobil’s (XOM) 8-k filing last week that suggested Q3 profits could come in around $11 billion. Exxon is the #1 holding in the FENY ETF with a 21.6% stake.
Investment Thesis
The investment thesis for owning a position in O&G stocks is relatively straight-forward. As you all know, Putin’s horrific war-of-choice in Ukraine, and the subsequent sanctions placed on Russia by the United States and its Democratic & NATO allies, has effectively broken the global energy supply chain (for both oil and natural gas). That, combined with the decision by OPEC+ last week to cut production by 2 million bpd (in reality, perhaps only ~900,000 bpd considering some OPEC producers were already producing below their quota), has caused the price of oil to rise ~$13/bbl just since the start of October:

MarketWatch
In the big-picture, Russia, Saudi Arabia, and OPEC+ in general used to consider a $60-$70/bbl price for Brent as “reasonable”. Now, OPEC+ is… along with the disciplined U.S. E&P Sector… defending $85-$95/bbl. That is more than 2x the breakeven price for most shale oil producers, which is typically under $40/bbl WTI, and means these companies are going to continue to generate very huge FCF and, subsequently, strong dividends for their investors.
Yet despite that very strong fundamental price backdrop, the entire energy sector still only equates to 5.2% of the S&P500 while Apple (AAPL) alone is 7.2% of the index.
So let’s take a look at how the FENY ETF has positioned investors for success going forward.
Top-10 Holdings
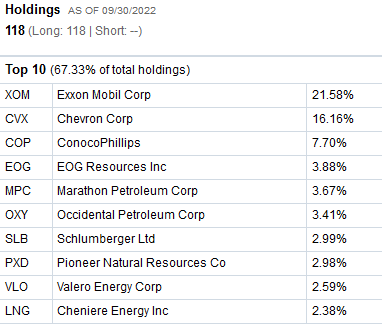
The top-10 holdings in the FENY ETF are shown below and equate to what I consider to be a very concentrated 67.3% of the entire 118 company portfolio:
Fidelity Investments
Source: Fidelity FENY ETF Homepage
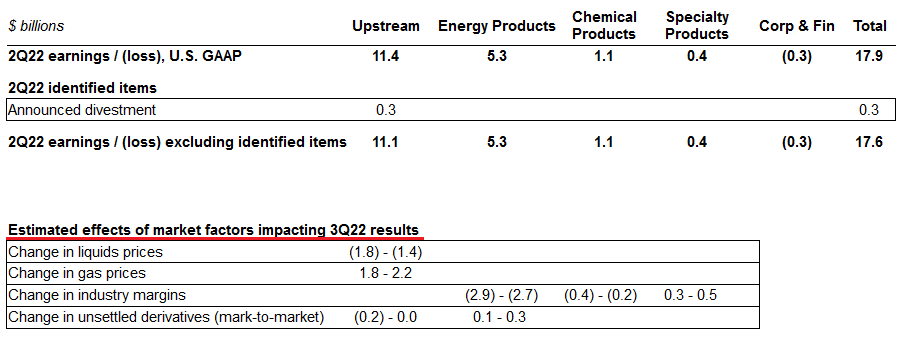
As mentioned earlier, Exxon is the #1 holding with a 21.6% weight and filed its pre-Q3 8-K last week:
Exxon
Source: Exxon 8-K Filing
The snippet above that was taken from that 8-K filing and the Q2 results are shown on top while the estimated effects of market factors that will impact Q3 results are shown in the chart below the Q2 results (indicated by the red-line). Note that liquids pricing will be a drag on Q3 results (-$1.6 billion at the mid-point) as compared to Q2 when the price of oil was higher. However, that decrease will be wiped out by the positive impact of natural gas prices (+$2 billion at the mid-point). Industry margins for energy products (i.e. gasoline, diesel, jet-fuel, etc) were lower as were chemical margins. Specialty products margins were higher. Altogether, and taking into account other factors (corporate, maintenance schedules, etc.), analysts estimate Exxon’s earnings could come in at ~$11 billion. While that is shy of the record $17.9 billion profit delivered in Q2, it was better than the market expected and – combined with the OPEC supply cut – Exxon stock rallied over $10/share last week:
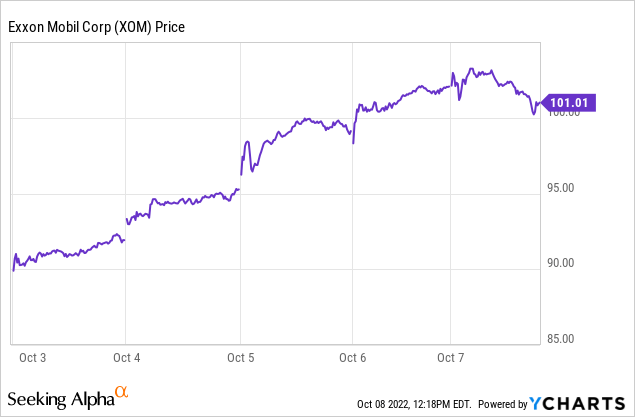
Exxon currently trades with a forward P/E of only 7.9x and yields 3.5%.
The #2 holding with a 16.2% weight, Chevron (CVX), was up 6.8% last week and is generally impacted by the same type of margin and pricing that Exxon reported in the 8-K filing (although to the same degree as CVX’s production and downstream profiles are quite different than that of Exxon’s). That is, both companies are integrated international oil companies with upstream, downstream, and chemicals operations. Chevron is expected to earn ~$17/share this year and closed Friday at $160.03/share. That implies Chevron has a forward P/E of only 9.4x. Meantime, CVX pays a $5.68/share annual dividend and currently yields 3.5%.
The FENY ETF is also well-positioned in companies that are big U.S. shale producers: ConocoPhillips (COP), EOG Resources (EOG), and Pioneer Natural Resources (PXD), in aggregate, account for 14.6% of the portfolio. Each of these shale producers have instituted a (base + variable) dividend policy and are returning strong quarterly dividends for investors. However, I want to alert investors to the fact that most popular finance websites (including Seeking Alpha) are having trouble accurately reporting such a dividend structure and are typically reporting yields that are well below actual returns because they frequently report only the base dividend. That being the case, investors are encouraged to go directly to the company’s website to find the latest variable dividend announcements.
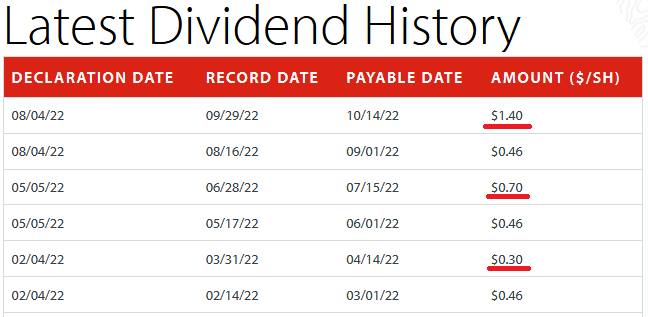
For instance, SA currently reports COP’s dividend and yield as $1.84/share and 1.6%. However, from COP’s dividend webpage we can see all the dividend declaration so far this year:
ConocoPhillips
Note that in addition to the $0.46/share quarterly base dividend, COP has also declared variable dividends (underlined in red) of $2.40/share over the first three quarters of the year. Therefore, the total dividend payments this year, even assuming no more variable dividend (yet there will be more given the high price environment), will be (base+variable) or ($1.84+$2.40) = $4.24/share. That being the case, COP’s real yield should be reported closer to 3.6%. However, I would expect another variable dividend declaration of ~$1.00 in November, so the actual yield is likely ~4.4%.
The case for variable dividends is even stronger for EOG and PXD considering both of these companies prioritize dividends while COP is still over-emphasizing stock buybacks over dividends. Indeed, Pioneer Resources’ total dividends for the first three quarter of 2022 is a whopping $19.73/share.
The #9 holding is the largest U.S. refiner – Valero (VLO) – with a 2.6% weight. VLO stock is up 50% over the past year and yields 3.7%.
Cheniere Energy (LNG), the United States’ largest LNG exporter, is greatly benefiting from demand pull from the EU and significantly higher margin given the natural gas crisis brought on by Putin cutting off supply to Europe. LNG stock is up 74% over the past year.
Performance
The YTD total return performance of the FENY as compared to competitors the Vanguard Energy ETF (VGELX), the S&P SPDR O&G E&P ETF (XOP), the Energy Select SPDR ETF (XLE), and the broad S&P500 as represented by the (SPY) ETF is shown below:
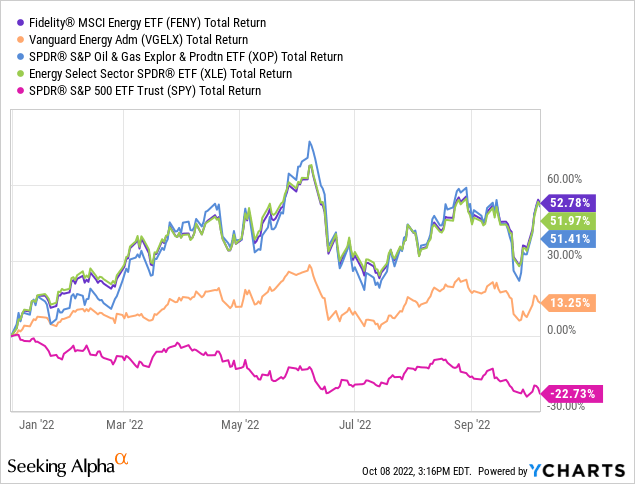
As can be seen from the graphic, the FENY ETF leads the pack, has significantly outperformed its Vanguard peer, and has absolutely clobbered the returns of the S&P500 during the 2022 bear-market.
However, investors should not ignore the fact that the energy sector was a terrible laggard for a decade, and that Exxon stock just recently climbed above where it was 10-years ago. That being the case, FENY’s longer term 3-year and 5-year performance isn’t much to crow about despite its strong out-performance this year:
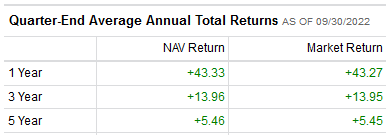
Fidelity
Risks
The primary risk is that O&G prices fall as a result of a large drop in demand. That could happen given large headwinds facing the global economy: high inflation, higher interest rates, covid-19 shut-downs in China, and OPEC+ holding even more supply off the market. That could lead to a severe global recession and a large drop in oil and gas demand.
Note that Exxon & Chevron equate to 37.7% of the entire portfolio. That being the case, investors that already have full positions in either of these two companies may want to look for another diversified ETF. On the other hand, investors that don’t have a position in either company but are bullish on the future, the FENY might be a perfect fit for your portfolio.
Upside catalysts include US producers refusing to produce up to their potential (the rig count declined by three last week despite strong oil prices), a potential rebound in demand from China, and more action by OPEC+ to inflict damage on the US, EU, and emerging market economies by cutting production and raising oil prices even higher.
The EV clean-energy transition poses a threat to long-term demand for oil and gasoline. Indeed, that is likely one reason why dictator-led Russia and Saudi Arabia are waging war, raising prices, and withholding supply from the global market prior to the US mid-term elections. They likely want to see the pro clean-energy Biden administration replaced by the prior fossil-fuel friendly “make coal great again” republican regime. China would also love-it if the republicans came back into power and rolled-back the Democrats’ push for clean-energy, EVs, and a more renewable based grid. After all, China wants to dominate the clean-energy supply-chains the world demands (and, of course, the good manufacturing jobs they provide). That being the case, the Biden administration’s (and the EU’s …) clean-energy agenda is clearly a threat to autocratic nations like China, Russia, and Saudi Arabia.
Summary & Conclusion
While investors may want to take some profits given the huge surge in oil & gas stocks, it is way too early to exit the sector in my opinion. We have a strong set-up going into winter, with OPEC+ apparently defending $85-$95/bbl Brent – more than 2x shale oil producers breakeven point of under $40/bbl WTI. And while the energy sector’s overall Q3 EPS results will likely come in below the record Q2 results, they will still be very strong. Meantime, higher free-cash-flow means more dividend income is flowing directly to investors from the shale producers’ (base+variable) dividend policies while he two big U.S. international integrated companies – Exxon & Chevron – will continue to deliver strong earnings and free-cash-flow. That should enable both companies to have strong dividend increases and to buyback a significant amount of stock.
With an attractive expense ratio of only 0.08%, FENY is a BUY for both income (currently a 3.73% yield) and capital appreciation.
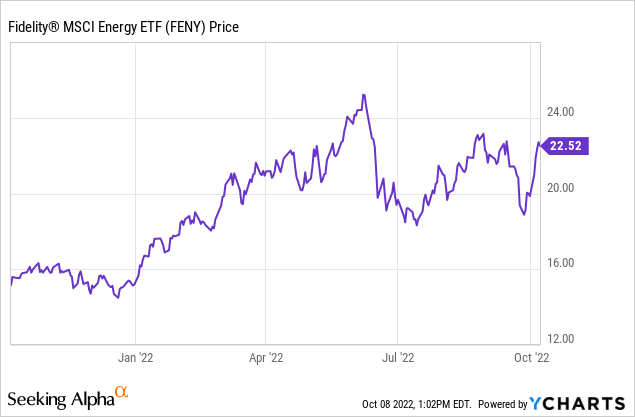
I’ll end with a 5-year price chart of FENY and note that – despite the rally last week – it is still significantly below its May peek:
Be the first to comment