

ThitareeSarmkasat
Last week I said that the expansion should continue and market prices should stabilize provided the Fed does not overreact to inflation today in the same manner that it underreacted 18 months ago. The Fed raised short-term rates by 75 basis points to 3% at last week’s meeting, as expected, but its updated projections for the Fed funds rate rose markedly, which is why the S&P 500 retested its June low, as both short- and long-term interest rates set new highs for the year. The Fed seems intent on meeting market expectations with its rate outlook, which called for a Fed funds rate as high as 4.5% in 2023 before its meeting, so as to not lose control of inflation expectations, which it has managed to bring close to target. Yet, if it follows through on its latest projections, it runs the risk of being as wrong in its restrictive policy to rein in inflation this year as it was in its overly loose policy during the surge in prices last year. Two wrongs don’t make a right, and this will not help it gain back the credibility it has lost.
Edward Jones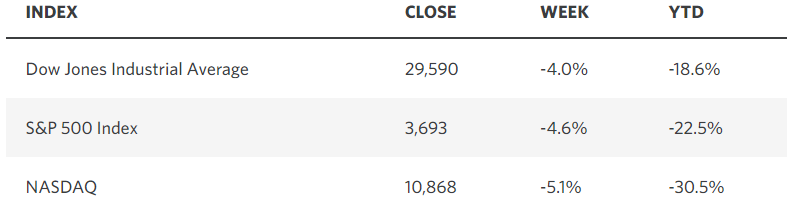
Yet it is important to remember that the Fed’s forecasts for monetary policy are as horrible as its forecasts for inflation. Consider that one year ago its members expected the Fed funds rate to be just 0.3% today, while the rate of inflation was expected to be just 2.2%, as can be seen in its Summary of Economic Projections from last September. Therefore, how can we take today’s forecast for a Fed funds rate of 4.6% and a rate of inflation of 2.8% in 2023 seriously? Regardless, this is fueling recession fears, driving market rates higher, and weighing on the valuations of risk assets. I gave Chairman Powell too much credit last week in believing that he would acknowledge the progress made in slowing economic activity and identifying the decline in leading indicators that should bring prices down more rapidly next year. Perhaps he was afraid of igniting animal spirits and fueling a resurgence in risk asset prices. I still think the Fed funds rate will fall short of expectations for year end, which should be a catalyst for a fourth-quarter rebound in stocks that picks up after the midterm election.
Federal Reserve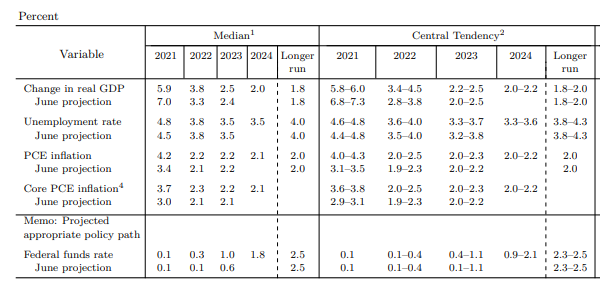
Investors fear higher interest rates, an elevated level of inflation, tighter monetary policy, and now most acutely the risk of recession, which would bring an end to corporate profit growth. That is what the stock market, as a discounting mechanism, has been gradually pricing in all year long. Yet the bond market has already priced in the worst-case scenario for monetary policy, while the rate of inflation has already peaked, and its decline should become more rapid in the coming months. If incoming data lowers expectations for rate hikes during the fourth quarter, as I expect, we will hit the peak in the Fed funds rate before year end. The stock market has done exceptionally well in the 12-month period following the last rate hike.
Edward Jones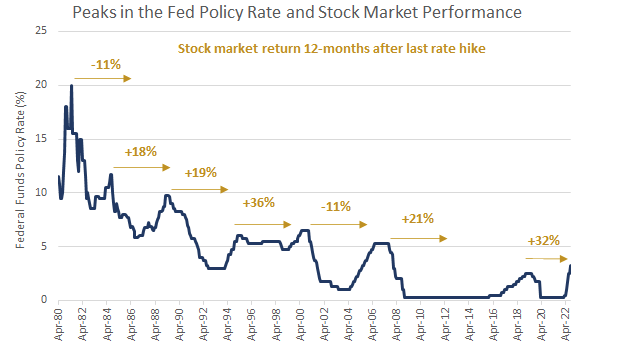
Furthermore, I still see a relatively low risk of recession, as the most reliable bond market indicator for a pending economic contraction is still not flashing red. In fact, the yield curve between the 3-month and 10-year Treasury steepened last week. Note the last inversion that took place during the summer of 2019, which was approximately nine months in advance of the 2020 recession.
Stockcharts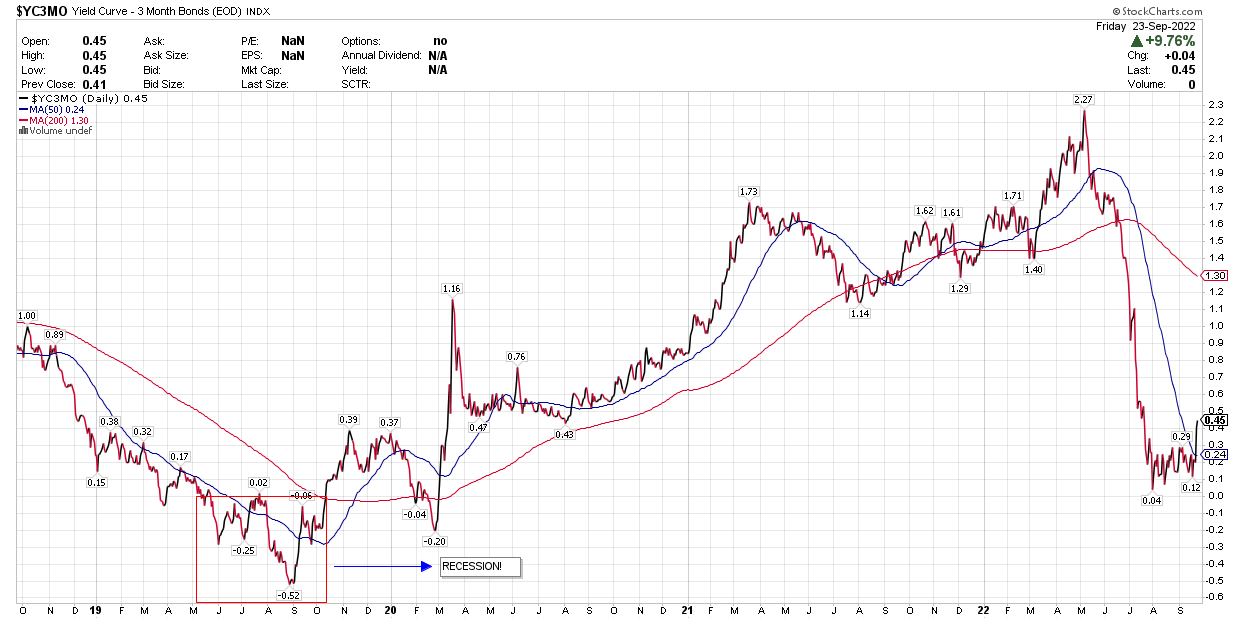
If we go back further, you can see in the chart below that the 3-month/10-year yield curve inverted well in advance of the past five recession, but it has not done so today. I will continue to focus on what the Fed does rather than what is says it may do. I seriously doubt we see a 4.5% Fed funds rate, as the consensus now expects.
St. Louis Fed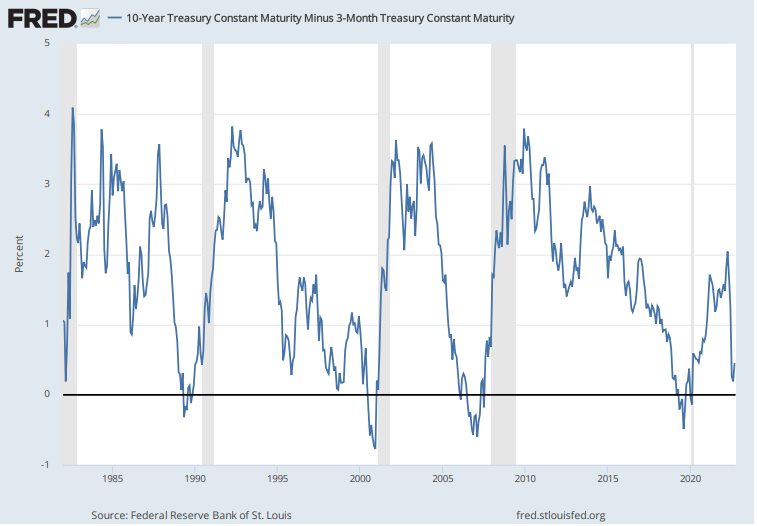
The stock market rallied this summer on expectations that the Fed would be able to lower the inflation rate without forcing a recession. The most recent inflation report, which showed less progress than expected, raised fears that the Fed would have to tighten much more aggressively. Chairman Powell fed those fears with even more hawkish rhetoric and a higher Fed funds rate forecast than anticipated, which now has a recession in 2023 as the base case. This is the reason for the retest of the June low. Whether this test results in a double bottom or we fall to new lows, it still appears that the majority of the downside is behind us. The average bear market since WWII has lasted 11 months, and we are already nine months into this one. I will not sell high-quality, income-oriented, value stocks today in hopes of buying them back at lower prices in a month or two. The average stock has fallen much more and is current far less expensive than the S&P 500, due to the outsized weightings of the most expensive technology names.
Goldman Sachs had a target of 5,100 for the S&P 500 at the beginning of this year, which is lowered to 4,700 in March and lowered again to 4,300 in May. On Friday, it took that target down to 3,600 to account for a peak Fed funds rate of 4.6%, according to the Fed’s updated projections. It said the current interest rate environment supports a lower P/E multiple of 15x next year’s earnings of $240. While estimates for next year’s earnings are likely to fall, so are interest rates as growth slows. That further suggests we are near the end and not the beginning of this bear market.
The contrarian indicators pointing to better days ahead continue to mount. I have already pointed out that both consumer and investor sentiment are at abysmal levels not seen since the Great Recession in 2009. Institutional investor positioning has also not been this bearish since the financial crisis of 2008-2009. Leuthold Group Chief Investment Strategist James Paulsen added another one to the list with the “Dr. Copper and Fearful Gold” indicator, which measures the ratio of copper prices to gold prices to gauge investor sentiment. The ratio of the two prices has fallen to its 13th percentile. When this indicator has fallen below the 25th percentile, the stock market has had a stellar return on average in the month that followed. I’m not sure what may trigger a rally in the month ahead, especially in advance of the midterms, but it is always darkest before the dawn, and I think we can expect to see a much better 2023 than 2022 on all fronts.
Seeking Alpha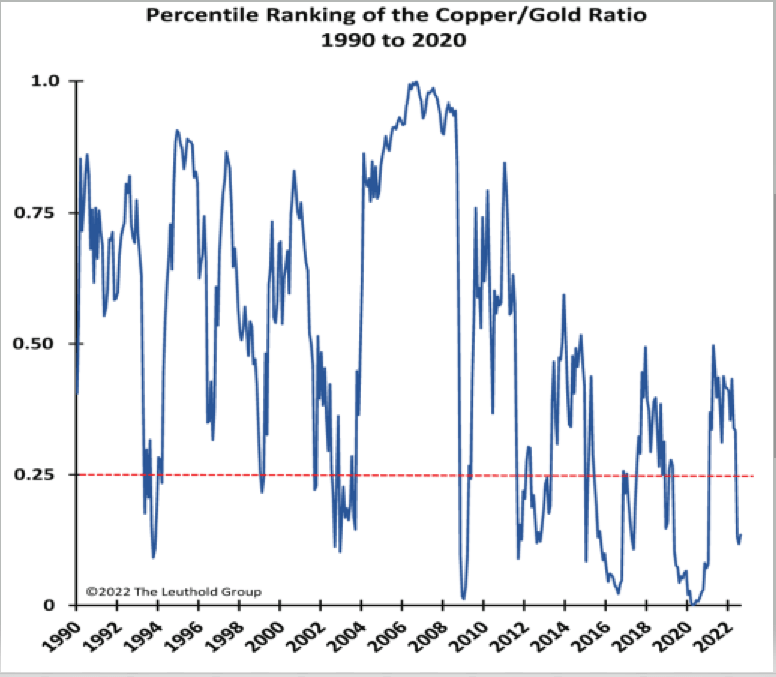
Economic Data
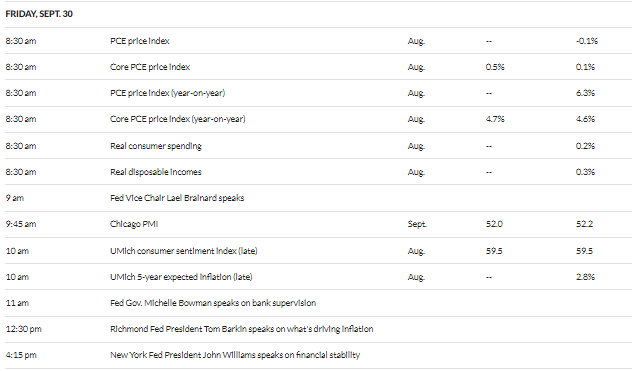
We have a plethora of data this week, as well as a slew of speaking engagements for several Fed governors throughout the week. There will be a number of housing reports, which should show a significant softening in activity and price. Durable goods orders for August and consumer confidence for September will be reported on Tuesday. Friday’s Personal Consumption Expenditures price index for August will be the most important report coming on Friday.
MarketWatch MarketWatch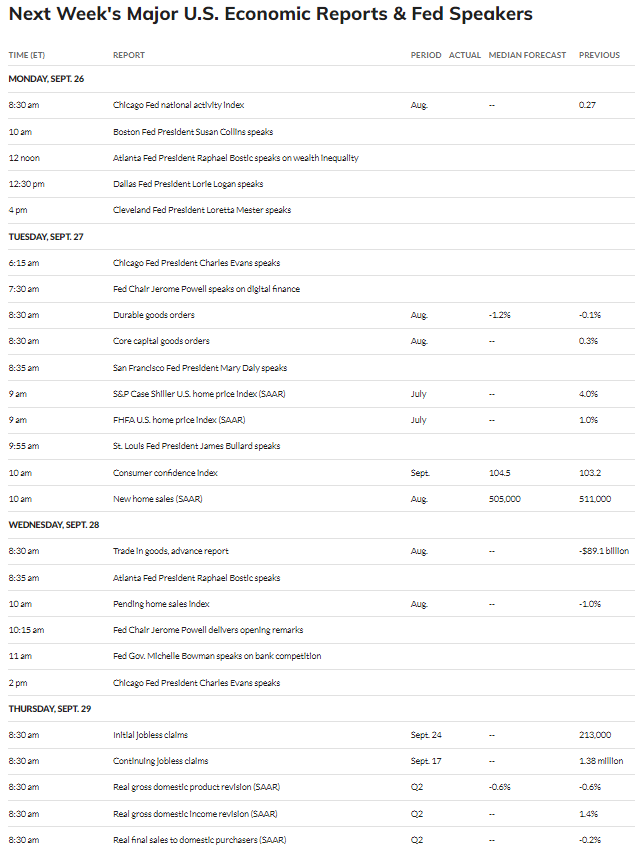
Technical Picture
The S&P 500 closed above its June low on Friday, but this morning’s futures activity indicates we will test it again today. At the same time the Relative Strength Index has fallen below the oversold level of 30 at 28.90. The Volatility Index is also now firmly above 30, which has been a level of fear necessary to find previous market bottoms. I would like to see the June low hold, but as I’ve already explained, a break below does not suggest we have a lot more downside.
Stockcharts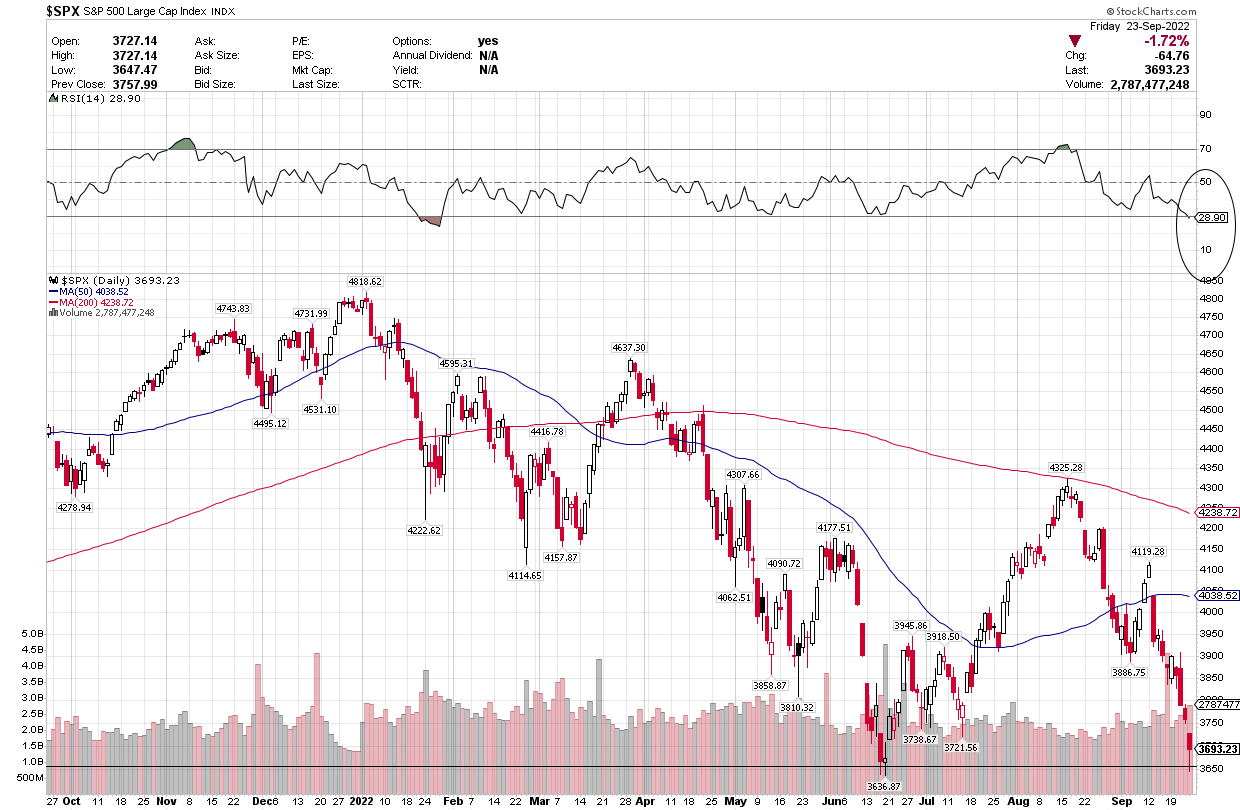
Should we fall below June’s intraday low of 3,636, the next significant level of support comes into play at the 50% retracement level from the bull market that started in March 2020 at 3,505. That’s not a meaningful decline from current levels.
Stockcharts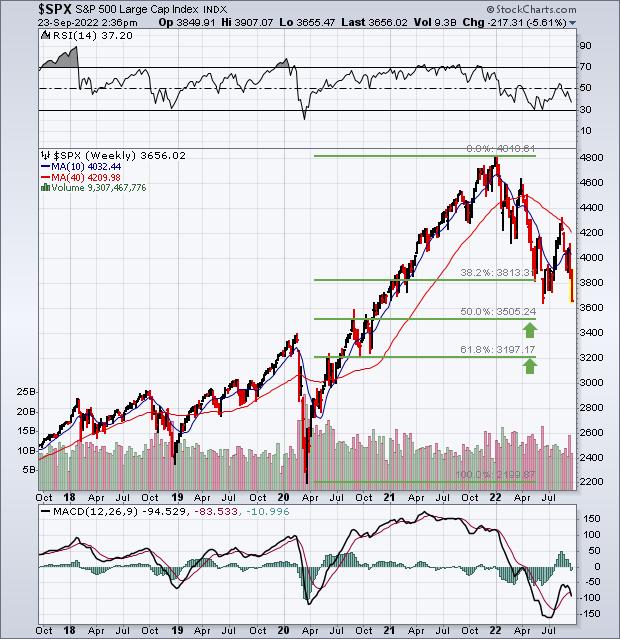
Be the first to comment