

Chip Somodevilla
Market expectations vs the Fed’s guidance
The FOMC is scheduled to meet for the pivotal meeting on Jan 31st/Feb 1st. In this meeting, the Fed is expected to signal an end of the interest rate hiking cycle.
First, let’s look at the Fed’s guidance, based on the Summary of Economic Projections of the last meeting in December 2022, which projects that the Federal Funds rate will be at 5.1% in 2023 and 4.1% in 2024.
The market expects, based on the Federal Funds futures, that the Fed will hike to about 4.9% by June 2023 and then start cutting interest rates by November 2023 down to 3% by the end of 2024.
As the chart below illustrates, the market expectations (blue line) are much more dovish, compared to the Fed’s guidance (orange line).
Global Academic View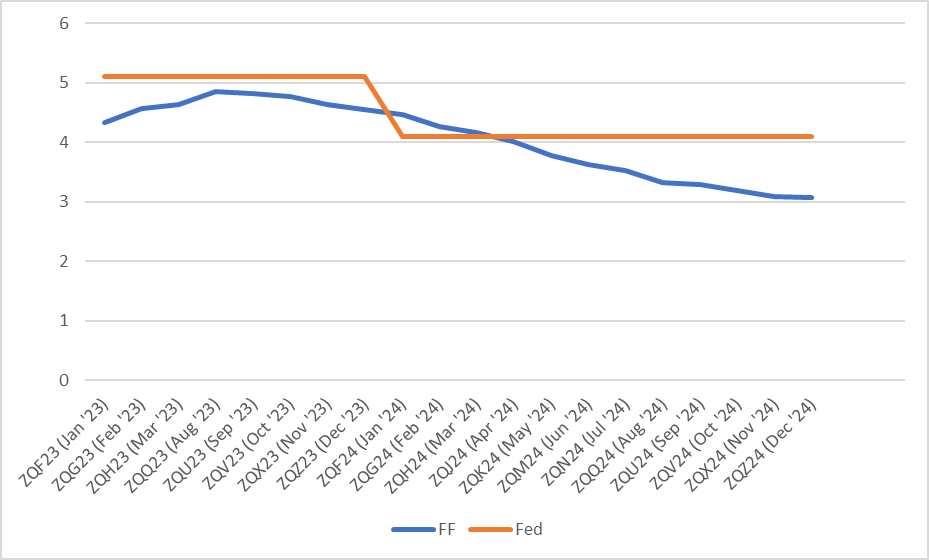
The Fed to signal a pause.
The current effective Federal Funds rate is 4.33%, which implied that, based on the Fed’s guidance, the Fed has another 75bpt to go before the pause. The expectations are that the Fed will hike 25bpt on February 1st, 25bpt on March 22nd, and 25bpt on May 3rd, and keep the rate at 5.1% until the end of 2023.
The market expects, on the other hand, that the Fed will hike 25bpt on February 1st, with another 25bpt on March 22nd, and subsequently cut by 25bpt on November 1st.
Either way, the Fed will have to signal a pause, be it for the March or May.
Let’s look at the Fed’s December 22 meeting statement, and see what change in the language will effectively signal the expected pause:
The Committee anticipates that ongoing increases in the target range will be appropriate in order to attain a stance of monetary policy that is sufficiently restrictive to return inflation to 2 percent over time.
The Fed will have to remove the word “ongoing” from the statement. That will effectively signal that the hiking campaign is coming to an end. The Fed will likely have to replace it with the word that suggests “a few more hikes” to reflect the Fed’s guidance.
If the word “ongoing” is replaced with a word that suggests “one more hike”, the market expectations are correct. So, this is something to pay a close attention to.
The economic data is deteriorating.
The Fed’s statement from the December meeting starts with:
Recent indicators point to modest growth in spending and production.
This statement is likely outdated, as the recent economic data shows an actual decline in spending and production. The Fed will have to acknowledge this deterioration in economic activity.
Consumer spending has decreased by 0.2% in December, after the 0.1% decline in November. More importantly, the downtrend is emerging, possibly suggesting that the hiking policy is starting to affect the consumer spending with lags.
Consumer spending
Consumer Spending (Trading Economics)
Also, the US Industrial production has contracted by 0.7% in December, after contraction of 0.6% in November. More importantly, the downtrend is also emerging, also possibly suggesting that the hiking policy is starting to affect the production with lags.
US Industrial production
Trading Economics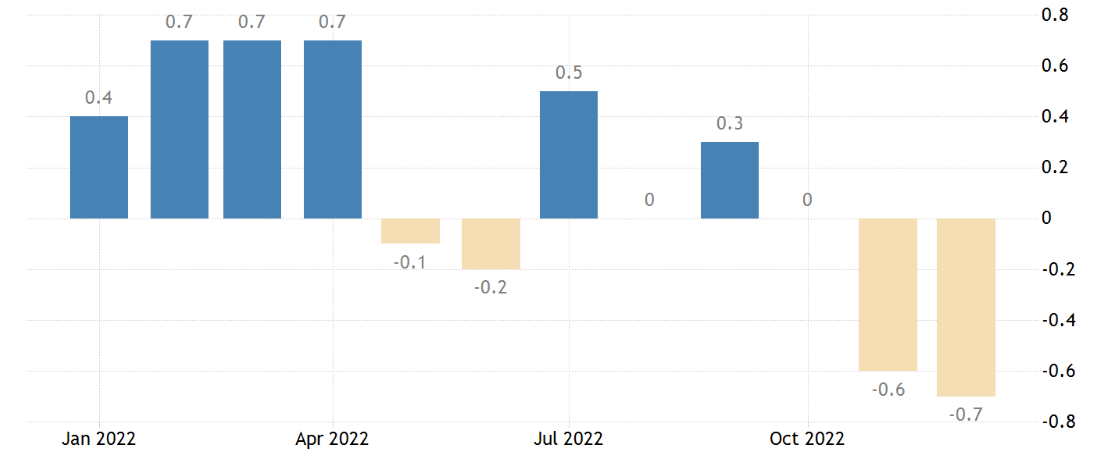
However, the labor market is still strong.
The Fed’s statement from the December meeting also mentions:
Job gains have been robust in recent months, and the unemployment rate has remained low.
This statement is still valid, and likely to stay in the Fed’s statement on February 1st. Specifically, the US economy is still adding over 200K jobs a month, as the nonfarm payrolls show, although the trend is slowing a bit.
Nonfarm payrolls
Trading Economics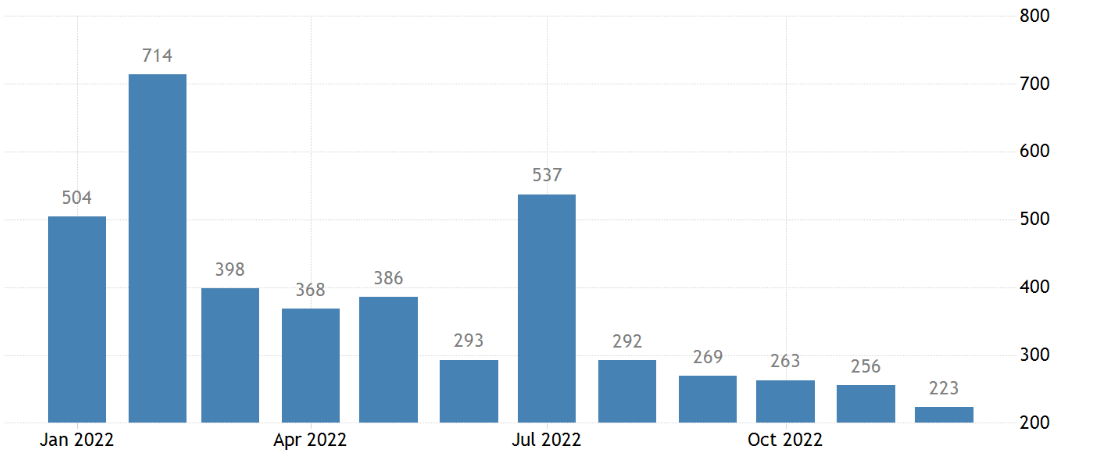
More importantly, the unemployment rate is at the cyclical record low level at 3.5%. This is a problem for the Fed, because the target unemployment rate for 2023 is 4.6%.
Unemployment rate
Trading Economics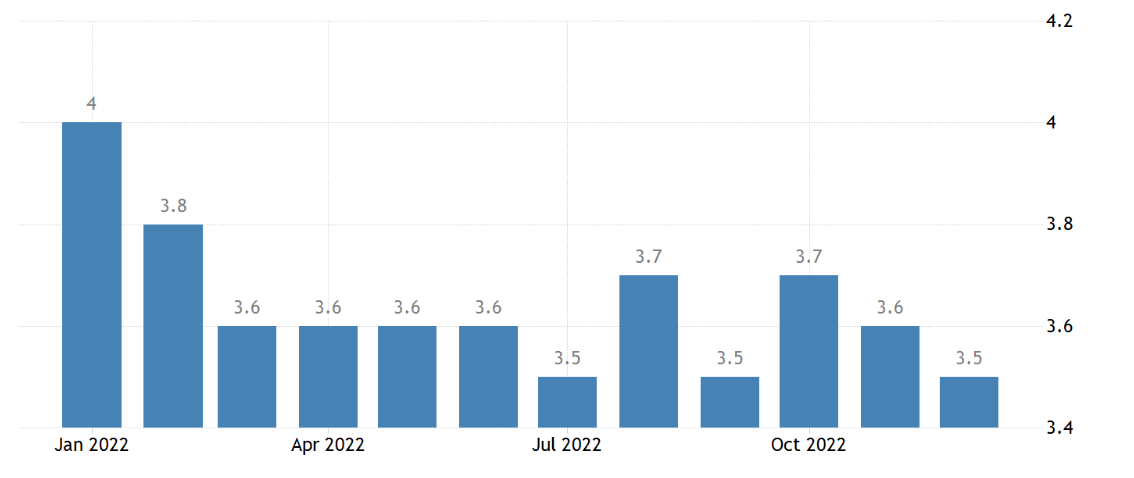
But most importantly, the job openings are still at a very high level, suggesting a major problem with the jobs-worker gap, or the labor shortage. The job openings decreased by about 2 million from the top, but there is still a need for, at least, decrease of another 4-5 million job openings before the job market shortage is resolved.
Job openings
Trading Economics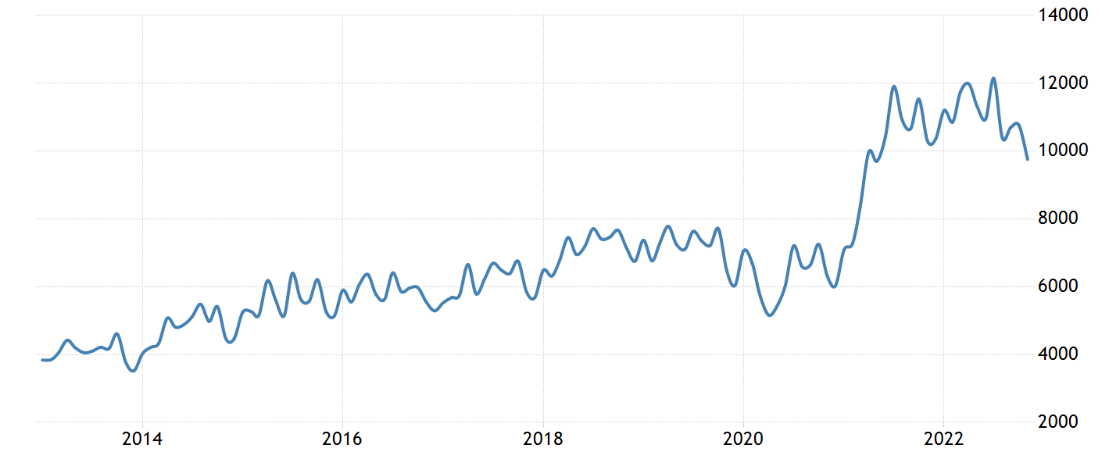
Inflation is still elevated.
The Fed’s statement from the December meeting also mentions:
Inflation remains elevated, reflecting supply and demand imbalances related to the pandemic, higher food and energy prices, and broader price pressures.
This is still a valid statement, and likely to remain in the February statement. The core PCE, which is the Fed’s preferred inflation measure has likely peaked, and it looks like it is down-trending. However, if you look at the historical chart, core PCE at 4.4% is still at a very high level.
Core PCE
Trading Economics
A “hawkish pause” seems appropriate.
The Fed Chair Powell has been clear in his speech at the Brookings Institute on November 30th 2022, that currently the major inflationary concern is the service inflation – primarily due to the risk of wage-price spiral related to the jobs-worker gap.
Thus, given the still strong labor market, the Fed has to remain hawkish. The target for the unemployment rate is 4.6%, which is a long way from the current 3.5%.
However, it appears that the long and variable lags of the prior interest rate hikes are starting to affect the economy. In fact, it is very likely that the economy is possibly already in a recession in Q1 2023. Note, the initial GDPNow estimation for Q1 is 0.7% growth, which is likely to be revised lower as more negative data trickles in.
Thus, it might be appropriate for the Fed to slow from a 50bpt hike to a 25bpt hike in February and signal an end of the hiking campaign. However, the Fed has to remain hawkish due to still strong labor market – meaning signal a “few more hikes” and commit to not cutting the rates in 2023. This is what I define as a “hawkish pause”.
The Fed also needs to remain data dependent – which is this case is the risk of being more hawkish. Specifically, the energy prices are rising, and there are more risks to the upside for inflation than to the downside.
Implication for the stock market
Here is an interesting fact – the effective Federal Funds rate in January 2022 was 0.08% and the PE ratio for Dow Jones Industrial Average (NYSEARCA:DIA) was 20.13, which was overvalued based on historical averages.
Currently, at the end of January 2023, the effective Federal Funds rate is 4.33%, while the PE ratio for Dow Jones Industrial Average is 22.42, which is more than 10% more overvalued than in January of 2022 – after one of the sharpest interest rate increases ever (and DIA was already overvalued in Jan 2022). DIA is down by only 0.5% over the last 12 months.
The stock market as measured by DIA is in an obvious valuation bubble, possibly facing an imminent recession.
Given the bubble dynamics, the initial reaction to the Fed’s pause intentions could reinflate the bubble even further. However, as the recession eventually becomes more obvious, the earnings will likely have to be significantly downgraded, and the valuations will likely significantly contract down to the historical averages at best.
Thus, my rating on DIA remains a sell.
The DIA composition
The ETF that proxies the Dow Jones Industrial Average includes about 21% of the Healthcare stocks, 21% of the Financial stocks, and about 7% of the Consumer defensive stocks. The energy stocks and the basic material stocks account together for about 5% of DIA.
The DJIA Index ETF is also a price-weighted index, meaning the stocks with the highest price have the most influence on the Index price fluctuations. Note, the S&P 500 ETF (SPY) is the market-cap weighted index, meaning the stocks with the highest market capitalization have the highest influence on the index.
The DIA ETF has 31 stocks, and the top 10 stocks (with the highest price) account for about 55% of the index. The UnitedHealth Group (UNH) accounts for about 10% of the index, priced at $485/share, and up by 5% over the last 12 months.
Editor’s Note: This article covers one or more microcap stocks. Please be aware of the risks associated with these stocks.
Be the first to comment