

sefa ozel
From the time the U.S. equity market entered a decline at the start of the year, investors have been increasingly wary of the prospect for an economic recession. Those fears reached a fever pitch in July after GDP contracted for two consecutive quarters, which technically constitutes a “recession” (although few pundits felt the label was accurate at the time). Now a new series of indications point to a legitimate recession on the horizon, with potentially serious implications for investors, as we’ll discuss here.
Stocks have lately been hammered along with bonds as investors rush to the safety of cash. The S&P 500 index is down over 20% and is now testing its lowest level of the year around the 3,650 level. More ominously, other major indexes like the NYSE Composite Index—which is far more representative of the total U.S. stock market—and the Dow Jones Industrial Average have broken down to new lows for the year as of September 23.
Government bonds haven’t fared much better, as falling bond prices have seen yields spike on longer-dated Treasuries. The 10-year Treasury Yield Index (TNX) has risen to its highest level since the credit crisis years of 2008-09. The difference between those years and today is that Treasuries were in far greater demand, with TNX in a declining trend. Now that we’re facing a rising rate environment, the headwinds created by rising rates is likely to cause more damage to equities.
Big Charts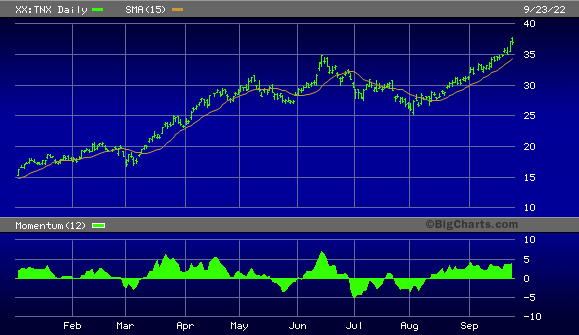
The U.S. dollar index (DXY), meanwhile, shows where investors are fleeing to, namely the safety of cash. While some observers are calling the current situation a classic “liquidity trap,” this isn’t the case, since interest rates are rising and inflation is more of a problem than deflation.
By the same token, those referring to the current situation as a liquidity trap aren’t entirely wrong, since investors are clearly more interested in hoarding cash instead of purchasing higher-yielding bonds. The relentless rise of the dollar index underscores the strong demand for cash at the expense of the stocks and bonds now being liquidated.
Big Charts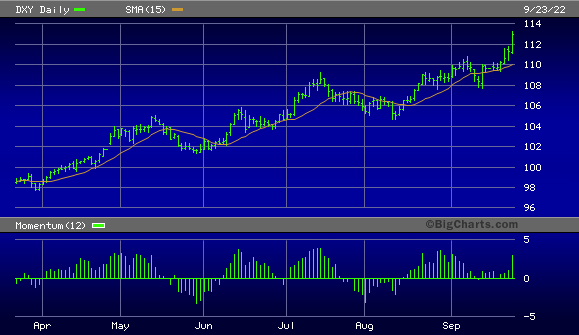
Neither the dollar index nor the major stock market averages fully illustrate just how bad the situation is in the financial market right now. A better indication of just how weak the equity market is can be seen in the ever-expanding number of stocks making new 52-week lows on the Nasdaq and the NYSE. As of September 23, new lows on both the Big Board and the Nasdaq were well above 1,000 and some of the highest levels we’ve seen all year. This is a massive red-light signal that the market is right now completely in the control of the sellers.
Meanwhile, internal momentum for the hyper-sensitive small cap stocks continues to deteriorate. The 4-week rate of change (momentum) for the Russell 2000 stock universe just can’t catch a break and continues to collapse, as the following chart shows. With this indicator in decline, it tells us that the near-term path of least resistance for the small cap stocks remains down. As a general rule of thumb, what bodes ill for the small caps, bodes ill for the rest of the market.
Wall Street Journal Data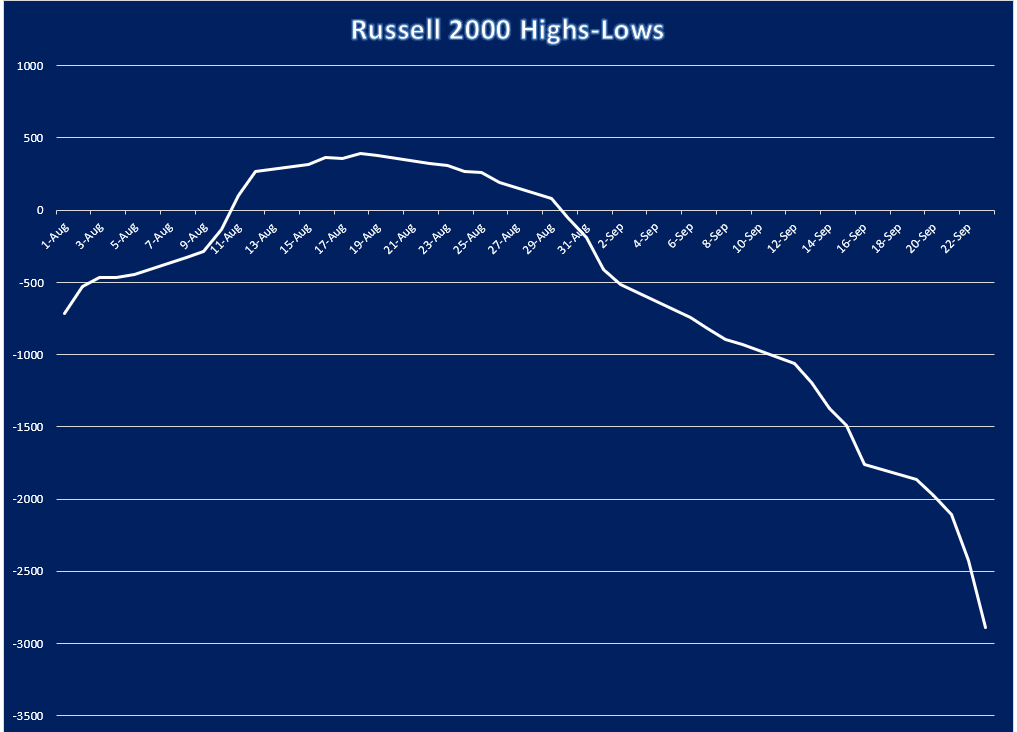
The catalyst for the latest waterfall decline was of course the Fed’s latest interest rate hike. The market was well aware that the fed funds rate would likely be increased by 75 basis points to 3.00-3.25%, but what it didn’t want to hear was the Fed’s guidance that more rate hikes would be coming before the end of the year.
To be exact, Fed Chairman Powell said investors can expect another 100 to 125 basis points of tightening this year and indicated the fed funds rate would surely reach 4.6%, which is the Fed’s median estimate for next year and, presumably, the new “terminal rate.”
As is often the case, however, it can be argued the Fed is very much behind the curve in its seemingly eternal battle to control inflation. While conventional wisdom says that interest rates should be continually raised in order to lower the currently high inflation rate, there are some conspicuous signs that the inflation problem has already been taken care of.
Consider the collapse in the six-month growth rate of M2 money supply. The following chart speaks volumes of how rapidly money supply growth has reversed in recent months and suggests that by some point in the coming six-to-nine months, we should start seeing a noticeable deceleration in retail price inflation.
Calafia Beach Pundit Blog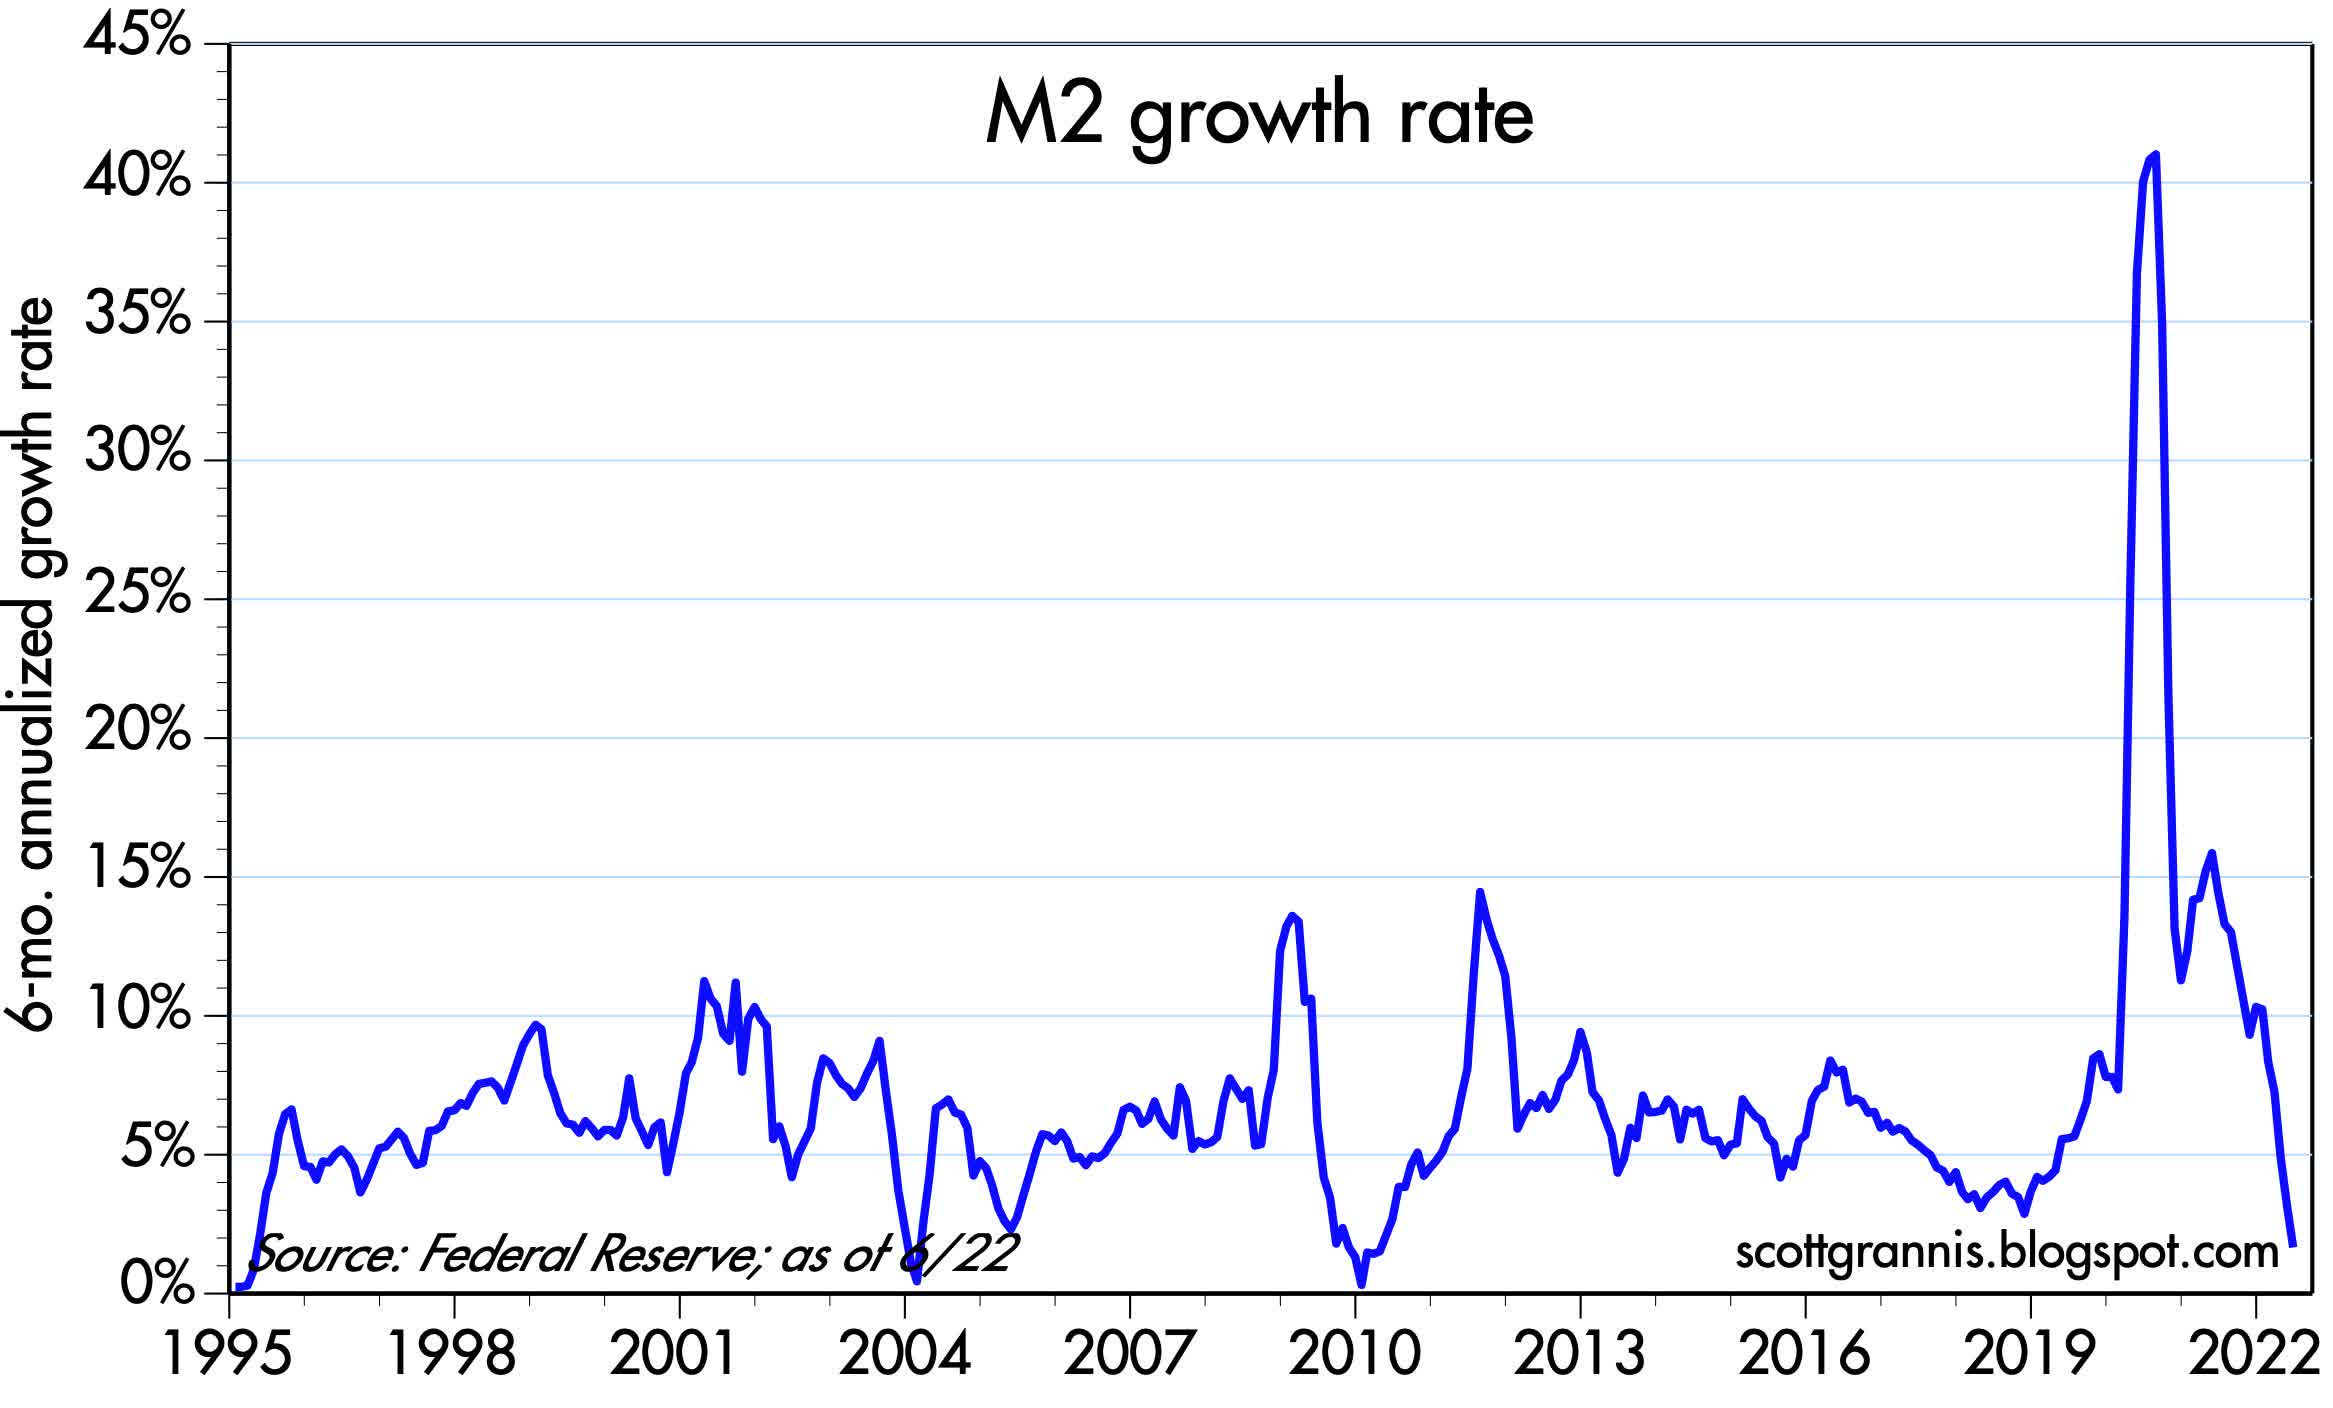
Then there is the drop in commodity prices along with the corresponding rally in the dollar index, mentioned above. Indeed, dollar strength is another sign that inflation is likely to be tamed by market forces as we head into 2023 without the need for further Fed policy tightness. As Scott Grannis noted in a recent blog, “…money is already tight enough to impact the economy, and more could be destructive.”
On that score, one of the most salient indicators that a recession lies on the horizon is the observation made famous by the celebrated Wall Street economist, Dr. Ed Yardeni, that “Recessions cause bear markets.” Only in the present case, the bear market in equities seems to be presaging an economic recession. And if the Fed continues to press ahead with its proposed rate hikes, an economic contraction of potentially terrific proportions will likely result.
For investors, a defensive stance is recommended while interest rates are rising and the new 52-week lows on both major exchanges are well above normal (i.e., above 40 on a daily basis). It’s really anyone’s guess when and where the bear market will finally end, but one thing seems fairly certain: as long as the Fed remains committed to tightening, the bears will have an easier time than the bulls having things go their way.
Be the first to comment