

Gold, Crude Oil, Economic Data, Golden Cross – Talking Points
- Gold eyes high-impact economic data including PCE this week
- Crude oil strength supported by bullish technical picture
- XAU/USD puts in bullish “Golden Cross” technical formation
Gold could be in for quite the move in the coming days. The Federal Reserve’s most harped-on narrative – being the view that rising prices are “transitory” – may be challenged by several potentially hard-hitting economic events out of the United States this week. The yellow metal saw a big drop last week after the Fed signaled it may begin raising rates sooner than previously expected.
Thursday will see durable goods orders for May, and the final first-quarter read on gross domestic product (GDP) cross the wires. On Friday, the week will wrap up with the core personal consumption expenditure (PCE) print for May. According to the DailyFX Economic Calendar, analysts expect to see durable goods orders print at 2.8%, up from -1.3% in April. No change is expected in GDP at 6.4%.
That leaves PCE, with the core figure – which strips out volatile energy and food prices – looking at a 3.4% expected rise, up from 3.1% in April. The Fed’s baseline average inflation target is set at 2.0%, and while the US central bank concedes that we are likely to see higher prices as supply chain issues are ironed out, a higher-than-expected figure could fuel hawkish bets on policy expectations.
If that scenario plays out, rate traders could send Treasury yields higher, in turn, putting upside pressure on the US Dollar. A stronger US Dollar bodes poorly for gold prices by making it more expensive for non-USD currency holders to buy the asset. The question is, how high and for how long can upward price pressures last before the market disengages from the Fed’s “transitory” narrative?
Gold Technical Forecast
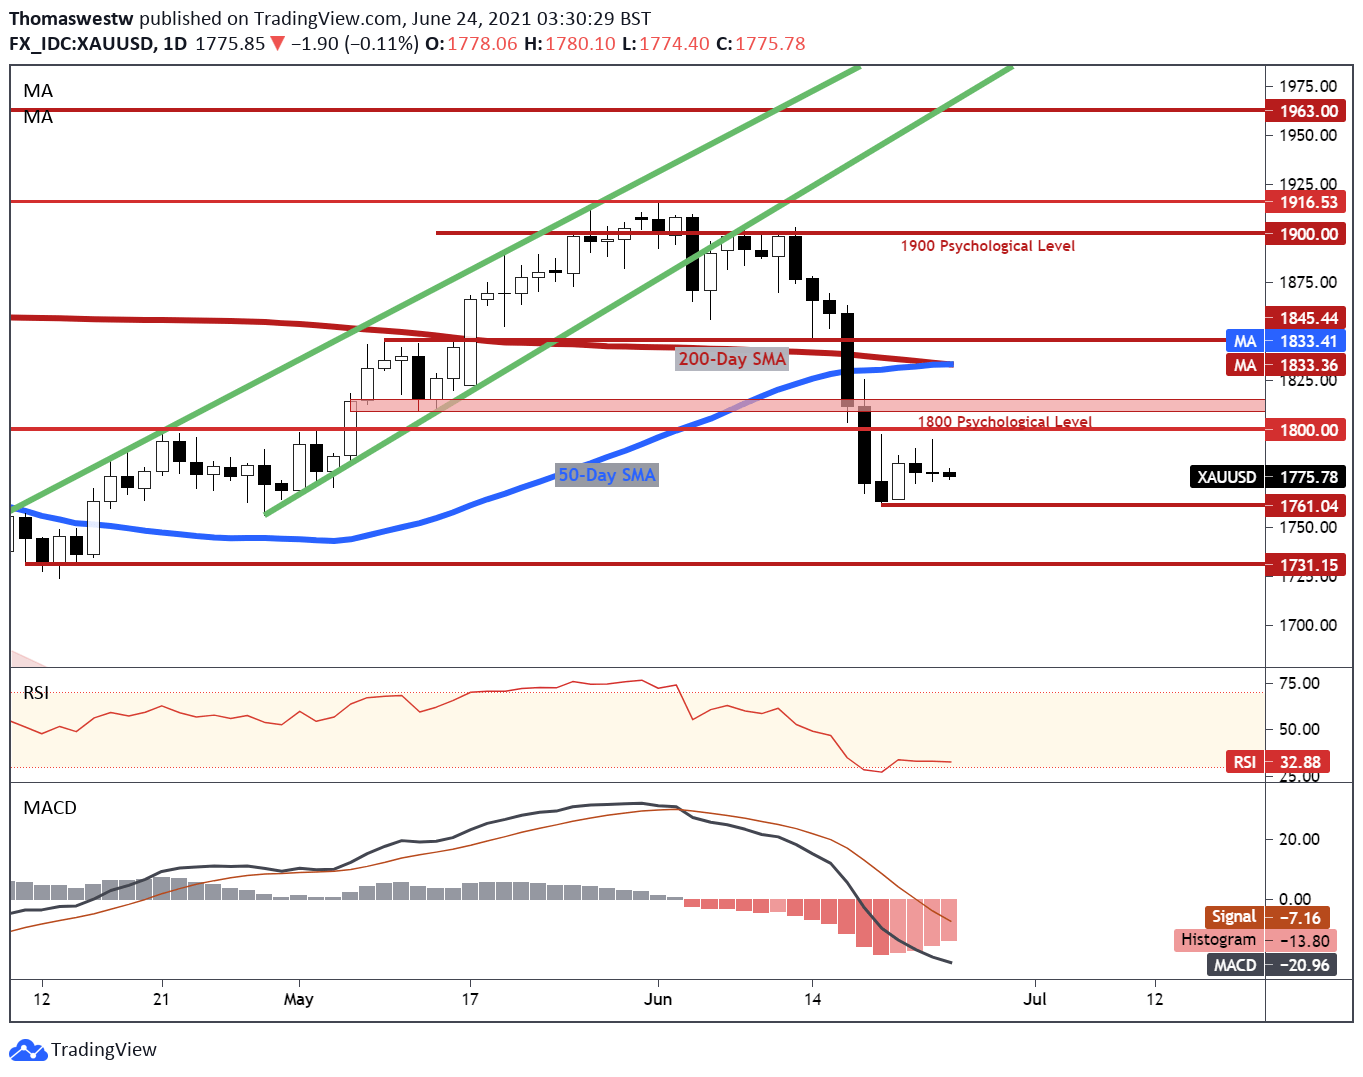
Despite the dramatic fall in prices, the yellow metal’s technical posture looks due for a corrective move higher. A bullish Golden Cross formation between the 50- and 200-day Simple Moving Averages suggest upside momentum may soon emerge. The 1,800 psychological level poses the most immediate near-term resistance. Alternatively, the recent swing low at 1761.04 could provide a support zone to the downside.
Gold Daily Chart
Chart created with TradingView
Crude Oil Technical Forecast
Crude oil prices have been on the up for the better part of the last two months. Price broke out from a Rising Triangle pattern earlier this month. Since then, MACD has continued to rise, breaking a negative divergence in the oscillator. The next upside targets are the 161.8% Fibonacci extension and the October 2018 swing high at 76.90.
Crude Oil Daily Chart
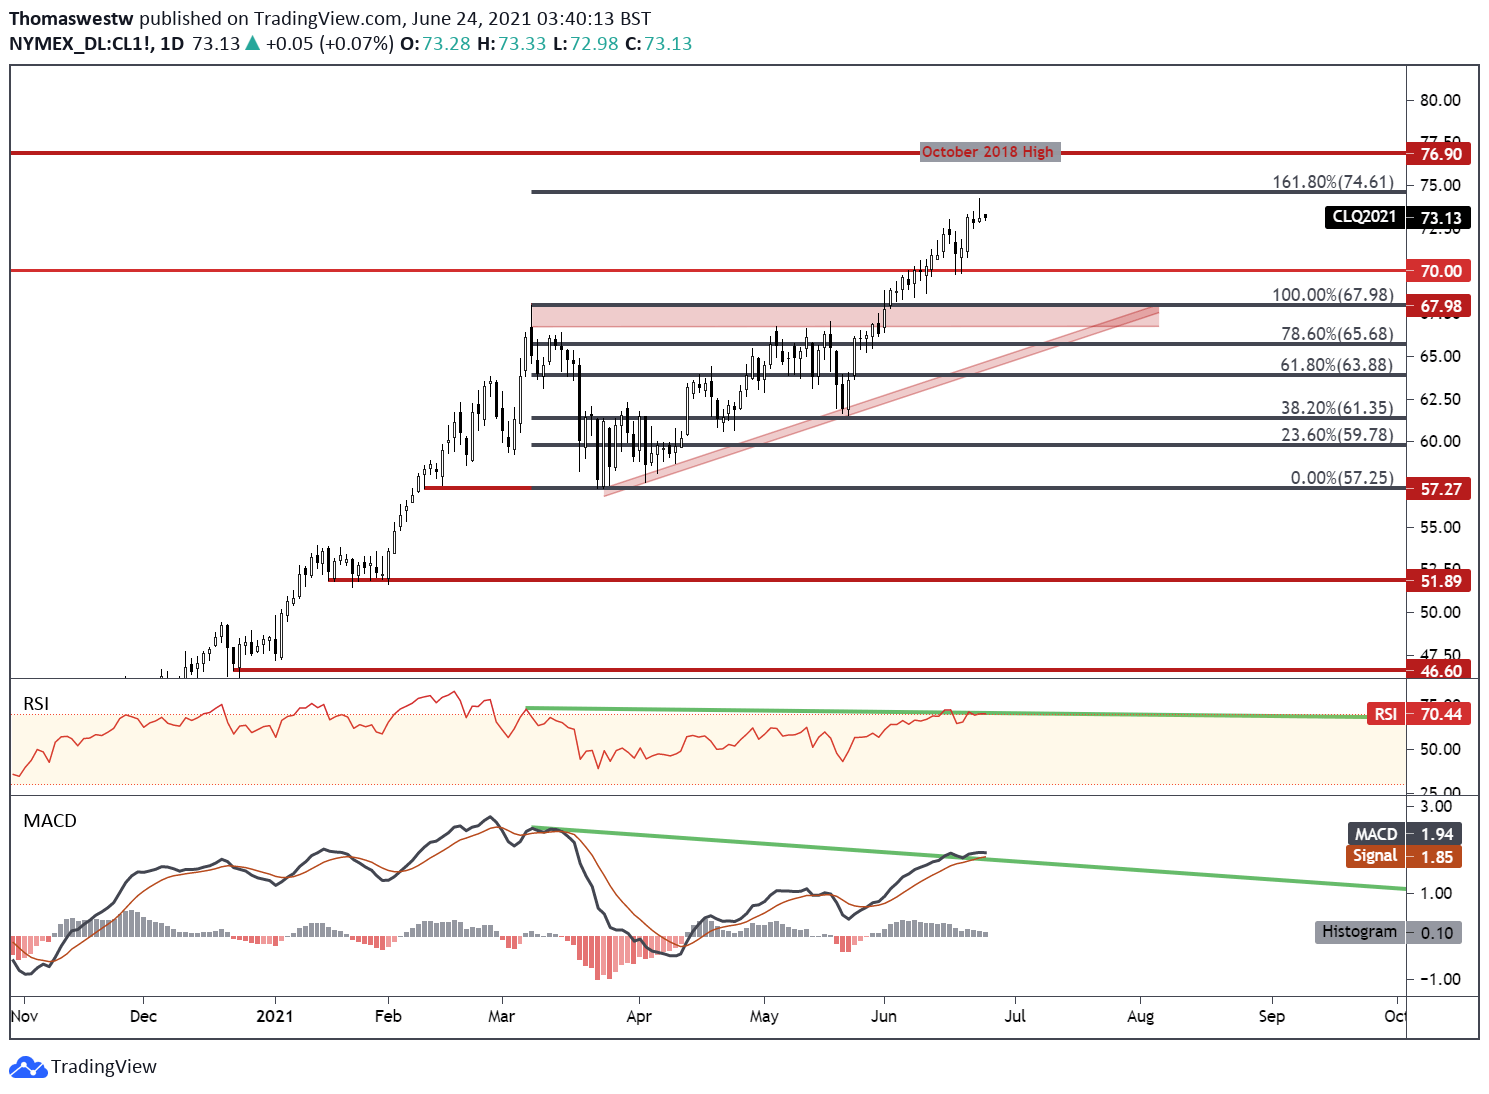
Chart created with TradingView
Gold, Crude Oil TRADING RESOURCES
— Written by Thomas Westwater, Analyst for DailyFX.com
To contact Thomas, use the comments section below or @FxWestwateron Twitter
Be the first to comment